World Environment

p-ISSN: 2163-1573    e-ISSN: 2163-1581

2013;  3(3): 108-115

doi:10.5923/j.env.20130303.06

Evaluation of Air Pollution Tolerance Index of Plants and Ornamental Shrubs in Enugu City: Implications for Urban Heat Island Effect

Enete I. C1, Chukwudeluzu V. U.2, Okolie A. O.3

1Dept. of Geography & Meteorology, Nnamdi Azikiwe University, Awka

2Dept. of Geography & Meteorology, Enugu State University of Science & Technology

3Dept. of Architecture, Anambra State University, Uli

Correspondence to: Enete I. C, Dept. of Geography & Meteorology, Nnamdi Azikiwe University, Awka.

Email:

Copyright © 2012 Scientific & Academic Publishing. All Rights Reserved.

Abstract

The study compared the air pollution tolerance indices (APTI) of five plant species and five ornamental shrubs in Enugu Urban. Laboratory analysis was performed on the four physiological and biological parameters including leaf relative water content (RWC), ascorbic acid (AA) content, total leaf chlorophyll (TCH) and leaf extract pH. These parameters were used to develop an air pollution tolerance index. Factor analysis and descriptive statistics were utilized in the analysis to examine the interactions between these parameters. The study also showed the possibility of utilizing APTI as a tool for selecting plants or ornamental shrubs for urban heat Island mitigation in Enugu City. The result of APTI showed order of tolerance for plants as Anacarduim occidentale (23.20), Pinus spp (22.35), Catalpa burgei (22.57), Magifera indica (23.37), and Psidum guajava (24.15). The result of APTI showed increasing order of sensitivity for ornamental shrubs from Ixora red (14.32), Yellow ficus(12.63), Masquerade pine(12.26), Tuja pine(11.000), to Yellow bush(10.60). The APTI of all the plants examined were higher than those of ornamental shrubs; thus, suggesting that plants in general were more tolerant to air pollution than ornamental shrubs.

Keywords: Apti, Plants, Ornamental Shrubs, Bioindicator, Air Pollution, Factor Analysis

Cite this paper: Enete I. C, Chukwudeluzu V. U., Okolie A. O., Evaluation of Air Pollution Tolerance Index of Plants and Ornamental Shrubs in Enugu City: Implications for Urban Heat Island Effect, World Environment, Vol. 3 No. 3, 2013, pp. 108-115. doi: 10.5923/j.env.20130303.06.

1. Introduction

Urban pollution remains a threat to human health, and this is expected to increase reasonably as industrial and vehicle ownership increase globally. The urban air quality is continuously affected by emissions from both stationary and mobile combustion sources. Major pollutants that contribute to poor urban air quality includes: Carbon monoxide (CO2), nitrogen oxides (NOx), Sulphur oxides (SOx), particulate matter (PM), Lead (Pb), photochemical oxidents such as Ozone (O3) and Ozone precursors like hydrocarbons and volatile organic compounds[1]. Over 600 million people globally are exposed to these hazardous pollutants[2]. For example, nitrous oxide (NO2) is responsible for immune system impairment, exacerbation of asthma and chronicres piratory diseases: reduced lung function and cardiovascular disease[3]. Particulates are dangerous and are said to be facilitators in the development of lung cancer and increase rate of mortality[3]. Developing cities in Africa are at high risk of exposure to air pollution. According to Autrup[4], research conducted in Ethiopia, Mozambique,Kenya and Republic of Benin show that there is a high level of DNA damage in urban residents and higher prevalence of asthma in urban school children exposed to air pollution compared to their counterparts in the rural areas.
Urban environments rely on vegetation to provideecosystem functions such as air filtering, temperature amelioration and water storage filtration and drainage[5]. The vegetation of urban areas has societal values in defining nature for millions of people living in cities and sustaining public health and well-being[6; 7; 8] as well as often contributing to the conservation estate by supporting unique biodiversity[9; 10; 11]. Thus, the urban environment provides a unique opportunity to meld ecological management with landscape design to provide a variety of societal goods and services [12].
Urbanization negatively impacts the environment mainly by the production of pollution, the modification of the physical and chemical properties of the atmosphere, and the challenges of land use patterns. Considered to be a cumulative effect of all these impacts is the Urban Heat Island (UHI), defined as the rise in temperature of any man-made area, resulting in a well-defined, district “Warm Island” among the “Cool Sea” represented by the lower temperature of the areas of nearby natural landscape[13; 14; 15]. Though UHI may form on any rural or urban area and at any spatial scale, cities are favored, since their surfaces are prone to release large quantities of heat. Climate Change of urbanized zones at the local scale is also due to the scarcity of parklands; grass being replaced by vast concrete surfaces where chains of buildings are built[16]. All these cause change in the energy balance of the urban area often leading to higher temperatures than surrounding rural areas. The energy balance is also affected by the lack of vegetation in urban areas, which inhibits cooling byevapotranspiration[14].
Vegetation intercepts radiation and produce shade that also contribute to reduce urban heat release. The decrease and fragmentation of large vegetated areas such as parks not only reduce these benefits but also inhibits atmospheric cooling due to horizontal air circulation generated by the temperature gradient between vegetated and urbanized areas (advection), which is known as the ‘park cooling effect’. Street plants and shrubs are highly effective at ameliorating urban warmth at the micro-scale (referring to ground to building height). Tree shading reduces the amount of heat stored within urban surfaces while ornamental shrubs reduce urban heat Island by cooling the air layer above them using water from transpiration.
Vegetation in Enugu City has been exposed to a variety of pollution effects. The ability of plant species to remove pollutants has been evaluated[17]. According toJayashnee [18], plants ability to detoxify the air is one of the arguments for saving plants. Using plants as indicator of air pollution gives the possibility of synergistic action of pollutants[19]. Trees with high APTI are considered tools for selecting shed plants for selecting trees for UHI reduction strategies[20]. The ambient environment of an urban area may becontaminated with several pollutants, such as Sulphur dioxide (SO2), Carbon monoxide (CO), Nitrous oxide (NO2 ) and heavy metals, and the plants growing there would be exposed not only to one but too many pollutants and their different conditions. Air pollution tolerance index is used bylandscapers to select plants or Ornamental shrubs to abate air pollution[21].
There are many factors controlling tolerance in plants. For example, the importance of pH in modifying the toxicity of SO2 has been shown. Singh and Verma[22] reported that plants with lower pH are more susceptible, while those with pH around 7 are more tolerant. Ascorbic acid content is another parameter that may be used to decide the tolerance of plant to air pollution. It plays a significant role in light reaction of photosynthesis[22], activates defense mechanism [23], and under stress condition, it can replace water from light reaction[22]. Joshin and Swami[24] also reported that ascorbic acid is a natural antioxidant in plants that play an important role in pollution tolerance. It is also a factor in cell wall synthesis, defense and cell division. It is also a strong reducer and plays important role in photosynthetic carbon fixation, with the reducing power directly proportional to its concentration. So it has been given top priority and used as a multiplication factor in the formula. High pH may increase the efficiency of conversion from hexose sugar to AA, while Low leaf extract pH has also shown good correlation with sensitivity to air pollution[25; 26; 27; 28].
Total chlorophyll (TCh) is another parameter in APTI that is so important. Depletion in Chlorophyll immediately causes a decrease in productivity of plant and subsequently plant exhibits poor vigor. Photosynthetic efficiency was noted to be strongly dependent on whether leaf pH is low or high[22].
Water is a necessity for plant life. Shortage of water may cause severe stress to terrestrial plants[22]; High water content within the plants body will help to maintain its physiological balance under stress conditions such asexposure to air pollution when the transpiration rates are usually high. In this study, air pollution tolerance of five plant species and five ornamental shrubs currently growing in Enugu City were compared. The aim was to determine which species has high air pollution tolerance capacity, thereby growing it broadly as the major urban plants in response to UHI impacts in Enugu City.

2. A Conceptual Framework for Utilizing APTI on Urban Floras

The pool of plant species found in urban areas is fed from three sources: native species originally present in the area; regionally native species originally absent from the area that colonize novel habitats created by urbanization; and alien species introduced by humans that escape to establish wild populations in urban environments[29]. Urban floras are a subset of the species pool after passage through four fitters. These are habitat transformation; habitat fragmentation; urban environmental conditions; and human preference. Each of these filters represents a selection pressure that can leave a signature on urban floras from which we might gain ecological and evolutionary insight. Selection pressures can lead to non-random species gains and losses, change in species abundances within communities to altereddistributions of plant functional traits, and changes to the phylogenetic distribution of species within the urban flora. These filters can also act as agents of natural environments[30]. The four urbanization filters operate simultaneously as urban centers develop, making it difficult to isolate single drawers of individual species losses or gains.
Urbanization results in loss of natural habitats, but thus creates a set of new anthropogenic habitats (eg. Parks, pavement, gardens and lawns, road and rail verges, vacant lots). These urban plant assemblages are facing a new set of selection pressure from air pollution. The threat of air pollution has increased because of increased traffic, high population and concentration of industries in our urban centers that generate greenhouse gases and other heavy metals. Several contributors agree that air pollution affects plants growth adversely[31; 32]. Air pollutants can directly affect plants through leaves or indirectly from soil acidification[33]. When exposed to airborne pollutants, most plants experience physiological changes before exhibiting visible damage to leaves[34]. This new threat, therefore, calls for a new approach in the selection processes of urban biodiversity. The idea is to select species that will be resistant and tolerant to the high level of air pollution witnessed currently in urban centers.
Air pollution tolerance index is one approach that may be employed in the selection processes of urban biodiversity. The response of plants to air pollution at physiological and biochemical levels can be understood by analyzing the factors that determine resistance and susceptibility. Plants growing in polluted environments often respond and show significant changes in their morphology, physiology and biochemistry. Lakshmi[19] reported that plants that are constantly exposed to environmental pollutants absorb, accumulate and integrate these pollutants into their systems. As such, Singh and Verma[22] by using the data obtained from detailed biochemical estimations of plants samples (including chlorophyll, ascorbic acid content, and pH and relative water content) calculated the air pollution tolerance index (APTI).

3. Materials and Methods

3.1. Sampling Procedure

Plants and Ornamental shrubs were selected from one of the major roads within Enugu Urban area - Agbani Road. The criterion for the selection of these plants andornamentals was mainly on their availability in other parts of Enugu urban area. Also, the choice of this route was based on its high traffic population. Six replicates of fully matured leaves were taken and immediately taken to the laboratory in a heatproof container for analysis. The leaf fresh weight was taken immediately upon getting to the laboratory.

3.2. Air Pollution Tolerance Index Technique

To obtain the four parameters in APTI formula, Samples were treated as follows:

3.3. Relative Leaf Water Content (RWC)

The method described by[35] and[36] was applied to determine and calculate relative leaf water content as follows:
(1)
FW = Fresh weight
DW= Dry weight
TW=Turgid weight
Fresh weight was obtained by weighing the fresh leaves. The leaves were then immersed in water over night at 70℃ and reweighed to obtain the dry weight.

3.4. Total Chlorophyll Content (TCh)

Following the method described by[36], TCh analysis was obtained as follows: 0.5g fresh leaves material was grounded and diluted to 10ml in distilled water. A subsample of 2.5 ml was mixed with 10ml acetone and filtered. Optical density was read at 645 nm (D645) and 663nm (D663). Optical density of TCh (CT) is the sum of chlorophyll a (D645) density and chlorophyll a (D663) density as follows:
(2)
TCh= (mg/g DW) was calculated as follows
(3)

3.5. Ascorbic Acid (AA) Content Analysis

Ascorbic acid content (expressed in mg/g) was measured using spectrophotometric method[37]. 1g of the fresh foliage was put in a test-tube, 4 ml oxalic acid EDTA extracting solution was added, them 1 ml ofOrthophospheric acid and then 1 ml 5% tetraoxosulphate (vi) acid added to this mixture, 2 ml of ammonium molybdate was added and then 3ml of water. The solution was then allowed to stand for 15 minutes after which the absorbance at 760nm was measured with a spectrophotometer. Theconcentrations of ascorbic acid in the sample were then extrapolated from a standard ascorbic.

3.6. Leaf Extract PH

This was done following the method adapted by[36]. 5g of the fresh leaves was homogenized in 10ml demonized water. This was filtered and the pH of the leaf extract determined after calibrating pH water with buffer solution of pH 4 and 9.

3.7. Air Pollution Tolerance Index (APTI) Determination

This was done following the method of[38]. The fornular of APTI is given as:
(4)
A = Ascorbic acid content (mg/g)
T = Total Chlorophyll (mg/g)
P = pH of leaf extract
R = Relative water content of leaf (%)

3.8. Statistical Analysis

Factor analysis and descriptive statistics were theinstruments used in the analysis. Factor analysis is a data reduction technique concerned with exposing the underlying structure exhibited by a group of variables that are not necessarily independent or orthogonal. By this technique a fewunderlying dimensions (high-order variables) are located out of a large pool of variables in which no distinction has been made between independent and dependent variables.

4. Results

The analysis value of the four biochemical parameters along with the calculated APTI for the five tree species and five ornamental shrubs are shown in table 1 and table 2 respectively.
From Table 1, it was evident that the plants showed varied degree of tolerance index to air pollution. The APTI of the plant ranged from 22.20 to 24.15 with Psiduim guajava having the highest value and Anacardium occidentale with the lowest value. Table 2 shows the air pollution tolerance index of some selected ornamental shrubs. The air pollution tolerance index ranged from 10.60 to 14.32 with Ixora red having the highest APTI value and Yellow bush with the lowest.
Employing the factor analysis, the varimax orthogonal rotation was utilized to maximize variances and to place the factor axes in a unique position such that the factors can be interpreted by the factor loadings. After this varimax orthogonalization, the five variables were reduced to three and two variables for plant and shrubs respectively. The five factors with their variable loadings on plants and shrubs sampled are presented in tables 3 and 4 respectively. In table 3, three plants loaded very high and they include Catalpa burgei (0.62252), Magifera indica (1.04735), Pine (Pinus spp -1.5023); while two plants loaded highly for shrubs and they include Ixora red (1.49760), Yellow bush -1.3107).
Table 5 shows the unde r-canopy temperature range of some plants with their air pollution tolerance index.

5. Discussion

Air pollution tolerant index is an index that denotes capability of vegetation to combat air pollution. Plants or shrubs that have higher index value are tolerant to air pollution and can be a sink pollution, while plants or shrubs with low index value show less tolerance and can be used to indicate levels of air pollution[38]. Sensitivity of plants is expressed by low air pollution tolerance index values. Based on the previous studies[19; 36], APTI values can be utilized as bioindicators of the air quality, while those species in the tolerant group are utilized for streetscape greening. An overview of the result obtained from this current study reveals that different plants and shrubs respond differently to air pollutants (table 1 and table 2). The APTI of the five tree species ranged from 22.20 to 24.15 while the APTI values for ornamental shrubs ranged from 10.60 to 14.32. Based on their APTI values, both plants and ornamental shrubs were conveniently grouped based on the reports of[19] as follows:
APTI value: Response
30 to 100: Tolerant
29 to 17: Intermediate
16 to 1: Sensitive
<1: Very Sensitive
Table 1. Air pollution Tolerance Index (APTI) of selected plants
     
Table 2. Air Pollution Tolerance Index of Selected ornamental Shrubs
     
Table 3. Factor Loads of Plant parameters
     
Table 4. Factor loads of Shrub Parameters
     
Table 5. Comparing Under-Canopy Temperature and APTI
     
In the current study, the five plant species showed APTI values between 22.20 to 24.15 which falls within the classification range of 17 to 29 and are designated as intermediate. The APTI values of ornamental shrubs ranged from 10.60 to 14.32 which falls within the classification range of 1 to 16 and thus designated as sensitive. The variation of the APTI of both plants and ornamental shrubs can be attributed to the variation in any of the four physiological factors which governs the computation of the index.
Chlorophyll content of plants signifies its photosynthetic activity as well as the growth and development of biomass. It is well evident that chlorophyll content of plants or shrubs varies from species to species; age of leaf and also with the pollution level as well as with other biotic and abiotic conditions[39]. It also varies with the tolerance as well as sensitivity of the plant or shrub species; as such, higher the sensitive nature of the plant species, the lower the chlorophyll content[40; 41].In this study, total chlorophyll content (TCH) load of Shrubs ranged from 9.10 (Yellow bush) to13.17 (Yellow ficus); while Plants showed a higher value ranging from 11.60 (Catalpa burgei). See tables 3 and 4.
Ascorbic acid is a strong reactant and it activates many physiological and defense mechanism. Its reducing power is directly proportional to its concentration[42; 43]. Being very important reducing agents, ascorbic acid also plays a vital role in cell wall synthesis, defense and cell division[27]. Current study showed elevation in the concentration of ascorbic acid on plants than shrubs. See values of Ascorbic acid (AA) loads on tables 3 and 4. Pollution load dependent increase in ascorbic acid content of all species may be due to the increased rate of production of machine oxygen species (ROS) during photic oxidation of SO2 to SO3 where sulfites are generated from SO2 absorbed. Chaudhary and Rao[44] and Varshney and Varshney[45] are of the opinion that higher ascorbic acid content of the plant is a sign of its tolerance against sulphur dioxide pollution. In the present study, higher levels of ascorbic acid content in the leaves of plants suggests their tolerance towards the pollutants. Lower ascorbic acid contents in the leaves of shrubs supports the sensitive nature of these plants towards pollutants.
All the species sampled exhibited a pH towards acidic side, which may be due to the presence of SO2 and NOx in the ambient air causing a change in pH of the leaf sap towards acidic site[46]. The changes in leaf extract pH might influence stomata sensitivity due to air pollutants. The plant or shrub with high sensitivity to SO2 and NO2 close their stomata faster than when they are not exposed to pollutants [47]. Consequently, sensitive plants had higher leaf-extract pH than tolerant plants. Similar result was obtained in the present investigation. High pH may increase the efficiency of corrosion from hexose sugar to Ascorbic acid, while low leaf extract pH showed good correlation with sensitivity to air pollution[25] and[26].See tables 3 and 4.
Relative Water Content (RWC) of a leaf is the water plant has in it relative to its full turgidity. Relative water content is associated with protoplasmic permeability which in cells cause loss of water and dissolved nutrients, resulting in early senescence of leaves[48]. Current study showed higher relative water content for both plants and shrubs. However, plants have higher relative water content and as such, appears more tolerant to pollutants. Similar result was obtained by[41].
The APTI of all the plants examined were higher than those of ornamental shrubs. Again, the factor analysis examined showed that the five parameters loaded more on plants than shrubs suggesting that plants in general were more tolerant to air pollution than ornamental shrubs. Similar study of air pollution tolerance index was also conducted by[49, 36, 50, 51, 52, 53, 54, and 55].The result of this current research finding contradicts earlier study by[56] that showed that APTI of ornamental shrubs were higher than plants. The plausible reasons for these differences could be because of study location, (while this current research is in Africa, Yan-Ju and Hui’s work was in China); also difference in developmental level and Climate change and Climate variability could be other factors that causedchanges in the result.
Plants and ornamental shrubs are recommended for pollution abatement in urban areas, for aesthetic improvement or for microclimate modification. The sensitive species help in indicating air pollution and tolerant ones help in abatement of air pollution[19]. On the other hand, APTI is a handy tool for selecting tolerant species for urban heat island reduction. Therefore, plant or ornamental shrubs selection criteria should not only be limited to colorful flower and leaves, robustness and shed but it should also be able to help improve air quality by having high pollution tolerance[57].
In the current study tolerant and intermediate species are recommended for planting in Enugu city. They will not only abate air pollution but also provide shed, thus modifying the urban microclimate. For example, table 5 revealed that most plants like Mangifera indica and Psiduim guajava has both high APTI and the ability to contribute to UHI reduction. In this study, all the plants studied are intermediate while all the ornamentals are sensitive. The implication is that under high stress and heavy pollution plants may not function properly while ornamentals should be utilized as bioindicators.

6. Conclusions

Air pollution tolerance index determination is important because with increased urbanization, industrialization and traffic population increase in Enugu urban city, there will be more air pollution. The results of such studies are therefore handy for future planning. This study also provides useful information for selecting tolerant species for landscaping and urban heat island reduction. The current study also showed that plants are more tolerant to air pollution than ornamental shrubs; and as such should be preferred for streetscaping/ landscaping and climate modification in our urban cities. Species ranked as tolerant and intermediate tolerant should be considered in advance for use. Species ranked as sensitive help as bioindicators of urban air quality. The implication of this study for urban heat island is that tree selection for urban heat island reduction should be based on APTI and not just on colorful flower, and leaves, robustness, and shed.

References

[1]  Costa, D.L. (2001). Air pollution. In Casarett and Doull’s toxicology: the basic science of poisons, sixth edition (Ed) Klaassen, C.D., Mcgraw-Hill, N.Y. USA. pp.979-1012
[2]  United Nation (1998). Prospect of world urbanization (Population Study No.112), New York
[3]  Schwela, D (2000).Air pollution and health in urban areas. Reviews on Environmental Health, 15(12):13-14.
[4]  Autrup, S.E(2006). Survey of air pollution in Cotonou, Benin-air monitoring and biomarkers, Science of Total Environment, 358(1-1):85-96
[5]  Bolund, P and Hunhammers, S (1999). Ecosystem services in urban areas. Ecological Economics, 29:293-301
[6]  Ulrich, R.S (1984). View through a window may influence recovery from surgery. Science, 224:420-421
[7]  Kuo, F.E and Sullivan, W.C (2001). Environment and crime in the inner city-does vegetation reduce crime? Environment and Behaviour, 33:343-367
[8]  Fuller, R.A. Irvine, K.N, Devine-Wright, P, Warren, P.H and Gaston, K.J(2007). Psychological benefits of green space increase with biodiversity. Biology letters, 3:390-394
[9]  McDowell, C.R, Low, A.B and Mckenzie, B (1991). National remnants and corridors in Greater Cape Town: their role in threatened plant conservation. In the role of corridors (eds) D.A Saunders and R. J. Hobbs, Survey Beatty and sons, chipping Norton, NSW.
[10]  Schwartz, M. W. Jurjavice, N. L. and O’ Brien, J. M(2002).Conservation’s disenfranchised urban poor. Bioscience, 52: 601-606.
[11]  Lawson, D. M. Lamar, C. K and Schwartz, M.W (2008). Quantifying plant population persistence in human - dominated landscapes. Conservation Biology, 22:922-928
[12]  Pickett, S.T.A. Cadenasso, M.L (2008). Linking ecological and built components of urban mosaics and open cycle of ecological design. Journal of Ecology, 96:8-12
[13]  Landsberge, H. E (1981). The Urban Climate. National Academy press, New York, p.275.
[14]  Oke, T.R (1982). The energetic basis of urban heat Island. Quarterly Journal of the Royal meteorological society, 108 (455):1-24
[15]  Voogt, J.A. (2002). Urban heat Island. In Munn, T. (ed), Encyclopedia of Global Change. Wiley, New York, pp. 660-666.
[16]  Makhelouf, A (2009). The effect of green spaces on urban climate and pollution. Iran journal of Environmental Health Sciences and Engineering, 6(1):35-40.
[17]  Liu, Y.J. Mu, Y. J and Zhu, Y.G (2007). Which ornamental plants species effectively remove benzene from indoor air? Atmosphere environment, 51:650-654.
[18]  Jayashnee, N(2012) ‘Air Controll’ The Times of India, October, 28
[19]  Lakshmi, P.S. Sravanti, K.L and Srinivas, N (2008). Air pollution tolerance index of various plant species growing in industrial areas. The Ecoscan, 2(2). 203-206.
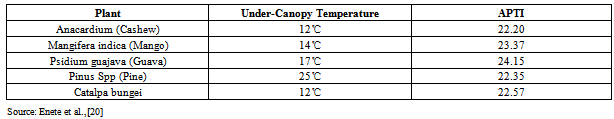
[20]  Enete, I.C. Alabi, M.O and Chukwudelunzu, V.U (2012a). Tree Canopy Variation effects on urban heat Island in Enugu City, Nigerian. Developing Country Studies, 2(6):12-18.
[21]  Agbaire, P.O (2009). Air pollution tolerance indices of some plants around Erhoike-kokori oil exploration site of Delta state, Nigeria. International journal of physical sciences, 4: 366-368.
[22]  Singh, S. N and Verma, A (2007). Phytoremediation of Air Pollutants: A Review. In: Environmental Bioremediation technology, Singh, S. N. and Tripathi, R.D (eds). Springer Berlin Heidelberg, pp 293-314.
[23]  Arora, A Sairam, R.K and sirvastava, G.C (2002). Oxidative stress and antioxidative system in plants. Current Science, 82:1227-1238.
[24]  Joshni, P. C and Swami, A (2007). Physiological Responses of some tree species under roadside automobile pollution stress around city of Haridwar, India. Environmentalist, 27:365-374
[25]  Escobedo, F.J. Wagner, J.E. Nowak, D. J. Dele Maza, C. L. Rodriguez, M and Crane, D.E (2008). Analyzing the cost effectiveness of Santiago, Chiles Policy of using Urban forests to improve air quality. Journal of Environmental Management, 86: 148-157.
[26]  Pasqualini, S. Batini, P. Ederli, L (2001). Effects of short-term ozone fumigation on tobacco plants: response of the scavenging system and expression of the glutathione reductase, Plant cell environment, 24:245-252
[27]  Conkin, P. (2001). Recent advance in the role and biosynthesis of ascorbic acid in plants. Plant cell Environment, 24: 383-394
[28]  Liu, Y. J and Ding, H (2008). Variation in air pollution tolerance index of plants near a steel factory: Implication for landscape-plant species selection for industrial areas. Environmental development, 4:24-32
[29]  Williams, N.S. Schwartz M.W. Vesk, P.A. Mclarthy, M.A. Hahs, Ak> Clemants, S.E Courlett, R.T. Duncan, RP. (2009). A Conceptual Framework for predicting the effects of urban environments on floras. Journal of Ecology, 97:4-9
[30]  Cheptou, P.O., Carrue, O.Rouifed, S and Cantarel, A (2008). Rapid evolution of seed dispersal in urban environment in the weed crepts sancta. Proceedings of the National Academy of Sciences of the United States of America, 105:3796-3799.
[31]  Rao, C.S. (2006). Environmental pollution controlEngineering. New Age International publishers, Revised second edition.
[32]  Bhatia, S.C. (2006). Environmental Chemisty. CBSPublishers and Distributors, India.
[33]  Steubing, L. Fangmier, A Both, R (1989). Effects of SO2, NO2 and O3 on population Development and morphological and physiological parameters of native herb layer species in a Beech Forest. Environmental pollution, 58:281-302.
[34]  Dohman, G. P. Loppers, A, Langebartels, (1990). Biochemical Response of Norway Spruce (Picea Abies (L) karst) Toward 14-months exposure to ozone and Acid mist, effect on amino acid, Glutathione and polyamine titers. Environmental pollution, 64; 375-383.
[35]  Singh, A. (1977): Practical Plant physiology. KalyariPublishers. New Dehli.
[36]  Agbaire, P.O and Esiefarinrhe, E(2009). Air Pollution tolerance indices of some plants around Otorogum gas plants in Delta State, Nigeria. Journal of Applied Sciences, and Environmental Management, 13:11-14.
[37]  Bajaj, K. L and Kaur, G(1981). Spectrophotometric Determination of ascorbic acid in vegetables and fruits. Analyst, 106:117-120.
[38]  Singh, S.K and Rao, D.N (1983). Evaluation of plants for their tolerance to air pollution, proceedings of the symposium on air pollution control, pp.218-224.
[39]  Katiyar,V and Dubey, P.S (2001).Sulphur dioxide Sensitivity on two stage of leaf development in a few tropical tree species. Journal of Environmental Sciences, Toxicology, 11:78-81
[40]  Beg, M.U., Farooq, M.H., Bhargava, S.K., Kidwai, M.U and Lal, M.M(1990). Performance of trees around a thermal power station. Envirnomental Ecology, 8:791-797.
[41]  Jyothi, J.S and Jaya, D.S(2010). Evaluation of air pollution tolerance index of selected plant species along roadsides in Thiruvananthapuram, Kerala. Journal of Environmental Biology, 31:379-386
[42]  Raza,S.H and Murthy, M.S.R (1988).Air pollution tolerance index of certain plants of Nacharam Industrial Area, Hyderabed, Indian. Journal of Botony,11(1):91-95
[43]  Lewis, S (1976). Vitamin C: Its molecular biology and medical potential, Academic press, London.
[44]  Chaudhary, C.S and Rao, D.N(1977). A Study of some factors in plants controlling their susceptibility to SO2 pollution. Proceedings of Indian National Science Academy, 43:236-241
[45]  Varshney, S.R.K and Varshney, C.K(1984). Effects of SO2 on ascorbic acid in crop plants. Environmental Pollution (Serial A), 35:285-290
[46]  Swami, A., Bhatt, D and Joshi, P.C(2004). Effects of automobile pollution on Sal (Shore robusta) and rohini (Mallotus phillipinensis) at Asarori, Dehradun. Himalayan Journal of Environment and ZOOLOGY,18(1):57-61
[47]  Larcher, W (1995). Physiological Plant Ecology. Berlin: Springer
[48]  Agrawal, L and Tiwari, S.L(1997). Susceptibility level of few plants on the basis of air pollution tolerance index. Indian Forester,1(2):319-322
[49]  Karthiyayini, R., Ponnammal, N.R and Joseph, R(2005). Air pollution tolerance index of certain plants of coimbatoreooty highways, near I.T.I Area, Coimbatore, Tamilnadu. Pollution Research, 24:363-365
[50]  Tripathi, A.K., Tiwari, P.B., Mahima, S and Singh, D(2009). Assessment of air pollution tolerance index of some trees in Moradabad City, India.Journal of Environmental Biology, 30(4):545-550
[51]  Chauhan, R.G(2010). Tree as bio-indicator of automobile pollution in Dehradum City. A Case Study. Journal of New York Science, 3(6):88-95
[52]  Abida, B and Harikrishna, S(2010). Evaluation of some tree species to absorb air pollutants in three in dustrial locations of South Bengaluru, India. E-Journal of Chemistry, 7(S1):51-56
[53]  Sirajuddin, M and Ravichandran, M(2010).Ambient air quality in an urban area and its effects on plants and human beings: A case study of Tiruchiraalli, India. Kathmandu University Journal of Science, Engineering and Technology, 6(2):13-19
[54]  Enete, I.C.,Ogbonna, C.E and Officha, M.C(2012b).Using trees as urban heat island reduction tool in Enugu City, Nigeria based on their air pollution tolerance index. Ethopian Journal of Environmental Studies and Management, 5(4-1):484-488.
[55]  Enete, I.C and Ogbonna, C.E(2012).Evaluation of air pollution tolerance index of some selected Ornamental Shrubs in Enugu City, Nigeria. Journal of Environmental Science, Toxicology and Food Technology, 1(2):22-25.
[56]  Yan-Ju, L and Hui, D (2008). Variation in air pollution tolerance index of plants near steel factory. Implication for landscape-plant species selection for industrial areas. Environmental Development, 1 (4): 24-30
[57]  Nugrahani, P. Prasetyawati, E. T. Sugijanto, O and Pumobasuki, H (2012). Asian Journal of Biological Sciences, 3(2): 298-302.