-
Paper Information
- Previous Paper
- Paper Submission
-
Journal Information
- About This Journal
- Editorial Board
- Current Issue
- Archive
- Author Guidelines
- Contact Us
World Environment
p-ISSN: 2163-1573 e-ISSN: 2163-1581
2013; 3(1): 29-36
doi:10.5923/j.env.20130301.04
The Effects of Dashen Brewery Wastewater Treatment Effluent on the Bacteriological and Physicochemical quality of Shinta River in Gondar, North West Ethiopia
 Abstract
 Reference
 Full-Text PDF
 Full-text HTML
Andargachew Belay , Samuel Sahile
Fuculity of Natural and Computational Science, University of Gondar, P.O.Box 196, Gondar, Ethiopia
Correspondence to: Samuel Sahile , Fuculity of Natural and Computational Science, University of Gondar, P.O.Box 196, Gondar, Ethiopia.
| Email: |  |
Copyright © 2012 Scientific & Academic Publishing. All Rights Reserved.
The objective of this study was to investigate the impact of Dashen brewery effluent on the bacteriological and some physicochemical qualities of Shinta River, Gondar town. Bacteriological and physicochemical quality assessments were carried out on samples collected at 13 different sampling stations; upstream, effluent, effluent discharge and 10 downstream stations in three replications. The bacteriological parameters; aerobic mesophilic count, total coliform count and fecal coliform count were done. The values of aerobic mesophilic count ranged from 3.0 105 cfu/ml to 2.64 107 cfu/ml. These counts were significantly different (p<0.05) among the stations sampled. The values of total coliform count ranged from 111 MPN/100ml to 396 MPN/100ml, and the values of fecal coliform count ranged from 96 MPN/100ml to 356 MPN/100ml. The counts of total and fecal coliform were significantly different (p<0.05) among the stations sampled. Microorganisms isolated include, Escherichia coli, Enterobacter aerogenes, Streptococcus faecalis, Staphylococcus aureus, Proteus vulgaris and Bacillus subtilis. The physicochemical parameters analyzed were temperature, total suspended solids (TSS), total dissolved solids (TDS) and Biochemical Oxygen Demand (BOD). The water temperature varies from 22 to 30℃. pH varied between 6.6 and 7.9. The values of TSS fluctuated between 6 and 42 mg/l, and the values of TDS fluctuated between 73 and 201 µs/cm, and BOD ranged between 3.8 and 23.0 mg/l. All the physicochemical parameters were significantly different (p<0.05) among the stations sampled. The results of this study show that all the physicochemical parameters of the brewery effluent were within the EEPA (Ethiopian Environmental protection Agency) and World Bank permissible limits.
Keywords: Bacteriological Quality, Dashen Brewery, Effluent, Shinta River
Cite this paper: Andargachew Belay , Samuel Sahile , The Effects of Dashen Brewery Wastewater Treatment Effluent on the Bacteriological and Physicochemical quality of Shinta River in Gondar, North West Ethiopia, World Environment, Vol. 3 No. 1, 2013, pp. 29-36. doi: 10.5923/j.env.20130301.04.
Article Outline
1. Introduction
- Industrial estates are established to fulfill the demand of the growing population in the country. The introduction of industries on one hand manufactures useful products but at the same time generates waste products in the form of solid, liquid or gas that leads to the creation of hazards, pollution and losses of energy. Most of the solid wastes and wastewaters from industries are discharged into the soil and water bodies and thus ultimately pose a serious threat to human and routine functioning of ecosystem[1]. Water pollution is serious problem globally involving the discharge of dissolved or suspended substances into groundwater, streams, rivers and oceans. A major source of pollution in developing countries is industrial activities and this has gradually increased the problem of waste disposal[2].Untreated wastes from processing factories located cities are discharged into inland water bodies resulting to stench, discoloration and a greasy oily nature of such water bodies. These wastes pose a serious threat to associated environment, including human health risks[3]. Thus there is need to control the pollution of surface and ground water since the public health and well being of the people have a direct link with the availability of adequate quantity of good quality water[2];[4].Brewery plants have been known to cause pollution by discharging effluent into receiving stream, ground water and soil[2]. Water consumption for breweries generally ranges from 4-8 cubic meters per cubic meter of beer produced. Production steps include malt production, wort production and beer production[5] The main characteristics of environmental concern that can be associated with brewery wastewater include Biochemical Oxygen Demand (BOD)/ Chemical Oxygen Demand (COD) concentration, TSS concentration, pH, nutrients (nitrogen and phosphorus) concentration and temperature[6];[7].Breweries can achieve an effluent discharge of 3-5 m3/m3 of sold beer (exclusive of cooling waters). Untreated effluents typically contain suspended solids in the range 10-60 mg/l, biochemical oxygen demand (BOD) in the range 1,000-1,500mg/L, chemical oxygen demand (COD) in the range 1800-3000 mg/l and nitrogen in range 30-100 mg/l. Phosphorus can be present at concentrations of the order of 10-30 mg/l. Effluents from individual process steps are variable. Effluent pH averages about 7 for the combined effluent but can fluctuate from 3 to 12 depending on the use of acid and alkaline cleaning agents as well the temperatures average becomes about 30℃[8].Gondar is one of the few towns in Ethiopia with relative large-scale manufacturing plants including plastic factory, MOHA soft drink factory, Dashen beer factory and others and most of the existing industries have been discharging their wastes into the surrounding environment, in particular to the nearby river, and there is little acquaintance about the effects of effluent discharge into the receiving water body. Shinta River, as many other rivers serve as a sink for disposal of domestic and industrial wastes. It is located near to Dashen beer factory and no study has been conducted on the bacteriological and physicochemical quality of the river. The main objective of this study were to: (i) determine the impact of Dashen beer factory effluent on the bacteriological and physicochemical quality of Shinta river; (ii) analyze and compare the bacterial contamination level of the river by determining bacterial contaminants from different sites in the study area and (iii) analyze the level of total dissolved solids, total suspended solids and biochemical oxygen demand in the study area.
2. Materials and Methods
2.1. Description of the Study Area
- The study area is found in the town of Gondar which is located in the Northern part of Ethiopia mainly in the Amhara Regional State. It is located about 738km from Addis Ababa. Geographically Gondar is bounded by 120 35’ 07’’ North latitude and 370 26’ 08’’ East longitude and it has a narrow range of altitude i.e. 2000-2200m above sea level. Dashen Beer Factory was established in 1992 June 26 E.C. and currently it is the second supplier of beer in the market with production capacity of 0.75 million hectoliters per annum. The factory is located in the western part of Gondar, 12Km far from the main town. River Shinta which contribute to Angereb River part of the tributaries of Lake Tana is located near from the factory and it drains from north to south and it serve as natural sewerage lines for domestic and industrial wastes.
2.2. Sampling Stations
- Wastewater sample for bacteriological analyses were collected from 13 sampling stations, 12 along the course of the river and 1 along the effluent discharging canal as follows:One sampling station (Station 1) was located at the upstream location; at 20m from the discharge point. Upstream location was regarded as the control point. One sampling station (Station 2) was located along the drainage canal, 10m to the point of discharge into the river and one sampling station (Station 3) was located at the junction, where the waste from the brewery enters the river. Ten sampling stations were located at varied distances downstream from the discharge point (Station 3). The stations were designated as Station 4 (10m), Station 5 (20m), Station 6 (30m), Station 7 (40m), Station 8 (50m), Station 9 (60m), Station 10 (70m), Station 11 (80m), Station 12 (90m) and Station13 (100m).
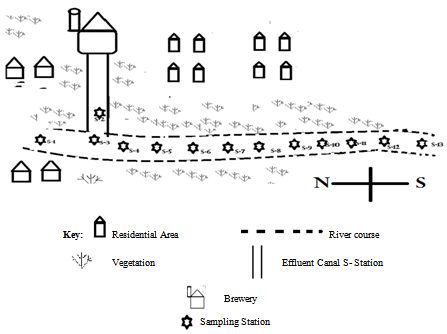 | Figure 1. Selected portion of the River Shinta showing Sampling Stations |
2.3. Sample Collection and Analysis
- Water samples were collected in triplicate except for Biological Oxygen Demand (BOD) which was in duplicate at the 12 sampling stations along the course of the river and 1 at the course of effluent discharging canal from January 2012 to April 2012. Water samples were collected in a plastic bottle which was thoroughly cleaned by distilled water. Samples for bacteriological analyses were collected in a sterilized glass bottles. Samples for BOD were collected separately in a 1.5 liter plastic bottle which was thoroughly cleaned by distilled water. The samples were taken to laboratory immediately for analysis. Bacteriological parameters monitored include total coliform count, fecal coliform count and aerobic mesophilic count according to the methods of[9];[10]. The isolation and identification of bacterial isolates were carried out using standard microbiology and biochemical techniques in accordance with Bergey’s manual of determinative bacteriology volume 2[11]. The physicochemical parameters studied were pH, temperature, Total Dissolved solids (TDS), Total Suspended solids (TSS) and Biological Oxygen Demand (BOD).pH of samples was measured using pH meter (HI-111, Egypt) already standardized by using buffer solutions of known value (4 and 7) before analyses[12]. Temperature was measured at the site of sampling, using portable calibrated mercury thermometer (model 3012, UK)[12]. Total Dissolved Solids (TDS) of the water were measured using conductivity/salinity meter (HI-8733, Germany)[12]. Biological Oxygen Demand (BOD) was measured using BOD HACH Trak instrument (DR/2010 HACH, Loveland, USA) according to the HACH instruction. Whatman No.1 filter paper was used to determine samples TSS[12].
2.4. Statistical Analyses
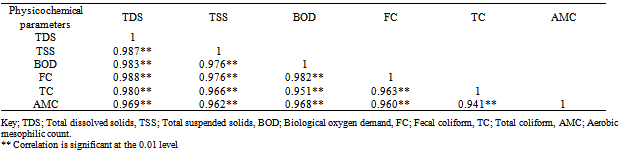
- Data was analyzed using Statistical Package for Social Sciences (SPSS-16). The bacteriological andphysicochemical parameters were analyzed using Analysis of Variance (ANOVA) techniques to find whether significant differences existed in the different sampling stations for the parameters studied. Pearson correlation coefficient ® was calculated to find out the relationship between the physicochemical parameters and the bacteriological parameters. P value less than 0.05 was considered to show significant difference.
3. Results
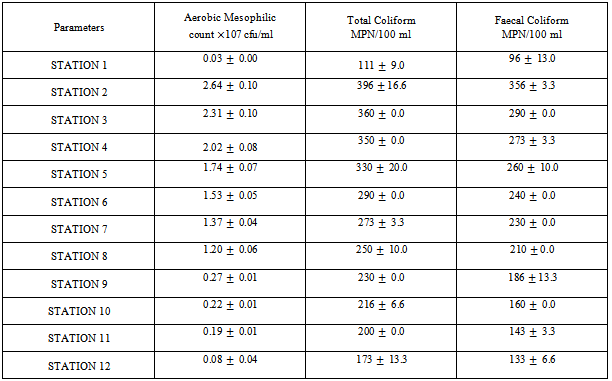
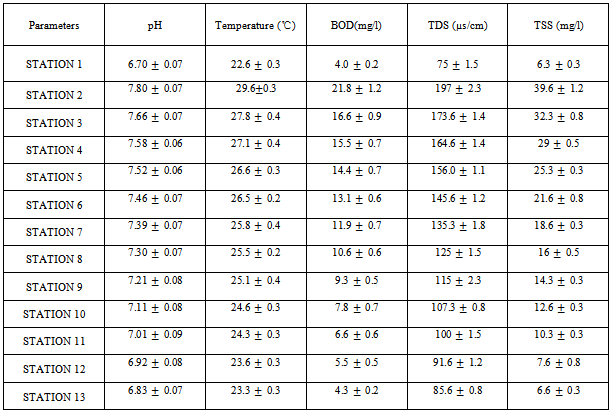
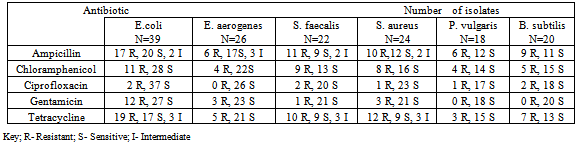
- The results of the study for bacteriological parameters of Shinta River at different Sampling stations are shown in Table 1. The values of aerobic mesophilic count ranges from 2.95 × 10⁵ to 2.64 × 10⁷ cfu/ml. The highest AMC (2.8 107 cfu/ml) was recorded in Station 2 (effluent). The lowest aerobic mesophilic count (2.9 105 cfu/ml) was recorded in Station 1 (upstream). Analysis of variance (ANOVA) showed that Aerobic mesophilic count was significantly different (p<0.05) among the various stations sampled. The values of total coliform count, ranges from 93 MPN/100ml to 430 MPN/100ml. The highest TCC (430MPN/100ml) was recorded in Station 2. The lowest TCC (93 MPN/100ml) was recorded in Station 1. ANOVA result showed that total colifom count (TTC) was significantly different (p<0.05) among the various stations sampled.The values of fecal coliform (FC) counts, ranges from 75 MPN/100ml to 360 MPN/100ml (Table 1). The highest fecal coliform counts (360 MPN/100ml) was recorded in station 2 (effluent) and the lowest FC count (75 MPN/100ml) was recorded in station 1. Statistical analysis using ANOVA indicated that FC count was significantly different (p<0.05) among the stations sampled. Six bacteria were isolated: Escherichia coli, Enterobacter aerogenes, Streptococcus faecalis, Staphylococcus aureus, Proteus vulgaris and Bacillus subtilis.Results of the physicochemical parameters of Shinta River at the 13 sampling stations are shown in table 2. Water temperature was varied from 22℃ at Station 1 to 30℃ at Station 2. There was significant difference (P<0.05) in water temperatures recorded between the different sampling station. The Sampling site pH range was between 6.58 to 7.94. The highest pH (7.94) was recorded at Station 2 (effluent) and the lowest (6.58) pH was recorded at Station 1 (upstream). Statistical analysis using ANOVA indicated that pH was significantly different (p<0.05) among the stations sampled. The values of total dissolved solids (TDS) fluctuated between 73 and 201 µs/cm. The highest TDS value (201 µs/cm) was recorded in Station 2. The lowest value (73 µs/cm) was recorded in Station 1. ANOVA result showed that there were significant difference (p<0.05) among the stations sampled.The values of total suspended solids (TSS) fluctuated between 6 and 42 mg/l. Station 2 (effluent) had relatively higher mean value 39.6 mg/l of TSS as compared to the other stations sampled. The lowest mean value 6.3 mg/l of TSS was recorded for Station 1 (upstream). Statistical analysis using ANOVA indicated that there was significant difference (p<0.05) in the value of TSS among the stations sampled.Biological Oxygen Demand (BOD) fluctuated between 3.8 and 23.0 mg/l. The upstream station (Station 1) had lower values of mean 4.0 mg/l. Station 2 had relatively high values of mean 21.8 mg/l. Analysis of variance (ANOVA) result showed that BOD was significantly different (p<0.05) among the various stations sampled.The result of antimicrobial susceptibility test is shown in Table 3. Most of the bacterial isolates were sensitive for the antibiotics used. Some isolates of E.coli, S.faecalis and S. aureus were resistant for Ampicillin and Tetracycline.
|
|
|
|
4. Discussion
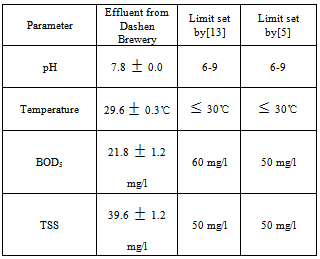
- This study has shown the current conditions of Dashen Brewery effluent on the bacteriological and physicochemical parameters of the nearby Shinta River. The values of aerobic mesophilic count ranged from 2.95 × 10⁵ to 2.64 × 10⁷ cfu/ml. These counts were significantly different (p<0.05) among the stations sampled. Comparatively high aerobic mesophilic count was observed at Station 2 (effluent) (2.64107 cfu/ml). Low aerobic mesophilic count was observed at Station 1 (2.95 × 10⁵ cfu/ml). The relatively high bacteria counts obtained in Station 2 could be attributed to organic matter of the brewery effluent. The introduction of wastewater high in organic matter and essential nutrients brings about changes in the microflora[14] ;[15].[16] also reported that the high counts of bacterial population reflected that the level of water pollution as it gave indication of the amount of organic matter present. At Station 1 (upstream) the bacterial load could be attributed to the incidence of human activities such as defecation, washing, bathing and disposal of wastes from households.[17] reported that high microbial population in aquatic system is a reflection of the input of microorganisms from extraneous sources and availability of growth supporting organic matter. It was also noted the high total coliform count ranged from 93 MPN/100ml to 430 MPN/100ml and fecal coliform count ranged from 75 MPN/100ml to 360 MPN/100ml. Such counts are an indication of severe fecal pollution of the river, hence the possible presence of human pathogens and are in agreement with the findings of[16] in a similar study in Nigeria attributed such counts to the fecal pollution of the water. The total and fecal coliform counts were significantly different (p<0.05) among the stations sampled.To evaluate for the pollution extent, samples were also analyzed for some physicochemical parameters including pH, Temperature, total dissolved solids (TDS), total suspended solids (TSS) and Biological Oxygen Demand (BOD). The mean value of temperature in this study shows significant difference (p<0.05) among the stations sampled. Comparatively the lowest recorded in Station 1 (22℃) and the highest recorded for Station 2 (effluent) and station 3 (discharge) was 30 and 28.5℃, respectively. The relative high temperature recorded for station 2 and 3 could be attributed to discharges of hot liquor and steam condensates from the brewery operation.[16] also reported similar findings. The temperature range of the effluent (29 - 30 0C) was within the EEPA (2003) and World Bank (2007) permissible limits of < 30℃.The pH range for this study was 6.58 to 7.94. Comparatively Station 1 (upstream) had the lowest values of mean 6.7. Relatively Station 2 (effluent) and Station 3 (discharge) had the highest pH values of mean 7.8 and 7.6 respectively and thereafter decreases downstream stations. The mean pH value was significantly different (p<0.05) among the stations sampled. The pH range recorded in this study is very close to recorded in Nigerian River[2]. The pH range of the effluent (7.70 - 7.94) was in line with EEPA and World Bank permissible limit of 6-9.Brewery effluent contains organic materials like spent grains, waste yeast, spent hops and grit[2]. The mean values of Total suspended solids were significantly different (p<0.05) among the stations sampled. Comparatively there was a rise in average levels TSS at Station 2 (39.6 mg/l) and relatively the lowest mean values of TSS (6.3 mg/l) was recorded at Station 1. The rise in average levels TSS at Station 2 (effluent) could be attributed to draining of effluent discharges with high TSS levels into the river.[4];[2] also reported similar findings. The mean TSS value of the effluent i.e. 39.6 mg/l was within 50 mg/l permissible limits set by[13]. The mean values of Total dissolved solids (TDS) were also significantly different (p<0.05) among the stations sampled. Station 1 (upstream) recorded the lowest mean value of 75 µs/cm. Station 2 recorded the highest mean value of 197 µs/cm and there after decreases along downstream sampling stations.Biological oxygen demand (BOD) measures the biodegradable materials in water and helps in the development of bacteria and other organic by products[1]. The levels of BOD were significantly different (p<0.05) among the stations sampled. The average BOD values of Station 1 (4.0 mg/l) were lower than the corresponding values of Station 2 (21.8 mg/l) and downstream stations (16.6 – 4.3 mg/l). The increase in BOD of the downstream can be attributed to an organic loading of the brewery discharge and this is in accordance with the fact that high organic load is found in wastewaters of breweries from rising of bottles and mixing tanks, which consequently affect high bacterial population[4]. The mean BOD level of the effluent (21.8 mg/l) was within the EEPA and World Bank permissible limit of 60 and 50 mg/l respectively.The results from this study implies that most of the bacterial isolates of Escherichia coli, Enterobacter aerogenes, Streptococcus faecalis, Staphylococcus aureus, Proteus vulgaris and Bacillus subtilis were sensitive for the antibiotics, however some isolates of E.coli, S.faecalis and S. aureus were resistant for ampicillin and tetracycline. Resistance to ampicillin and tetracycline might be related to their overuse as opposed to chloramphenicol, ciprofloxacin and gentamicin which are not used for treating enteric infections.[19] also reported similar findings. Developing resistance against ampicillin and tetracycline indicates a relatively reduced efficacy of these antibiotics. Results from this study indicated a positive correlation between BOD, TDS, TSS and AMC, TC and FC. This positive correlation can indicate that as the presence of organic matter dissolved solids and suspended solids in rivers will increase the bacterial load.[20] also reported that the presence of organic matter in the rivers attribute for the development of microorganisms.Untreated brewery effluents typically contain suspended solids in the range 10-60 mg/l, biochemical oxygen demand (BOD) in the range 1,000-1,500mg/L. Effluent pH averages about 7 for the combined effluent but can fluctuate from 3 to 12 depending on the use of acid and alkaline cleaning agents[8]. The use of wastewater treatment system can reduce the pollution strength and organic content of the waste[21]. As the result of the physicochemical parameters analyzed in this study shows that the effluent discharged from Dashen Beer Factory meet the permissible limit set by EEPA and World Bank for safe discharge to surface water. This means that Dashen Beer Factory uses wastewater treatment system in which the wastewater pass different chemical and biological treatment systems before discharged into ‘Shinta’ River.
5. Conclusions and Recommendations
- From the data collected in this study the bacteriological parameters monitored in Station 2 (effluent) and Station 3 (discharge) showed comparatively high mean values of aerobic mesophilic count, total coliforms and fecal coliform counts than Station 1 (upstream) and downstream Stations (4-13). The high mean values in Station 2 and 3 must have been as a result of the nature of brewery effluent discharged into the river which contains organic matter that support for the growth of bacteria. The bacterial load at Station 1 (upstream) could be attributed to the incidence of human activities, such as washing, bathing, dumping of wastes form households and defecation. Comparatively the mean values of bacterial counts were decreasing from Station 4 to downstream Stations (5-13) and this indicates the dilution effect of the flowing river.The results of the physicochemical analysis (pH, Temperature, BOD, TDS, TSS) shows that relatively high mean values were recorded in Station 2 (effluent) and Station 3 (discharge) than Station 1 (upstream) and downstream stations (4 – 13). The relative high mean values of the physicochemical parameters in Station 2 and 3 can be attributed to the nature of brewery operation.The result of the physicochemical parameters of the brewery effluent analyzed were revealed that the parameters pH, Temperature, BOD, TSS meet the permissible limit set by EEPA and World Bank for discharge into surface water. This indicates the use and the effectiveness of Dashen Beer Factory wastewater treatment plant, that the wastewater is first treated before discharged into the river. From the result of this study it is recommended that adequate waste disposal facilities should be provided to inhabitants of the Shinta River. Municipality office should prevent indiscriminate dumping of wastes into the river and also the public should be educated on the health risks of indiscriminate disposal of wastes even though our objective was not included in this study.It is also recommended that further studies also need to be conducted on the microbiological quality of Shinta River. That will be important for the assessment of the use of the river water for domestic purposes and its health impact on the community.It is recommended that the wastewater treatment practiced by Dashen Brewery must be extended to the future and other industries including breweries and other factories must use such wastewater treatment plant. It is also recommended that monitoring programs for the discharge of brewery effluent should be implemented to address all activities that have been identified to have potentially significant environmental impact. Monitoring frequency should be sufficient to provide representative data for the parameter being monitored and monitoring data should be analyzed and reviewed at regular intervals and compared with the operating standards so that any necessary corrective actions can be taken.
ACKNOWLEDGEMENTS
- This study was partially funded by University of Gondar, Faculty of natural and computation science, School of Graduate Studies, and Department of Biology. The authors are also thankful to Dashen Beer Factory for allowing us to use the brewery effluent and in providing materials throughout the research work and to its all laboratory staffs for providing materials, comments and suggestions which have been incorporated a lot to this work.
References
| [1] | Tariq, M., Ali, M. and Shah, Z. (2006). Characteristics of industrial effluents and their possible impacts on quality of underground water. Soil & Environmental Science, Peshawar. 25(1): 64-69. |
| [2] | Olajumoke A, Oluwatosin A, Olumuyiwa O., Abimbola F. (2010). Impact assessment of brewery effluent on water quality in Majawe, Ibadan, South western Nigeria. Researcher. 2(5): 21-28. |
| [3] | Rahman A, Lee HK and Khan MA. (1997). Domestic water contamination in rapidly growing megacities of Asia: Case of Karachi, Pakistan. Environmental monitoring. |
| [4] | Ipeaiyeda, AR and Onianwa, PC (2009). Impact of brewery effluent on water quality of the Olosun River in Ibadan, Nigeria. Chemistry and Ecology. 25(3): 189-204. |
| [5] | World Bank Group (1997). “Industrial Pollution Prevention and Abatement: Breweries. Draft Technical Background Document. Environmental Department. Washington D.C. |
| [6] | The Breweries of Europe (2002). Guidance Note for Establishing Best Available Techniques (BAT) in the brewing industry. Brussels |
| [7] | Driessen, W and Vereijken, T (2003). Recent development in biological treatment of brewery effluent. The institute and guild of brewing convention, Livingstone, Zambia |
| [8] | World Bank Group (2007). “Industrial Pollution Prevention and Abatement: Breweries. Draft Technical Background Document. Environmental Department. Washington D.C. |
| [9] | American Public Health Association (APHA) (1991). Standaard methods for the examination of water and wastewater, 13th ed. Washington, DC. |
| [10] | American Public Health Association (APHA) (1992). Standard methods for the examination of water and wastewater. 18th ed. Washington, DC. |
| [11] | Brenner D.J, Wrieg N.R and Staley J.T (2003). Bergey’s manual of determinative Bacteriology 2nd ed. Volume 2. Springer Co. USA. |
| [12] | Environmental Protection Agency (EPA) (1998). Methods for chemical analysis of industrial effluents. USA. |
| [13] | Ethiopian Environmental Protection Agency (EEPA) (2003). Brewery Effluent Standards. Addis Ababa, Ethiopia. |
| [14] | Rheinheimer. G. (1991). Aquatic Microbiology. 4th ed. John Wiley and Sons NY. p. 363. |
| [15] | Fleisher, JM, Kay, D, Salmon, RL, Jones, F, Wyer, MD, and Godfree, AF (1996). Marine waters contaminated with domestic sewage: nonenteric illness associated with bather exposure in the UK. Amer. J. Pub. Health. 86(9): 1228-1234 |
| [16] | Ekhaise, FO and Anyasi, CC (2005). Influence of breweries effluent discharge on the microbiological and physicochemical quality of Ikpoba River, Nigeria. Afr. J. Bitotechnol. 4 (10): 1062-1065 |
| [17] | Jane Francis, Akoachere TK, Piusmoben A, Beryl S. Mbivnjo, Lucy Mndip, Gerald Nkwelang and Roland Ndip (2008). Bacterial indicators of pollution of Douala Lagoon, Cameroon. J. Afr. Heal. Sci. 8(2): 85-89 |
| [18] | Ipeaiyeda, AR and Onianwa, PC (2009). Impact of brewery effluent on water quality of the Olosun river in Ibadan, Nigeria. Chemistry and Ecology. 25(3): 189-204. |
| [19] | Muhammad R. A., Kalsoom F and Seema M. (2011). Prevalence and antibiotics susceptibility patterns of some bacterial isolates from a street vended fruit product. Afr. J. Microbiol. Res. 5(11): 1277-1284. |
| [20] | Adingra A.A., Kouadio A.N and Kouassi A.M (2012). Bacteriological analysis of surface water collected from the Grand-Lahou Lagoon, Cotedivoire. Afr. J. Microbiol. Res. 6(13): 3097-3105 |
| [21] | The Breweries of Europe (2002). Guidance Note for Establishing Best Available Techniques (BAT) in the brewing industry. Brussels |