-
Paper Information
- Next Paper
- Previous Paper
- Paper Submission
-
Journal Information
- About This Journal
- Editorial Board
- Current Issue
- Archive
- Author Guidelines
- Contact Us
World Environment
p-ISSN: 2163-1573 e-ISSN: 2163-1581
2012; 2(6): 127-134
doi: 10.5923/j.env.20120206.04
Simulation of Some Air Pollutants and Weather Parameters Using WRF/Chem Model in Cairo and Qena Cities/ Egypt
 Abstract
 Reference
 Full-Text PDF
 Full-Text HTML
S. M. Elshazly 1, M. Takahashi 2, M. EL-Nouby Adam 1, Kassem Kh. O 1, A. A. Hassan 1
1Atmospheric physics group, Physics Dep., Faculty of science, S.V.U., Qena, Egypt
2Atmosphere and Ocean Research Institute (AORI), The University of Tokyo, Japan
Correspondence to: Kassem Kh. O , Atmospheric physics group, Physics Dep., Faculty of science, S.V.U., Qena, Egypt.
| Email: |  |
Copyright © 2012 Scientific & Academic Publishing. All Rights Reserved.
Weather Research & Forecasting/ Chemistry model (WRF/Chem) has been used for simulation of air pollutants and weather parameters in Cairo (urban) and Qena (suburb) regions/ Egypt. Surface ozone (O3), Nitrogen oxides (NOx) and Nitrogen dioxide (NO2) as well as Wind speed (WS), Wind direction (WD) and Temperature (T) have been simulated in Cairo. While in Qena, only (O3), (WS), (WD) and (T) have been simulated. Different prediction performance measures have been used to assess the accuracy of estimation of these parameters. The study showed that the model can simulate the diurnal variation of ozone in Cairo better than that in Qena, although the best quantitative estimates of ozone were found in Qena. The model failed in quantitative and qualitative estimation of NOx and NO2 in Cairo as these pollutants affected directly by traffic intensity. The model estimated the weather parameters in acceptable accuracy in both Cairo and Qena especially WS and T. It is clear that WRF/Chem model cannot generally simulate the chemical parameters in high polluted regions such as Cairo. This may be resulted from the coarse resolution used for the input meteorological and emission data (1o latitude X 1o longitude). While, it can be used safely in rural and suburban regions such as Qena. Using fine coarse resolution for meteorology and emission data may improve the results.
Keywords: WRF/Chem Model, Simulation, Air Pollutants, Weather Parameters, Cairo, Qena
Cite this paper: S. M. Elshazly , M. Takahashi , M. EL-Nouby Adam , Kassem Kh. O , A. A. Hassan , "Simulation of Some Air Pollutants and Weather Parameters Using WRF/Chem Model in Cairo and Qena Cities/ Egypt", World Environment, Vol. 2 No. 6, 2012, pp. 127-134. doi: 10.5923/j.env.20120206.04.
Article Outline
1. Introduction
- Recently, concentration of gaseous, liquid and solid pollutants has been increased in the atmosphere as a result of urbanization and increasing of population[1, 2, 3]. This increase may be lead to undesired environmental and climatic effects. Consequently, the need for measuring these pollutants (such as NOx, NO2, O3 and PM10) as well as the meteorological parameters affecting its concentrations such as WS, WD and T has been increased. Unfortunately, measurement networks cannot be established in all the necessary locations, especially in the development countries. So that, the need for estimating these parameters by using some established models became necessary.Weather research and forecasting (WRF/Chem) model has been used in many studies for estimating and studying meteorological and chemical parameters for instance[4, 5, 6]. It has been developed as a collaborative effort among several research institutes including the NCAR Mesoscale and Microscale Meteorology (MMM) Division, the National Oceanic and Atmospheric Administration’s (NOAA) National centers for Environmental Prediction (NCEP) and Forecast System Laboratory (FSL), the Department of Defense’s Air Force Weather Agency (AFWA), and Naval Research Laboratory (NRL), the Center for Analysis and Prediction of Storms (CAPS) at the University of Oklahoma, and the Federal Aviation Administration (FAA), along with the participation of a number of university scientists[7]. A detailed description of the WRF model can be found on the WRF web-site http://www.wrf-model.org/index.php.In this paper we used WRF/Chem model version 2.1 to estimate some chemical and meteorological parameters in two different cities in Egypt, Cairo as a representative of urban region and Qena as a representative of suburb region. Performance of the model for estimation of O3, NOx and NO2 and the weather parameters WS, WD and T in Cairo and O3, WS, WD and T in Qena will be studied using the data recorded during July 2003.
2. Locations Description
- As shown in figure 1, Cairo city (30.10 N, 31.29 E, 34 m) is located north of Egypt, about 120 km south of the Mediterranean Sea coast, between two hills of about 200 m height forming a valley through which the Nile River flows. The valley may affect the prevailing northerly wind by channeling it along the north south axis[8]. The meteorological situation of Cairo is largely determined by the vast surrounding desert; the west and the east deserts. Cairo city is highly populated; its inhabitances are more than 15 millions. About 52% of the industries and about 40% of electrical power stations in Egypt are found in Cairo. Consequently, it is considered as one of the most polluted mega cities in the world[9]. It characterized with narrow streets and high buildings, more than 1.5 million cars with the industrial regions represent the main sources of air pollution. In the other hand, Qena (26.20o N & 32.75o E) is a small city located about 600 Km south of Cairo. Its area is about 1,800 km², situated on the east bank of the Nile. Its climate is characterized by cold winter, and very hot but non-humid summer.
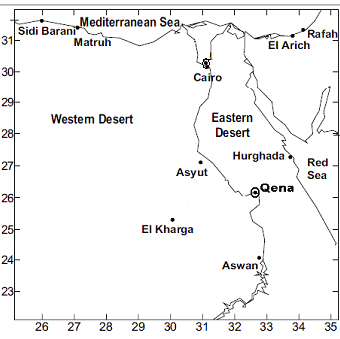 | Figure 1. Map of Egypt |
3. Data and Methodology
- In Cairo, data have been monitored by Egyptian Environmental Affairs Agency, Environmental Information and Monitoring Program EEAA-EIMP. We used O3 values measured in El Abbassyia station. Instruments were located in a shelter on the top of 3 floors building. Air intake was 1 m from the Wall, about 16-m above the street level. The area was considered as regional residential area. It is normally up-wind from Cairo city center, but down-wind from the Shoubra industrial area and Shoubra urban area. There was no immediate local sources, but regionally exposed. So, this station was considered as representative for regional urban area. O3 was measured by UV-Photometric Absorption instrument model TEL M 49 C. Meteorological parameters were measured by Automatic Weather Station (AWS). NO2 and NOx were measured by Chemiluminescence instrument model TEL M 42 C in Maadi, about 15 Km south of Abbassyia station. Instruments were located in the first floor of EEAA building, Intake about 4m from the ground. This area was polluted mainly by traffic and general activities of people. In Qena, O3 and meteorological parameters have been monitored in South valley university (SVU)-meteorological research station. O3 measurements were carried out by the Model 49C UV Photometric Ozone Analyzer. The station is located about 6 KM northeast of Qena city in the eastern desert.
3.1. WRF/Chem Configuration
- We used WRF/Chem model version 2.1[10] for simulation of the chemical and meteorological parameters in Cairo and Qena. Configuration of the model is illustrated in table 1.
 | (1) |
 | (2) |
 | (3) |
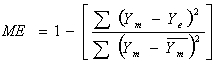
 | Figure 2. Land use in the outer domain (a) and inner domain (b) |
4. Results and Discussion
4.1. In Cairo
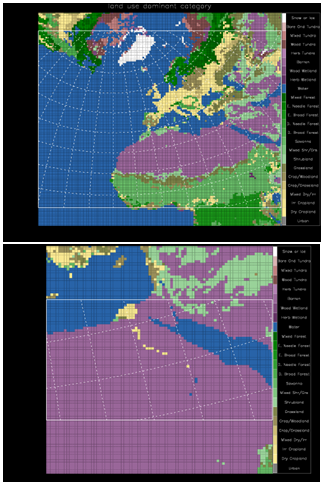
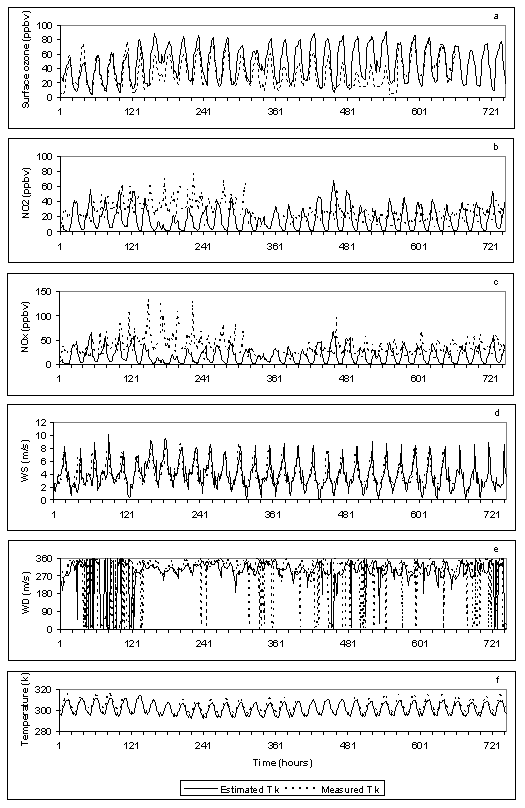
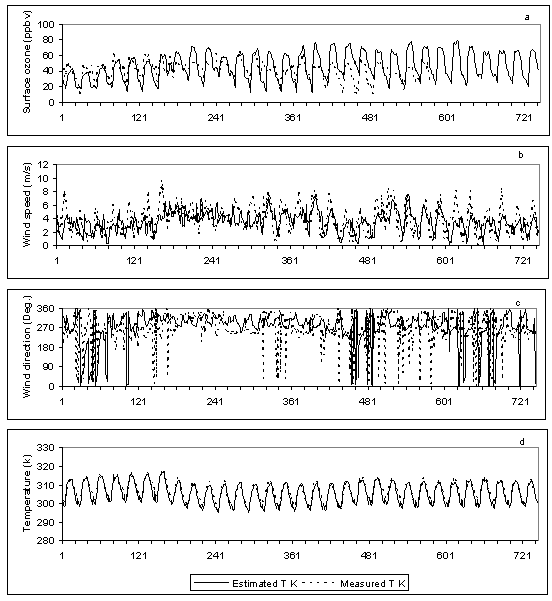
- Hourly values of O3, NO2, NOx, WS, WD and T have been estimated during July - 2003. Diurnal variations of the measured and estimated data are illustrated in Figure 3. It is clear that the model can simulate the diurnal variation of O3 with acceptable accuracy with correlation coefficient 0.67 (Figure 3a). There is over estimation for the maximum diurnal values in some days and over estimation for the minimum diurnal values in other days. The model can not simulate diurnal variation of both NO2 and NOx as shown in figures (3b) and (3c). There is generally low estimation by the model as illustrated in figures (4b and 4c). This may be resulted of two reasons: the first is the fact that these pollutants are affected strongly by traffic intensity. The second is the course resolution of emission and meteorological data that have been used as inputs for the model, 1o latitude X 1o Longitude. The correlation coefficients between measured and estimated data are -0.08 and –0.05, respectively. WS diurnal variation can be simulated so far well with correlation coefficient 0.79 as shown in figure (3d) but with over estimation for the diurnal maximum values and low estimation for minimum diurnal values in most of the days. The same result is found with respect to WD, figure (3e), but with low correlation coefficient 0.27, this low correlation may be resulted of 0o and 360o directions overlap and the over estimation for the values near 360o which will be near 0o (for instance 2o, 3o, 4o…etc), and the low estimation for the values near 0o which will be near 360o (for instance 359o, 358o, 357o, etc). This leads to high scatter in the estimated with respect to the measured data. Temperature is simulated very well with correlation coefficient 0.96 but with low estimation for the maximum and minimum diurnal values as shown in figure (3f).Linear regression models have been constructed between measured and estimated values for each parameter for testing the quantitative relation. Figure 4 illustrates these relations and table 2 summarizes the values of the error parameters (MNBE), (MANGE) (Correl.) as well as ME). It is clear that the model can simulate the hourly values of O3, WS and T better than that of NO2, NOx and WD. This may be attributed to the fact that measured NO2 and NOx are affected strongly by local traffic emissions. While simulated WD is affected by 0o and 360o overlap. For all parameters except T, the general high values of error factors and low values of correlation and model efficiency may be attributed to the coarse resolution of the emission and meteorological data that have been used as inputs for the model.
|
 | Figure 3. Diurnal variation of measured and estimated values of O3 (a), NO2 (b), NOx (c), WS (d), WD (e) and T (f) in Cairo during July 2003 |
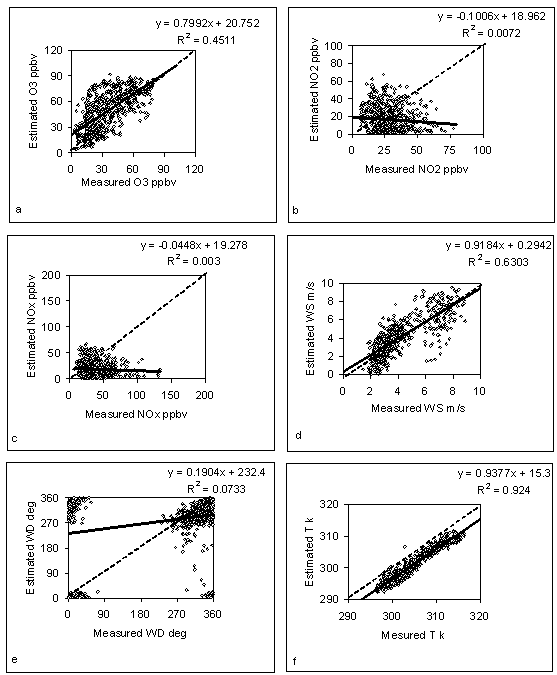 | Figure 4. Scatter plot between measured and estimated hourly values of O3 (a), NO2 (b), NOx (c), WS (d), WD (e) and T (f) in Cairo during July 2003. Solid line is the regression line and dashed line is the 1:1 line |
4.2. In Qena
- WRF/Chem model has been used for simulating hourly data of O3, WS, WD and T during July - 2003. Diurnal variations of the measured and estimated data are illustrated in Figure 5. It is clear that the model can simulate diurnal variation patterns of O3 with less accuracy than that in Cairo. There is over estimation for the maximum O3 diurnal values and low estimation for the minimum diurnal values in most of the days. Correlation coefficient between the two variables decreased to 0.54. WS diurnal variation can be simulated also with less accuracy than that occurred in Cairo where the correlation coefficient decreased to 0.49 as shown in figure (5b) and with low estimation for the maximum diurnal values and high estimation for the minimum diurnal values. The same result is found with respect to WD figure (5c), but with lower correlation coefficient (0.09). Diurnal variation of T is simulated very well with correlation coefficient 0.93, as illustrated in figures (5d). It is clear that the correlation coefficient of T in Qena is also less than that found in Cairo.
 | Figure 5. Diurnal variation of measured and estimated values of O3 (a), WS (b), WD (c), and T (d) in Qena during July 2003 |
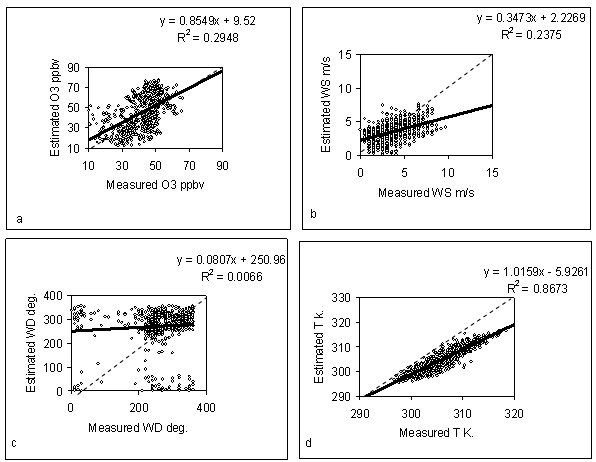 | Figure 6. Scatter plot between measured and estimated hourly values of surface ozone (O3), wind speed (WS), wind direction (WD) and temperature (T) in Qena during July 2003. Solid line is the regression line and dashed line is the 1:1 line |
|
5. Conclusions
- WRF/Chem version 2.1 has been used for simulation of air pollutants and weather parameters in Cairo and Qena/ Egypt. O3, NOx and NO2 as well as WS, WD and T have been simulated in Cairo. While in Qena, only O3, WS, WD and T have been simulated during July 2003. Different prediction performance measures have been used to assess the accuracy of estimation of these parameters.It is found that WRF/Chem model can simulate diurnal variation of O3 values in Cairo better than that in Qena, although, the quantitative estimation in Qena is better than that in Cairo. Simulation of NOx and NO2 in Cairo was not good neither quantitative nor qualitative. This may be resulted from the coarse resolution used for the input meteorological and emission data (1o latitude X 1o Longitude) as well as the fact that these pollutants affected directly by local emissions. The model simulated the weather parameters in acceptable accuracy in both Cairo and Qena especially WS and T. It is clear that WRF/Chem model can not generally simulate the chemical parameters in high polluted regions. While, it can be used safely in rural and suburban regions. Using fine resolution for meteorology and emission data can improve the results. WRF/Chem model can be used in Egypt for estimation weather and chemical parameters required for pollutant sources and sinks study. Where, in most of the Egyptian Cities there are shortage in direct measurements of these parameters.
ACKNOWLEDGEMENTS
- Calculations for O3, NOx, NO2 and meteorological parameters by WRF/Chem model have been performed in Frontier Research Center for Global Change, Atmospheric Composition Research Program in Japan.
References
| [1] | Tie, X., Brasseur, G., Zhao, C., Granier, C., Massie, S., Qin, Y., Wang, P.C., Wang, G.L., Yang, P.C., “Chemical characterization of air pollution in Eastern China and the Eastern United States” Atmospheric Environment 40, 2607–2625, 2006. |
| [2] | Zhang, Q., Zhao, C., Tie, X., Wei, Q., Li, G., Li, C., “Characterizations of aerosols over the Beijing region: a case study of aircraft measurements” Atmospheric Environment 40, 4513–4527, 2006. |
| [3] | Streets, D.G., Waldhoff, S.T., “Present and future emissions of air pollutants in China: SO2, NOx and CO” Atmospheric Environment 34, 363–374, 2000. |
| [4] | Fuhai Geng, Chunsheng Zhao, Xu Tang, Guoliang Lu, Xuexi Tie, “Analysis of ozone and VOCs measured in Shanghai: A case study” Atmospheric Environment 41, 989–1001, 2007. |
| [5] | Xuexi Tie, Sasha Madronich, GuoHui Li, Zhuming Ying, Renyi Zhang, Agustin R. Garcia, Julia Lee-Taylor, Yubao Liu, “Characterizations of chemical oxidants in Mexico City: A regional chemical dynamical model (WRF-Chem) study” Atmospheric Environment 41, 1989–2008. 2007. |
| [6] | Amit, P. Kesarkara, Mohit Dalvia, Akshara Kaginalkara, Ajay Ojhab,”Coupling of the Weather Research and Forecasting Model with AERMOD for pollutant dispersion modeling. A case study for PM10 dispersion over Pune, India” Atmospheric Environment 41, 1976–1988, , 2007. |
| [7] | Skamarock, W C., Klamp, J. P., Dudhia, J., Gill, D. O., Barker, D. M., Wang, W., Powers, J. G., “A description of the advanced research WRF version 2”. NCAR/TN-468+STR, NCAR Technical Note, 2005. |
| [8] | Gusten, H., Heinrich, G., Weppner, J., Abdel-Aal, M.M., Abdel-Hay, F. A., Ramadan, A. B., Tawfik, F. S., Ahmed, D. M., Hassan, G. K. Y., Cvitas, T., Jeftic, J., Klasinc, L., “Ozone formation in the greater Cairo area” The Science of the Total Environment 155, 285-295, 1994.. |
| [9] | Khoder, M. I. “Ambient levels of volatile organic compounds in the atmosphere of Greater Cairo” Atmospheric Environment 41, 554-566. 2007. |
| [10] | Grell, G. A., S. E. Peckham, R. Schmitz, S. A. McKeen, G. Frost, W. C. Skamarock, and B Eder, “Fully coupled ,,online,, chemistry within the WRF model” Atmos. Environ., 39, 6957-6975, 2005. |
| [11] | Madronich, S., “Photodissociation in the atmosphere, 1, actinic flux and the effects of ground reflections and clouds” Journal of Geophysical Research 92, 9740-9752, 1987. |
| [12] | Olivier, J. G. J., A. F. Bouwman, C. W. M. Van der Maas, J. J. M. Berdowski,, C. Veldt, J. P. J Bloos, A. J. H. Visschedijk, P. Y. J. Zandveld, and J. L. Haverlag, “Description of EDGAR version 2.0. A set of global emission inventories of greenhouse gases and ozone depleting substances for all anthropogenic and most natural sources on a per country basis and on 1ox1o grid” RIVM/TNO rep., EIVM Bilthoven, numer nr. 711060002, 1006, 1996 . |
| [13] | Mayer D.G. and Butler, “Statistical validation”. Ecol. Model, 68: 21-32, 1993. |
| [14] | Xuexi T., Sasha M., GuoHui L., Zhuming Y., Renyi Z., Agustin, R. G., Julia, L., Yubao, L. “Characterizations of chemical oxidants in Mexico City: A regional chemical dynamical model (WRF-Chem) study” Atmospheric Environment 41 (2007) 1989–2008 |
| [15] | Georg, A. G., Steven E. P., Rainer S., Stuart A. M., Gregory F., William C. S., Brian E., “Fully coupled ‘‘online’’ chemistry within the WRF model” Atmospheric Environment 39 (2005) 6957–6975 |
| [16] | Amit P. K., Mohit D., Akshara K., Ajay O.” Coupling of the Weather Research and Forecasting Model with AERMOD for pollutant dispersion modeling. A case study for PM10 dispersion over Pune, India” Atmospheric Environment 41 (2007) 1976–1988 |