-
Paper Information
- Next Paper
- Previous Paper
- Paper Submission
-
Journal Information
- About This Journal
- Editorial Board
- Current Issue
- Archive
- Author Guidelines
- Contact Us
World Environment
p-ISSN: 2163-1573 e-ISSN: 2163-1581
2012; 2(6): 120-126
doi: 10.5923/j.env.20120206.03
Relationship between Red Tide Occurrences in Four Japanese Bays and Dam Construction
 Abstract
 Reference
 Full-Text PDF
 Full-Text HTML
Kunio Ueda
Department of Biological Resources Management, School of Environmental Science, The University of Shiga Prefecture, Japan
Correspondence to: Kunio Ueda , Department of Biological Resources Management, School of Environmental Science, The University of Shiga Prefecture, Japan.
| Email: |  |
Copyright © 2012 Scientific & Academic Publishing. All Rights Reserved.
Since about half a century ago, red tide has been occurring in many coastal places of Japan, such as Tokyo Bay, Ise Bay, Osaka Bay, and Ariake Sea. Red tide is algal accumulation that could be a result of eutrophication in bays and lakes. At the same time, dams have been constructed in Japan on rivers that flow into the bays where red tide has been occurring. The correlation between red tide occurrence and dam construction in Japan was researched using the data of many government organizations. The results indicate that the construction of dams influences the occurrences of red tide. When a dam is built on a river, there is a tendency for red tide to result in an estuary of that river a few years later. The number of red tide occurrences is related to the surface area of the dam: as the surface area of a constructed dam increases, the number of red tide occurrences in a bay increases. Thus, the construction of dams seems to cause eutrophication in bays and lakes. Because it seemed that small particles flowed from dams contain nutrients that stimulate the growth of algae.
Keywords: Red Tide, Dam, Construction, Coastal Area, Surface Area, Estuary
Cite this paper: Kunio Ueda , "Relationship between Red Tide Occurrences in Four Japanese Bays and Dam Construction", World Environment, Vol. 2 No. 6, 2012, pp. 120-126. doi: 10.5923/j.env.20120206.03.
Article Outline
1. Introduction
- Red tides have been occurring in bodies of water worldwide for many decades. Red tides are caused by eutrophication and other factors such as ocean currents. Untreated sewage effluent and agricultural run-off increase levels of nutrients in bodies of water and could cause great increases in phytoplankton, creating red tides. Red tides are sometimes associated with the production of toxins and depletion of dissolved oxygen. In these cases, red tides are connected with wildlife mortalities of coastal species of fish and marine animals.In Japan, red tides have been occurring in areas of the sea, especially in bays such as Ise Bay, Tokyo Bay, Osaka Bay, Ariake Sea, Sendai Bay, and Toyama Bay.Sewage treatment must be improved to remove nutrients from sewers. Starting about 30 years ago, the Japanese government has made efforts to develop sewage treatment in almost all areas, especially in cities that exist around the bays discussed in this paper. Sewage treatment is greater than80% in these cities. Agricultural workers have been advised to use fertilizers minimally in cultivating crops. However, red tide occurrences have not stopped yet in Japan. On the other hand, red tide may be caused not only by eutrophication for which people are responsible but also by other factors related to ocean currents reported by Trainer et al. and Adams et al.[1,2].In these cases, other factors should be discussed for solving the problem of red tide occurrence.One of these factors may be dam construction on inflowing rivers. The relationship between dam construction and the occurrence of red tide has not yet been studied. I researched the effect of dam construction on red tide occurrences in Japan and the results are reported here.
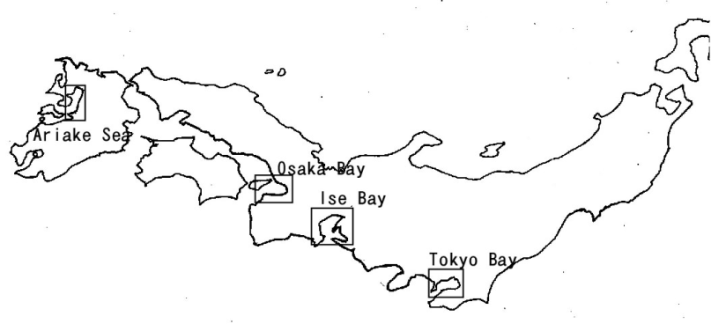 | Figure 1. The four Japanese bays studied in this paper |
2. Materials and Methods
- Ariake Sea, Tokyo Bay, Ise Bay, and Osaka Bay were researched in this report. I obtained the information about dams in Japan from a website offered by The Japan Dam Foundation[3]. The number of red tide occurrences in Ariake Sea was obtained from a website created and maintained by the Japan Fisheries Resource Conservation Association[4], and the locations of red tides were obtained from a website created and maintained by Seikai National Fisheries Research Institute, Fisheries Research Agency[5]. The number of red tide occurrences in Tokyo Bay was obtained from a website offered and maintained by the Kanto Regional Development Bureau, Ministry of Land, Infrastructure, Transport, and Tourism[6]. The locations of red tide occurrences in Tokyo Bay were obtained from the website of the Environmental Bureau of Tokyo Metropolitan Government[7] and the website of the Environmental Institute of Yokohama City[8]. Information about red tide occurrences in Ise Bay was obtained from the Ise Environmental Database (a website created and maintained by the Port and Airport Department, Chubu Regional Bureau, Ministry of Land, Infrastructure and Transport and Tourism [9]). The locations of red tide occurrences in Ise Bay were obtained from the website of the Aichi Prefectural Fisheries Experimental Station[10]. The information about red tide occurrences in Osaka Bay was obtained from a website created and maintained by the Air and Water Environment Management Division, Ministry of the Environment[11].
3. Results and Discussion
3.1. Ariake Sea
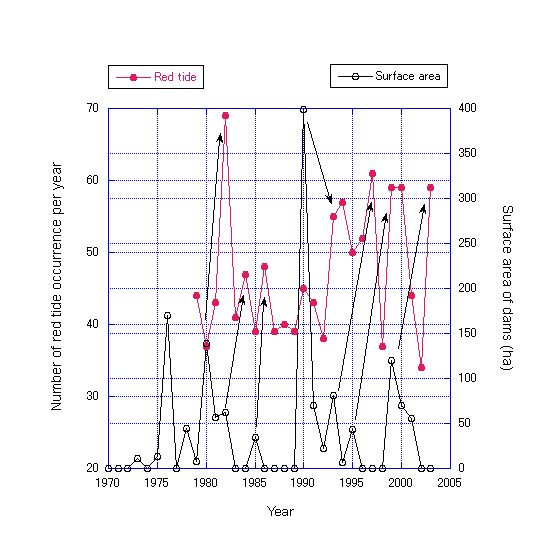
 | Figure 2. The relationship between the number of red tide occurrences per year in the Ariake Sea and the surface area of dams built on the river flowing into the Ariake Sea. Arrows show the correlations between dam construction and the number of red tide occurrences |
3.2. Tokyo Bay
- Figure 4 shows that in Tokyo Bay, there is the correlation between dam completion and red tide occurrence. Each arrow in Figure 4 indicates that the dam brought about the red tides. Rivers that flow into Tokyo Bay are shown in Figure 5. Figure 4 shows that 2 or 3 years after the dams were built, the number of red tide occurrences increased in almost all cases.On the Kohitu River, the Kameyama Dam was completed in 1980 and was considered to bring about red tides 2 years later. On the Tone River, the Tambara Dam in 1981 and the Kiryugawa Dam in 1982 were completed and they were thought to increase the number of red tide occurrences 2-3 years later. The Tone River flows into Tokyo Bay through the Edogawa River. On the Arakawa River, the Arima Dam was constructed and completed in 1985 and is thought to have brought about red tide occurrences observed in 1986. From 1980 to 1985, as shown in Figure 4, the number of red tide occurrences increased when the surface area of a dam increased. In 1990, two big dams were built on the river flowing into Tokyo Bay. One of them is the Naramata Dam with a 200-ha surface area. It was built on the Tone River. The other one is the Takataki Dam with a 199-ha surface area. It was built on the Yohro River, but the number of red tide occurrences didn’t increase as much as number estimated according to the surface areas of the two dams. This may be because the Naramata Dam was built on upstream of the Sudagai Dam and the Hujiwara Dam, which were already completed on the Tone River. It is thought that a dam constructed upstream or downstream from where another dam was already built brings about a smaller number of red tide occurrences than estimated from its surface area.
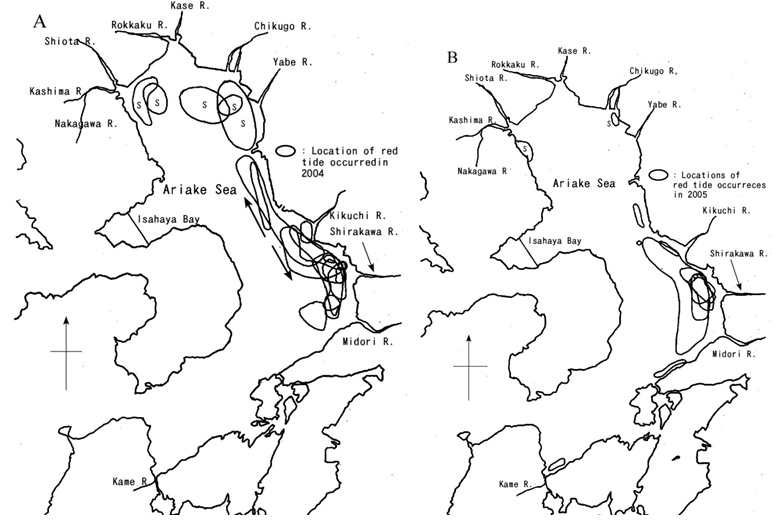 | Figure 3. Locations of red tides observed in the Ariake Sea. The letter s indicates a red tide that was estimated to be brought about by the dam completed on the Shiota River in 2001. The letters A and B indicate the locations of red tide occurrences in 2004 (A) and 2005 (B) |
 | Figure 4. The relationship between the number of red tide occurrences per year in Tokyo Bay and the surface area of dams built on the river flowing into Tokyo Bay. Arrows show the correlations between dam construction and the number of red tide occurrences |
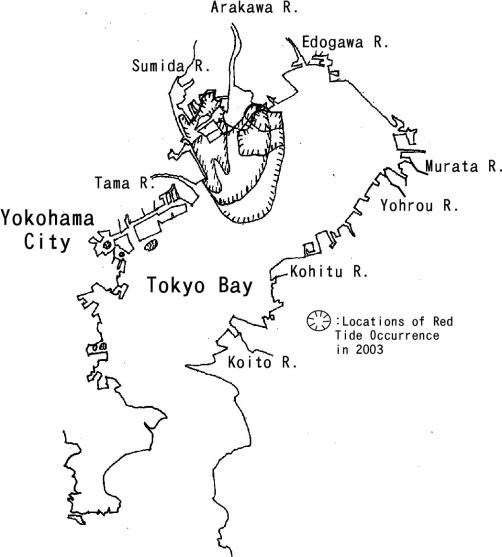 | Figure 5. Locations of red tides observed in Tokyo Bay in 2003. The Tokyo Metropolitan Government and Yokohama City researched red tide occurrences and reported the locations of red tide occurrences |
3.3. Ise Bay
- The correlation between dam surface area and the number of red tide occurrences in Ise Bay is shown in Figure 6. In 1976, two dams were built. The Iwaya Dam with a 426-ha surface area was built on the Kiso River. The Nakazato Dam with a 130-ha surface area was built on the Innben River. These two dams were considered to bring about the red tides observed in 1979 in Ise Bay. In 1980, three dams were completed. The biggest one of these three dams is Kuroda Dam with an 80-ha surface area. It was built on the Yahagi River, which flows into Mikawa Bay (Ise Bay usually includes Mikawa Bay). Three or four years later, these three completed dams increased the number of red tide occurrences in Ise Bay. In 1985, the Huwa Dam was built. It has a 93-ha surface area and brought about a red tide 5 years later. The Akikawa Dam with a 158-ha surface area was constructed and completed in 1990 on the Kiso River. It was considered to increase the number of red tide occurrences in 1995. The Misokawa Dam was built in 1996 on the Kiso River and its surface area is 135 ha. It is considered to have caused red tides in 1998. In 2001, the Ohshima Dam with a 50-ha surface area was built and increased the number of red tide occurrences 2 years later. The Ohshima Dam is located on the Toyo River, which flows into Mikawa Bay. In 2007, the Tokuyama Dam was built on the Ibi River. The Tokuyama Dam is a huge dam with a surface area of 1300 ha. However, the Tokuyama Dam is located 3 km upstream from the Yokoyama Dam that was built in 1964. As a result of this situation, which was also seen in Tokyo Bay, the Tokuyama Dam did not increase the number of red tide occurrences in Ise Bay as much as the number estimated from its surface area.
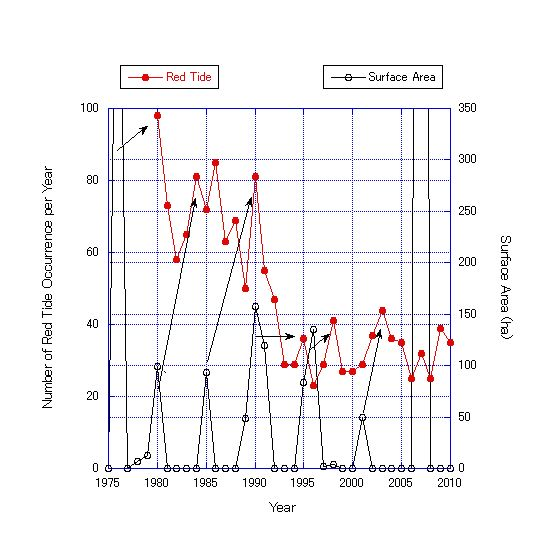 | Figure 6. The relationship between the number of red tide occurrences per year in Ise Bay and the surface area of dams built on the river flowing into Ise Bay. Arrows show the correlations between dam construction and the number of red tide occurrences |
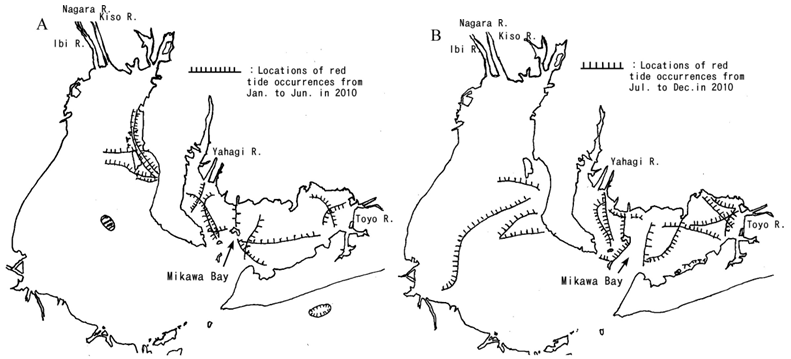 | Figure 7. Locations of red tide occurrences observed in Ise Bay in 2010. The letters A and B indicate the locations of red tide occurrences from January to June (A) and from July to December (B) in 2010 |
3.4. Osaka Bay
 | Figure 8. The relationship between the number of red tide occurrences in Osaka Bay and the surface area of dams built on the river flowing into Osaka Bay. Arrows show the correlations between dam construction and the number of red tide occurrences |
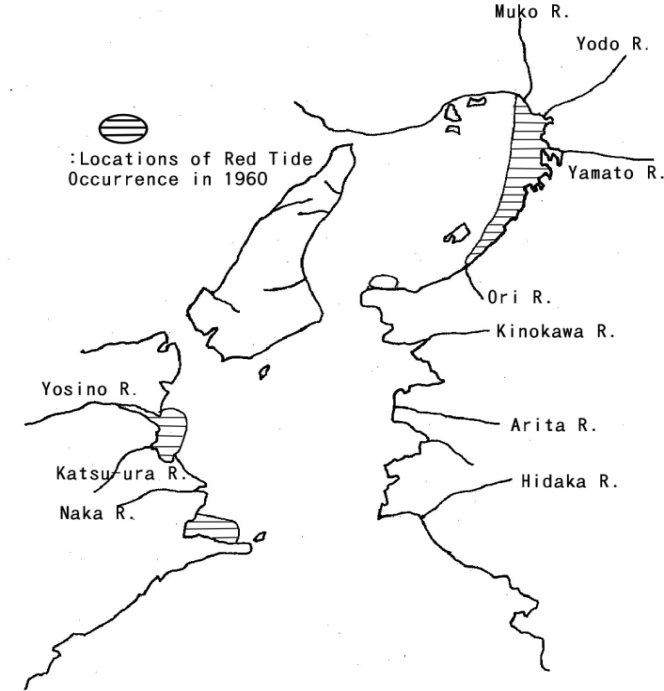 | Figure 9. Locations of red tide occurrences observed in Osaka Bay and Kii Channel in 1960 |
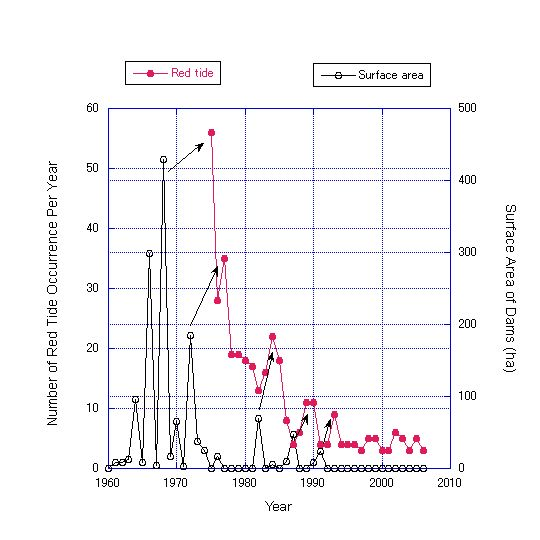 | Figure 10. Arrows show the correlations between dam construction and the number of red tide occurrences from 1960 to 2006 |
4. Conclusions
- Dam construction appears to influence the occurrences of red tide in the bays downstream from the dams.Red tide tended to occur in four bays of Japan a few years after dams were built on rivers that flow into the four bays. The numbers of red tide occurrences in these bays were almost proportional to the surface areas of the constructed dams. The red tide occurrences were located at the estuaries of the rivers on which the dams were built.From these facts, it appears that algae grow and accumulate in the muddy soil that precipitates in the bay and become red tide.
ACKNOWLEDGEMENTS
- I would like to thank the facilities that created websites offering various data of red tides: The Japan DamFoundation; Japan Fisheries Resource Conservation Association, Seikai National Fisheries Research Institute; Kanto Regional Development Bureau, Ministry of Land, Infrastructure, Transport, and Tourism; Environmental Bureau of Tokyo Metropolitan Government (TMG); Environmental Institute of Yokohama City; Port and Airport Department, Chubu Regional Bureau, Ministry of Land, Infrastructure, and Transport; Aichi Prefectural Fisheries Experimental Station; and Air and Water Environment Management Division, Ministry of the Environment.