-
Paper Information
- Previous Paper
- Paper Submission
-
Journal Information
- About This Journal
- Editorial Board
- Current Issue
- Archive
- Author Guidelines
- Contact Us
World Environment
p-ISSN: 2163-1573 e-ISSN: 2163-1581
2012; 2(5): 104-109
doi: 10.5923/j.env.20120205.02
Measurements of Dissolved Oxygen Concentration in Stationary Water
 Abstract
 Reference
 Full-Text PDF
 Full-Text HTML
Alexandru Pătulea , Nicolae Băran , Ionela Mihaela Căluşaru
Faculy of Mechanical and Mechatronics Engineering, Politehnica University of Bucharest, Bucharest, 060042, Romania
Correspondence to: Nicolae Băran , Faculy of Mechanical and Mechatronics Engineering, Politehnica University of Bucharest, Bucharest, 060042, Romania.
| Email: |  |
Copyright © 2012 Scientific & Academic Publishing. All Rights Reserved.
The paper justifies the need for measuring the concentration of oxygen dissolved in stationary waters; in order to perform accurate measurements, the oxygen probe must be displaced inside water with a speed greater than 0,3 m/s. The performed experimental researches proved the accuracy of probe displacement and the reliability of the driving mechanism. The constructive solution of the driving mechanism, its functioning and the results of the performed measurements are exposed.
Keywords: Water Oxygenation, Stepping Motor, Microcontroller
Article Outline
1. Introduction
- An important indicator of the water quality is the quantity of dissolved oxygen[1,2]; among water molecules there are oxygen molecules that constitute the dissolved oxygen.Oxygen dissolved in water is known as dissolved oxygen DO (fig.1) and is conventionally measured in mgO2/l.
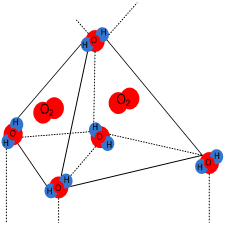 | Figure 1. View of molecular structure: dissolved oxygen |
2. Description of the DO Measuring Instrument
- The oxygen dissolved in water is measured in parts per million (ppm=mg/l) or in saturation percentages (%).The electric method, also known as electro-chemical method, is based on two ways of measuring DO concentration:a) Galvanic procedure, where a small electric voltage appears between the electrodes; applying an external voltage is not needed;b) Polarographic procedure, where a DC voltage is applied between the two electrodes (cathode and anode).A HI 9146 oxygen meter manufactured by HANNA INSTRUMENTS (Canada) was purchased for experimental researches. The oxygen meter uses the polarographic procedure as measurement technique. The oxygen meter is composed of a microprocessor (1) (fig.2) that, through the connection cable (2), establishes the connection with the measurement probe (3) introduced in the water whose DO content must be established [7]. Figures 2, 3 and 4 present the component elements of the oxygen meter as well as their assembling manner in order to perform DO measurements. A small cylinder (4) (fig.4) that contains an electrolyte solution is screwed on the threaded portion (5) (fig.3). The cylinder base consists of an oxygen permeable Teflon membrane (5). The functioning principle of the measuring instrument is the following: a d.c. battery is mounted inside the microprocessor(1), thus an electric field where ions migrate is established between the probe electrodes. A special purpose electrolyte solution, contained in a small cylinder tube (4) isolated to water, lies between the electrodes.The intensity of the electric current between the anode and the cathode varies in function of the concentration of dissolved O2, therefore the value of the O2 concentration displayed by the oxygen meter also changes.
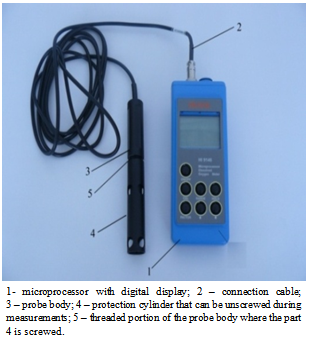 | Figure 2. General view of the oxygen meter |
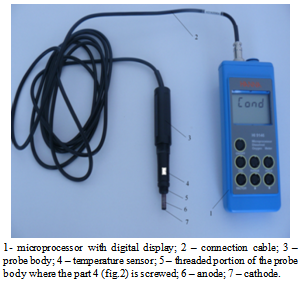 | Figure 3. General view of the oxygen meter without protection cap |
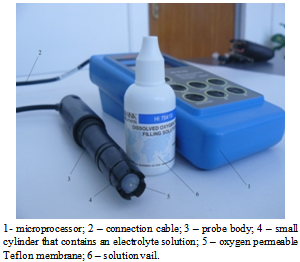 | Figure 4. Assembly view of the oxygen meter prepared for measurements |
3. The Experimental Stand for the Measurement of the Oxygen Dissolved in Water
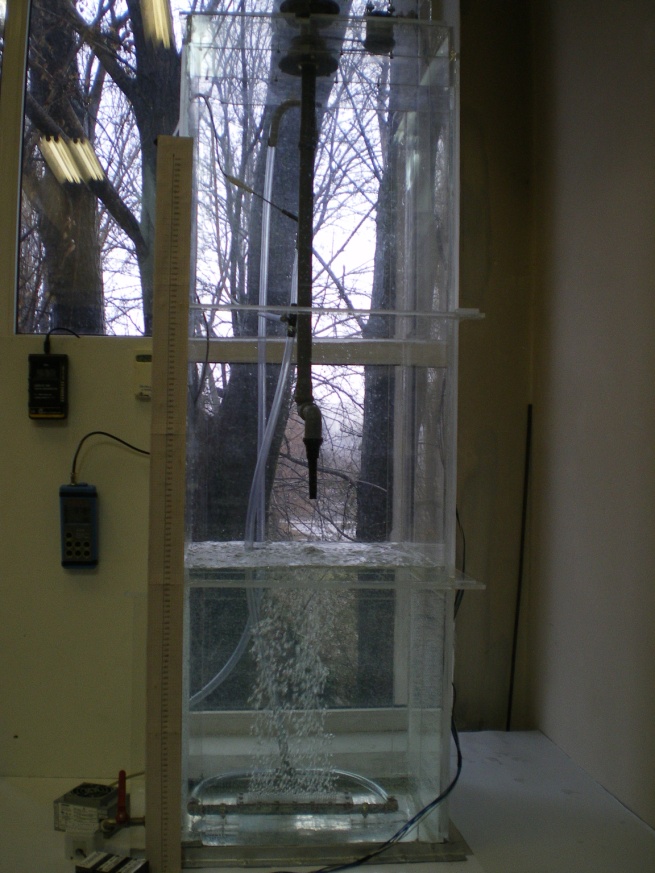
- The experimental stand (fig.5) consists of the following elements:• an air electro-compressor (1);The compressor is endowed with a pressure reducer (2) that assure the required work pressure and a manometer (3).• a joint for exhausting of air in the atmosphere (4);• a compressor feeder (5);• a rotameter (6) for air flow rate measuring;• a digital thermometer for measuring the air temperature found on the measuring instruments panel (8);• a digital manometer for measuring the air pressure at the entrance of the fine air bubble generator (FBG) found on the measuring instruments panel (8);• a pipe (9) for the transport of the compressed air towards the FBG;• a tank (10) filled with water from the plant supply, where the FBG is immersed;• a driving mechanism (11) of the measurement probe (12).
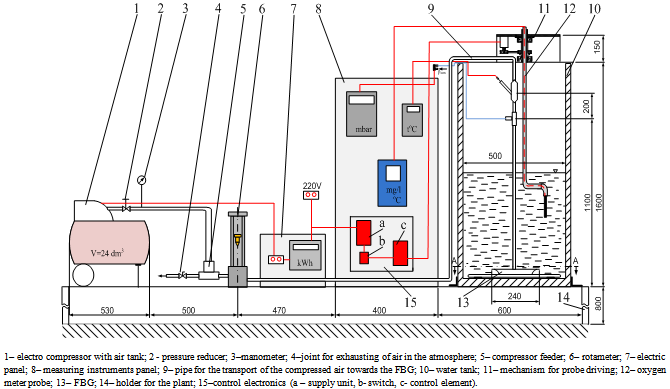 | Figure 5. Sketch of the experimental setup for researches regarding water oxygenation |
4. Device for the Displacement of the Polarografic Probe
- The instruction manual of the oxygen meter specifies that, in order to obtain accurate measurements, water must flow with a flow speed of minimum 0,3 [m/s].In our case, the water is stationary in the water tank, thus we will displace the probe on a circular path in the horizontal plane.A circle with a diameter of D = 0,25 m is chosen.Accordingly, the length of the path is equal to:
 | (1) |
 | (2) |
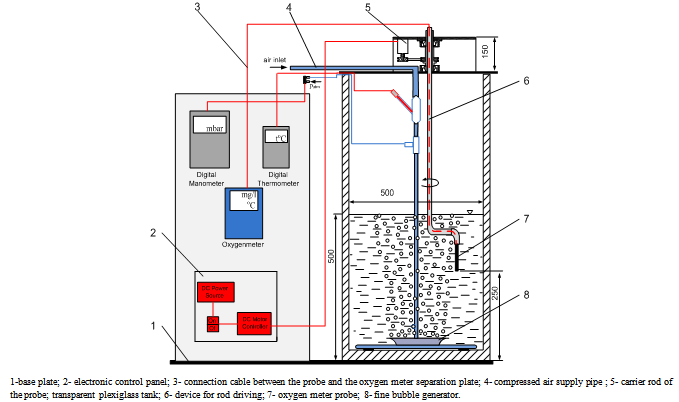 | Figure 6. Sketch of the water tank and of the measurement probe |
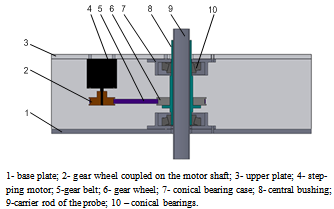 | Figure 7. Device for driving the oxygen meter probe in a circular movement |
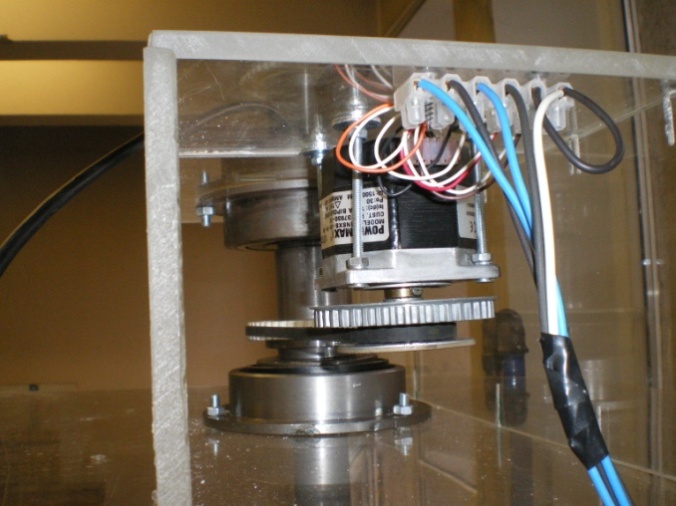 | Figure 8. Driving mechanism |
5. Computation of the Performance and of the Efficiency of the Oxygenation Process
- It is known from specialty literature [9, 10] that the performance of the water oxygenation is defined as ratio between the oxygen dissolved in water and the oxygen introduced in water:
 | (3) |
 | (4) |
 | (5) |
 | (6) |
 | (7) |
 | (8) |
 | (9) |
 | (10) |
 | (11) |
6. Measurement Results
- In the experimental stand, a column of water of height H = 500 mm H2O lies above the perforated plate.The pressure generated by the surface tension[9,11] is equal to:
 | (12) |
 | (13) |
 | (14) |
 | Figure 9. FBG in function |
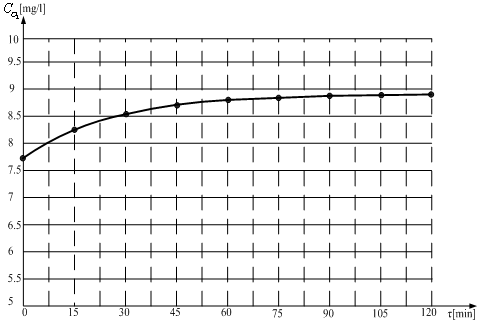 | Figure 10. Graphical repreentation of the function CO2= f(τ) |
7. Conclusions
- 1. The driving mechanism of the oxygen meter probe performs a 360° rotation of the probe in 2 seconds; the movement is transmitted from the stepping motor, through a gear belt, to the probe carrier rod. An accurate trajectory covered in a well determined time is thus guaranteed.2. The electronic system of the driving mechanism can receive instructions through the knobs from the control panel; the knobs allow the accomplishment of a pre-established rotation sequence in both directions, with a speed of 0,5 rps.3. The performed experimental researches proved the accuracy of probe displacement and the reliability of the driving mechanism.4. The driving mechanism allows the horizontal and vertical displacement of the probe, observing pre-established conditions.5. The researches will continue in order to extend this experimental model to an industrial scale.
ACKNOWLEDGEMENTS
- The work has been funded by the Sectoral Operational Programme Human Resources Development 2007-2013 of the Romanian Ministry of Labour, Family and Social Protection through the Financial Agreement POSDRU/88/1.5/S/60203 and POSDRU/107/1.5/S/76903.
References
| [1] | D. Robescu, a.o., Reliability of processes and plants for water treatment and purification (in Romanian), Technical Publishing House, Bucharest, 2002. |
| [2] | G. Oprina, I. Pincovschi, Gh. Băran G, Hydro-gas-dynamics of aeration systems equipped with fine bubble generators (in Romanian), Politehnica Press, Bucharest, 2009. |
| [3] | C. Wilson, Notes regarding water quality, Department of Soil and Water Science, Florida University, 2010. |
| [4] | N. Băran, Gh. Băran, G. Mateescu, Research Regarding a New Type of Fine Bubble Generator, Romanian Review of Chemistry, vol. 61, no. 2, pp.196-199, ISSN 0034-7752, 2010. |
| [5] | D. Robescu, D.L. Robescu, Methods, plants and equipment for the physical purification of wastewater (in Romanian), Bren Publishing House, Bucharest, 1999. |
| [6] | G. Mateescu, Hydro-gas-dynamics of fine bubble generators (in Romanian), PhD Thesis, Politehnica University of Bucharest, Faculty of Mechanical Engineering and Mechatronics, 2011. |
| [7] | Instruction manual of the oxygen meter manufactured by HANNA Instruments, Canada, 2010. |
| [8] | S. Kostrakievici, C. Rizescu, C. Udrea, - Elements of Mechatronics (in Romanian), Printech, Bucharest, 2000. |
| [9] | N. Băran, Gh. Băran, “The hydrodynamics of bubbles generated by porous diffusers” (in Romanian), romanian Review of Chemistry, vol. 54, no. 5/2003, pp. 436-440. |
| [10] | N. Băran, Al. S. Pătulea, I. M. Căluşaru, Computation of performance and efficienty of the water oxygenation process in non-stationary conditions, Efficacité énergétique – sources d’énergies renouvelables – protection de l’environnement COFRET’12, Sozopol, Bulgarie, 11 –13 June, pag 503-507, 2012. |
| [11] | Al. Dobrovicescu, N. Băran, et al., Elements of Technical Thermodynamics, POLITEHNICA PRESS Publishing House, Bucharest, Romania, 2009. |
| [12] | N. Băran, Gh. Băran, G. Mateescu, D. Besnea, “Experimental Research Regarding a New Type of Fine Bubble Generator”, Romanian Review Precision Mechanics Optics and Mechatronics, no.36/2009, pp.25-31, ISSN 1584-5982 |
| [13] | N. Băran, Gh. Băran, G. Mateescu, Al. Pătulea, Water oxigenation, Jassy Polytechnic University Sci. Bull, tome XI (LX) fasc. 3b., Ed. POLITEHNIUM, 77-84, 2010. |
| [14] | G. Oprina, Contributions of the hydro-gas-dynamics of porous diffusers (in Romanian), PhD Thesis, Politehnica University of Bucharest, 2007. |
| [15] | N. Băran, A. Zaid, Al. Pătulea, Researches regarding the increase of the dissolved oxygen concentration in function of the duration of the water oxygenation process, TERMOTEHNICA, No .2/2010, pp. 15-18, ISSN 1222-4057. |
| [16] | A. Călin, Theoretical and experimental contribution on the study of the reaeration preocess in biological reactors, PhD Thesis, Politehnica” University of Bucharest, 2010. |