-
Paper Information
- Previous Paper
- Paper Submission
-
Journal Information
- About This Journal
- Editorial Board
- Current Issue
- Archive
- Author Guidelines
- Contact Us
World Environment
p-ISSN: 2163-1573 e-ISSN: 2163-1581
2012; 2(3): 51-55
doi: 10.5923/j.env.20120203.06
Influence of Climate and Height on the Levels of Sulphur Dioxide (SO2) in Sokoto High Traffic Density and Near Atmosphere Region
 Abstract
 Reference
 Full-Text PDF
 Full-Text HTML
C. I. Akabueze 1, A. I. Tsafe 1, A. U Itodo 2, A. Uba 1, A. D. Tambuwal 3
1Department of pure and applied chemistry, UsmanuDanfodiyo University, Sokoto, Nigeria
2Department of Applied Chemistry, Kebbi State University of Science and Technology, Aliero, Nigeria
3Sokoto Energy Research Centre, Sokoto State
Correspondence to: A. U Itodo , Department of Applied Chemistry, Kebbi State University of Science and Technology, Aliero, Nigeria.
| Email: |  |
Copyright © 2012 Scientific & Academic Publishing. All Rights Reserved.
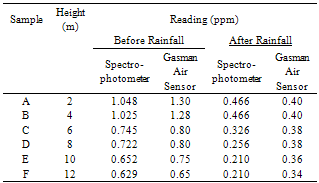
In this investigation, the concentrations of sulphur dioxide gas in the near atmosphere at six (6) different heights (2m, 4m, 6m, 8m, 10m and 12m) were determined using Spectrophotometry and Direct Reading Air Sensor. A simple improvised techniquewhich is economical and easy to operate was designed and adopted. It yielded analytical reasonable results. The results showed that SO2 gas is more concentrated (1.048ppm, 0.466ppm, 1.30ppm and 0.40) at ground levels (2 – 4m high) than at higher levels (10 – 12m high). Higher height concentrations were estimated as 0.629ppm, 0.210ppm, 0.65ppm and 0.34ppm. It therefore implied that the concentration of SO2 gas decreases with height. Also critical in this study is the comparison of the two analytical techniques based on sensitivity and easy handling.
Keywords: Air pollution, Sulphur dioxide, Atmosphere, Spectrophotometry, SO2 Gas Sensor
Article Outline
1.Introduction
- Pollution is an undesirable change in the physical, chemical or biological characteristics of the natural environment, brought about by man’s activities[1]. In other words, pollution is caused when a change in physical, chemical, or biological conditions in the environment harmfully affect the quality of life, including effects on other animals and plants. Pollution is the introduction of substances into the environment that alters its physical, chemical and biological properties, in such a way that is harmful to living organisms. Pollution can either be natural or through the human activities andthe harmful substances that cause pollution are known as pollutants. There are Point Source Pollution, which results from definite sources that are identifiable. Non – Point Pollution Source are diffuse sources that are not identifiable, such as run – offs. Pollution can either be air, water or land pollution[2].Air Pollution is the introduction of chemicals, particulate matter, or biological materials that cause harm or discomfort to humans or other living organisms, or damages the natural environment, into the atmosphere. Main causes of air pollution include gaseous discharge from industries, indiscriminate and open burning of wastes, bush burning, gas flaring, indoor cooking, emissions from generators, mining activities, etc.[2].Automotive pollution has been established to account for elevated levels of SO2 gas and other air toxics in ambient air along motorways and at urban sites. Tail pipe emissions arising from gasoline combustion by motor vehicles result in increased air quality deterioration with respect to SO2 and other air toxics. In Nigeria, problem of pollution from vehicular emission is worsened by limited street space, traffic jam delays, poorly maintained vehicle and roads, and lack of emission control and management programmes. Among the most serious consequences of the traffic induced urban pollution problems is the acute and chronic exposure of large fraction of the society to different doses of air pollution of different composition on daily basis. A large number of the populace intercept and inhale SO2 gas and other air toxics as a result of direct exposure to pollution as part of their daily business and official activities, which keep them within roadside environments. These include roadside shop operators, school children, street hawkers and police and traffic wardens. Many homes and offices are also built so close to major high traffic areas (especially in Lagos) that the occupants live their daily lives in traffic induced pollution conditions[3].Sulphur dioxide (SO2) is considered one of the indicators of air quality[4]. Sulphur dioxide is a colourlessgas, that forms an acidic solution in water, which is readily oxidized to Sulphuric Acid, thus
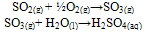 Hence, Sulphur dioxide is a major component of acid rain and air pollution.Pollutants are classified on the basis of environmental component, their chemical nature, origin or source, physical states, action they produce on the host, etc. [2].Sulphur dioxide is released into the atmosphere in large quantities by natural process. An important source is from the action of anaerobic bacteria in marshes, forming hydrogen sulphide (H2S), which is oxidized to sulphur dioxide (SO2) and sulphur trioxide (SO3) in the atmosphere. Sulphur and sulphur gases are also emitted in large quantities as a result of volcanic activity[5].The name, acid rain, is derived from the dilute solution of sulphur oxides (SO2 and SO3) and nitrogen dioxide (NO2) in cloud and rain droplets, causing the resulting sulphuric and nitric acids to fall as acid rain[2].The oxidation of SO2 to its corresponding acid, H2SO4, takes place both in the gas phase and in aqueous reactions, the principal oxidants being the hydroxyl (HO-) radicals and hydrogen peroxide (H2O2) [2].In the gas phase, during daytime, OH- is the principal oxidant, thus
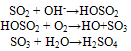 In the aqueous phase, H2O2 is the chief oxidizing agent.Acid rain is harmful to living things, such as trees, life in rivers and lakes, etc. It also causes damage to buildings and works of sculpture outside, and makes metals corrode faster.Sulphur dioxide is released into the atmosphere in large quantities by natural process. An important source is from the action of anaerobic bacteria in marshes, forming hydrogen sulphide (H2S), which is oxidized to sulphur dioxide (SO2) and sulphur trioxide (SO3) in the atmosphere. Sulphur and sulphur gases are also emitted in large quantities as a result of volcanic activity[5].Air Quality is a measure of the condition of air relative to the requirements of one or more biotic species and or to any human need or purpose[6]. Air Quality Indices (AQI) are numbers used by government agencies to characterize the quality of the air at a given location. The Clean Air Act established two types of National Air Quality Standards – Primary Standards, which set limits to protect public health (including the health of ‘sensitive’ populations such as asthmatics, children, and the elderly), and the Secondary Standards, which set limits to protect public welfare (including protection against decreased visibility, damage to animals, crops, vegetation, and buildings).USEPA has set National Ambient Air Quality Standards for sulphur dioxide as 0.03 ppm (Annual Average), 0.14 ppm (24 hours) and 75 ppb (1 hour) for Primary Standards, and 0.5 ppm (3 – hour) for Secondary Standards[7]. Nigeria has also set her annual Emission Quality Standards for sulphur dioxide (Conventional Pollutants) as 50 μg/m3. Her National Emission Limits for sulphur dioxide are 0.1 mg/m3 for long – term limit (24 – hour) and 0.5 mg/m3 for short – term limit (30 minutes)[8].Monitored sulphur dioxide in the Guinea Savannah Zone of Nigeria (Ilorin precisely), using conductometric method. Two seasons (wet and dry seasons) were considered in their investigation, and it was discovered that there was high concentration of sulphur dioxide during the dry season. They concluded that their technique could be used to obtain useful information to support air quality management decisions, as well as in – depth understanding of source strengths and potential impacts[9]. In another analysis[10] worked on the atmospheric level of SO2 in Sokoto metropolis. In this research, photometric method was used prior to sucking of the SO2 in H2O2 solution. The value reported exceeded that of WHO guideline. This present work which is also in Sokoto state is aimed at determining the concentration of sulphur dioxide at different heights (altitudes) and to study the influence of heights and climate (rainfall) on the estimated concentrations.
2. Materials and Methods
2.1. Materials
- In addition to routine laboratory apparatus, the following equipment find usage in this analysis: Edwards, EB 3A Pump, England; Impinges Dreschel bottles (Pyrex, England) and fabricated 2m, 4m, 6m, 8m, 10m, 12m wooden stands with a base. Crowcon, 196124 direct Reading Portable Gasman Air Sensor, Germany and DR 2010Direct Reading Spectrophotometer were the major analytical instruments.Reagents include 10% H2O2 The Sulfaver 4 powder pillow reagent was manufactured and supplied by the HACH Company that supplied the direct reading spectrophotometer (DR 2010). It contains Barium ions, which when added to the sample under study, react with sulphate ions in the sample to form Barium sulphate. Blank contain the sample solution without sulfaver 4 powder pillow reagent. Distil or de-ionize water could also be used as blank while 1% HNO3 was used for rinsing glass wares.
2.2. Sampling
- Atmospheric air samples were procured at different heights and in two different climatic considerations (Days before rainfall and days after rainfall) with the aim of studying the effect of altitude as well as climatic changes on the levels or concentrations of sulphur dioxide gas in the atmosphere. Samples were collected at Fodiyo Road, by the Fly – Over, Sokoto. The sampling location was chosen, considering the traffic density of the area as a possible contributor.The sampling train has three essential elements: a sample line through which the air is sampled; next is a device by which the sample under study was collected for analysis; followed by a pump that maintained the airflow through the system. These three components were connected together with rubber tubing. Air passed through the funnel suspended on a wooden stand (2m, 4m, 6m, 8m, 10m, and 12m high). It then passed through the dreschel bottle containing 100 cm3 of 10% hydrogen peroxide solution for 60 minutes at a flow rate of 7.5 L/min, where sulphur dioxide gas was trapped by reacting with the hydrogen peroxide to form sulphuric acid[9].After each sampling, the bubbler was removed and the absorbent solution (sample) transferred into sample bottle for analysis. Any loss of the trapping solution due to evaporation was restored by adding 10% H2O2 solution after the termination of the sampling. The sample containers were wrapped with black masking tape and all joints in the sampling train were air – tight by using silicon grease.
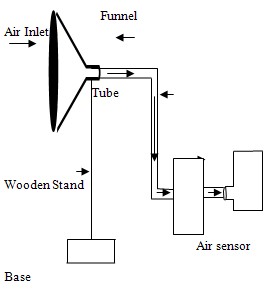 | Figure 1. Sketch of the Sampling Line Assembly |
3.Results and Discussion
- Concentrations of SO2 gas in the sample were calculated using formula by[11] as Volume of Air sampled at any given height = flow rate (L/min) × Sampling Time(min.). Results were presented as mean values of triplicate analysis.Table 1 compares SO2 measured before and after rainfall using both Spectrophotometric and Direct Reading Gasman Air Sensor methods. The results showed a general decrease in SO2 concentration as a result of rainfall, and also a uniform decrease in SO2 concentration with increase in height. The results obtained using Gasman Air Sensor is higher than those obtained using Spectrophotometer. This could be as a result of a possibility of SO2 escaping from dissolving in H2O2.
3.1. Effect of Altitude on So2Oncentration
- It should be noteworthy that air pollution study is always a function of sampling height. In the measurement of air particulate, the total suspended particulate matter was collected by means of a Whatman filter paper using direct deposition method. The filter paper was placed inside a plastic jug and subsequently the jug was placed at the topbase of an iron stand of height 2.47m[12]The results obtained in this study from the analysis of the air samples at different heights indicated the presence of sulphur dioxide, though at low concentrations, and they vary from one height to another. The concentration is higher at the near ground level than at the highest height analyzed. In other words, the concentration decreases with increase in height. The concentrations at 6 and 8 meters height of the third and fourth sampling are almost the same. The concentrations of SO2 gas at the highest heights (12m) in all the samplings are the smallest.
3.2. Effect of Climate on So2Oncentrations
- Apart from climate, data related to SO2abundance in the atmosphere was reported[14]. It was pointed out therein that there are periods that exhibit significant changes in the SO2 content in the atmosphere. One of such is the abundance of H2S and ozone, O3. The SO2 in the atmosphere is highly dependent on the strength of these sources as well as the chemical reactions during the transport. The most probable reactions that produce SO2 starting fromH2S are the following[14]:
 Tables 1 also compared the concentrations in ppm of SO2 at different heights and at different climatic conditions (rainfall), using Direct Reading Spectrophotometer and Direct Reading Gasman Air Sensor respectively. The data showed that climate (rainfall) also affects the concentration of SO2 in the atmosphere. The results of the analysis showed a reduction in the concentration of SO2 in the atmosphere as a result of rainfall, which implied a possible dissolution of SO2 in rain water. Though concentrations of SO2 in the atmosphere were high before the rainfall, it indicates reduction after the rainfall; the mean values were higher than the permissible limits of WHO daily guideline value of 0.125 mg/m3[10].Results obtained in this analysis compares with that of analysis of SO2 within Sokoto metropolis using photometric method[10], where the mean concentration was reported as 0.270 mg/m3. Mean concentrations in this analysis falls within the range of 0.307 – 0.355 mg/m3 for samples obtained before rainfall and 0.123 – 0.144 mg/m3 for those after rainfall respectively. The data obtained before rainfall proved higher compared to those obtained by[10]. In other words, values obtained using Spectrophotometer (0.123 mg/m3, after rainfall) fall within the limits of those obtained by[10] via photometric analysis.Generally, urban air pollution monitoring and modeling is a complex forecasting problem and one or two assumptions are not sufficient to cope with it. It was stated that height could make fuel combustion inefficient with resultant emissions;it could also enhance the trapping of pollutants and thus adding to the pollution problem[13]Solver Type=Non linear;Coefficient of multiple determination=0.9594Adjusted Coefficient of multiple determination(R2)=0.9323Standard Error of Estimate=0.9732Confidence Limit=95%Residual Sum of Square Error=5.392Figure 2 is a plot of SO2 concentration being a function of climate change and height. The values were obtained using a Spectrophotometer and presented as a non-linear (regression) plots using 9.0.59 version of Datafit software. From the plot, variation of SO2 concentration with height is not uniform. Discrepancies were reported between 2 – 4m heights, with a characteristic decrease in concentration. This also reoccurred for the 10 – 12m heights. The plot also revealed that SO2 concentration analysed before rainfall gave a uniform decrease of SO2 with increase in height. Values are presented in Tables 1. A correlation of R2 = 0.9323 was reported. This implied that there is a high positive correlation between the SO2 concentration values obtained before and after rainfall. This was estimated at 95% confidence limit, and a standard error of estimate of 0.9732 .The chosen heights difference are to some extent within a uniform gas distribution obtained for the 2 and 4m, and 10 and 12m height readings
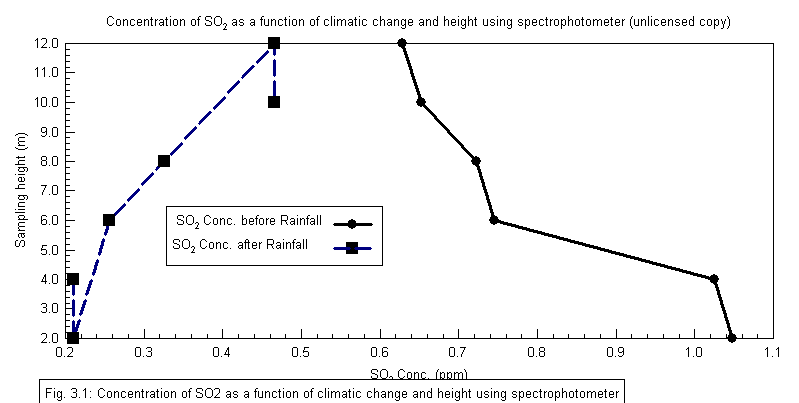 | Figure2. Concentration of SO2 as a function of climatic changeand height using spectrophotometer |
 | Figure 3. Concentration of SO2 as a function of climatic changeand height using Gasman air sensor apparatus |
4.Conclusions
- Both Heights as well as climatic changes influences the concentration of sulphur dioxide in the near atmosphere. The results obtained indicated that the impact of climate in a greater extent affects the level of sulphur dioxide than altitude (height). The higher the concentration of sulphur dioxide at a particular level, the higher is the pollution risk. The effect of sulphur dioxide is severe and destructive. Apart from the acid rain, it causes airway inflammation, especially to asthma sufferers. This research shows that in non-acid rain regions, wet season as with high rainfall as well as storey building dwellers are susceptible to low SO2 risk.
|