-
Paper Information
- Previous Paper
- Paper Submission
-
Journal Information
- About This Journal
- Editorial Board
- Current Issue
- Archive
- Author Guidelines
- Contact Us
World Environment
p-ISSN: 2163-1573 e-ISSN: 2163-1581
2012; 2(2): 16-23
doi: 10.5923/j.env.20120202.04
Studying of the Solar–Climate Interaction in Canada
 Abstract
 Reference
 Full-Text PDF
 Full-Text HTML
M.A. El-Borie 1, M. Abd El-Zaher 2, S. El-Monier 2
1Physics Department, Faculty of Science, Alexandria University, Alexandria, Egypt
2Department of Basic and Applied Science, Faculty of Engineering, Arab Academy for Science and Technology, Alexandria, Egypt
Correspondence to: M.A. El-Borie , Physics Department, Faculty of Science, Alexandria University, Alexandria, Egypt.
| Email: |  |
Copyright © 2012 Scientific & Academic Publishing. All Rights Reserved.
It is well known that the solar radiation output changes periodically and also that it affects the Earth and near-space environment in various ways. The Earth climate system has shown irregular changes during the second half of the 20th century, especially for the last four decades. The scientific and public discussions about the influence of the solar radiation on global warming are still ongoing. It is obvious that the man-made gases (e.g., the concentration of carbon dioxide in the atmosphere was never as high during the last thousand years as it is today) is an important factor affecting the Earth’s surface temperature, but it may be not the only one. The present work presents a correlative study to investigate the possible effect of some geomagnetic and solar parameters on climate variability of global temperature represented by the temperature of Canada. Two components (monthly averages) that may be closely associated with the climate have been studied, which are the geomagnetic activity, aa and the sunspot number, Rz throughout a long period of 114 years from (1890-2004).
Keywords: Solar Activity; Regional Climate Change; Solar Cyclic Variations; Solar Indices; Climatic Change
1. Introduction
- It is well known that the solar radiation output changes periodically and it affects the Earth and near-space environment in various ways, such as the formation of the aurora, adverse effects on satellites and communications, etc. By considering the historical evolution of the climate changes on the Earth, the cold period lasting from the second half of the 17th century to the beginning of the 18th century (1645- 1715) is called “Little Ice Age”, and the corresponding period of practically no activity on the solar surface, is called “Maunder Minimum”. In contrary to this, the positive “Medieval Warm Period” (12th-14th centuries) appears to be less distinct evidence, mostly from the Western Europe, did not suggest that this was a global phenomenon (Klick, 2005). During this period, temperatures had been about 0.2℃ warmer than compared with the 15th-19th centuries, but rather below those of mid- 20th century (Intergovernmental Panel on Climate Change IPCC, 2001). This might have arisen from higher solar activity, as claimed by (Eddy, 1976). The Earth climate system has irregular changes during the second half of the 20th century to the beginning of the 21th century, especially for the last four decades. Interest to this subject is therefore continually increasing. Since the climate system depends on many parameters, such as evaporation, wind, pressure, rainfall, temperature, etc., climate change phenomenon is a very complex problem and the contribution of each parameter to this change is not yet clear. Global surface temperature is a popular metric for summarizing the state of global climate change (Kilick, 2005).Temporal changes of surface air temperature have mostly been studied on the global (NH, SH) temperature series which are available since 1861 only. Besides that some of the individual long European series have been studied, e.g. Benner (1999) who studied Central England series (1659– 1997). Intensive statistical effort has also been done to study spatial temperature behaviour during the last decades (e.g. Mann and Park, 1996; Jones et al., 1999). Natural or anthropogenic influences have been considered and evaluated. Many theories discussed the impact of manmade causes and their effects on climate changes. Human beings, like other living organisms, have always influenced their environment. It is only since the beginning of the industrial revolution, mid-18th century that the impact of human activities has begun to extend to a much larger scale, continental or even global. Climate model projections, summarized in the latest IPCC, reported and indicated that the global surface temperature is likely to rise a further 1.1 to 6.4℃ during the 21st century (IPCC, 2007; 2009). The uncertainty in this estimate arises from the use of models with differing sensitivity to greenhouse gas concentrations and the use of differing estimates of future greenhouse gas emissions. Most studies focus on the period leading up to the year 2100. However, statistical analyses of the climate records since 1860 reveal significant interannual and interdecadal variability (Allen and Smith, 1994; Wigley, 1997; Crowley, 2000; Benestad, 2002; Mann et al., 2005; Kilick, et al., 2008), suggesting that the cause of the global warming is more complex than the influence of increasing greenhouse gases alone, but there are other parameters that have a high effect to change the global surface temperature. These parameters are the solar activity and geomagnetic indices, where the Earth climate system would have been controlled by the Sun before the pre industrial era (Hoyt and Schatten, 1997; North and Stevens, 1998; Pulkkinen et al., 2001; El-Borie and Al-Thoyaib, 2006; Souza Echer et al., 2009; El-Borie et al, 2010; 2011a), but later anthropogenic effect began to dominate.There are several natural impact factors which could cause temperature changes: solar motion, solar activity, geomagnetic activity, volcanic activity, etc. Solar changes are today easily traced through many activity indicators such as sunspot number, coronal mass ejection (CME), solar flare and prominences, etc. These indicators show cyclic behaviours from days to thousands of years. One of the longest data set available is the sunspot number and sunspot area series, which exhibit long-term cyclic variations of 11 years (Schwabe), 22 years (Hale) and 80–90 years (Gleissberg), and also some other periods such as those of 35 years (Kilcik, 2005;), or even longer (210-year Suess cycle). Short-term changes have also been recorded in solar flare observations and irradiance measurements.Climate commitment studies the prediction that even the levels of greenhouse gases and solar activity were to remain constant; the global climate is committed to 0.5℃ of warming over the next hundred years due to the lag of warming caused by the oceans. Hence, solar activity and green house gases play an important role in changing the climate. Georgieva et al, (2007) studied the relation between long-term changes in the solar activity and prevailing type of atmospheric circulation for the last four centuries, they found that when the southern solar hemisphere is more active, increasing solar activity increases meridional circulation for atmosphere. Adding to these Lassen and Friis-Christensen (1995) has demonstrated a strong correlation between solar cycle lengths and Northern Hemisphere temperatures over the period 1860-1990. Following studies (Lassen and Friis- Christensen, 2000; Laut and Gundermann, 2000 a;b; Thejll and Lassen, 2000) have taken an update data of the same results. Near-Earth variations in the solar wind, measured by the geomagnetic activity index aa, have displayed good correlations with global temperature (Landscheidt, 2000), where geomagnetic activity seems to be the possible link through which the solar activity control the Earth’s climate (Landscheidt, 2000; Shah and Mufti, 2005). Lockwood et al, (1999) found that the total magnetic flux, leaving the Sun and driven by the solar wind, has risen by a factor of 2.3 since 1901, leading to an increase in the global temperature by 0.5℃.In addition, the solar energetic eruptions, which are dragged out or/and organized by the observed variations in the solar wind, are closely correlated with the near-Earth environment (El-Borie, 2003a; b). Comparison of the geomagnetic aa with the solar wind, post-1965, showed a fairly good match, indicating that variations in aa were mostly due to similar variations in the solar wind, which must have their origin in solar physical processes (Feynman, 1982; Kane, 1997; El-Borie, 2003a;b; El-Borie et al, 2011b).In the present work, we try to investigate the possible role of some solar indices on climatic variable represented by changes of regional surface temperature in Canada. Indices of solar disturbance measure the near-Earth variations in the solar wind, have been studied. Here, we present a correlative study of the possible contributions for the two components that may be closely associated with the climate of Canada, throughout the period of114 years from (1890-2004). The two parameters are geomagnetic activity aa and the sunspots number Rz.
2. Data and Analysis
- To studying the regional solar–climate relationship on local scale we used only monthly surface air temperature data of Canada. The temperature data used in this study cover the period of time ranging from beginning of 1890 to the end of December 2004, which is available and down- loaded from the wep page (http://www7.ncdc.noaa.gov/ CDO/dataproduct). Also Canada’s National Climate and Weather DataArchive, (http://www.climate.weather-office. gc.ca /Welcome_e.html). In addition, data for sunspot number Rz was provided by the National Geophysics and Solar Terrestrial Data Center (http://www.ngdc.noaa.gov/stp/GEOMAG/aastar.shtml) and data for geomagnetic activity aa are available from ( http:// www.wdcb.rssi.ru / STP /data / geomagni.ind / aa/ aa/ AA _ MONTH).All data were available as monthly means, or daily values, from which monthly values were calculated. To remove monthly and seasonal changes (short-term variation, such as a 27-day variation, are obliterated and only intermediate term variation are studied) all griddled monthly data were smoothed with 12-month running average and anomalies, which are the residuals after removal of the mean level of these smoothed data. The temperature data (stations) used in this study cover 45-82° latitudinal and 54-127° longitudinal regions. The distribution of these meteorological stations is shown in Fig (1). We selected stations for which continuous records data were available, and temperature data cover the Canada city. The data stations separated into four sub- regions (from G1 to G4), corresponding to its elevations values. It well known that the surface air temperature shows serious variations with the elevation and the air pressure. Elevation of our data station very between 10 m and1396 m, corresponding to minimum pressure value was set to 856 mber and maximum value at 1010 mber. To investigate the degree of the relationship between the surface air temperature of Canada, and the solar activity (sunspot number, Rz and geomagnetic index, aa), linear regression has been used. For each sub-region (four groups, G1-G4), where the Linear regression has been used to determine the degree of similarity between two signals with zero lag. If the signals are identical, then the correlation coefficient is 1; if they are totally different, the correlation coefficient is 0, and if they except that the phase is shifted by exactly 180, then the correlation coefficient is -1. The monthly data of the temperature and solar indices have been divided according to the solar cycles. Cross-correlation coefficients between the entire temperature data and both sunspot number, Rz and geomagnetic index, aa, respectively have been calculated for different solar cycles and reported in table, (1and 2), for four sub-regions.The running cross-correlation was applied to find the similarity between two signals with lag time (T). Also to investigate the periodicity of the solar indices and surface temperature for Canada, we have performed a series of power spectral density (PSD). The results of PSDs were smoothed using the Hanning window function. This is necessary since most of the disturbed features will completely disappear, while the significant peaks are clearly defined. Nevertheless, the particular window chosen dose not shifts the positions of the spectral peaks. All harmonic signals have been obtained by using of 90, 95, 99 % confidence level.
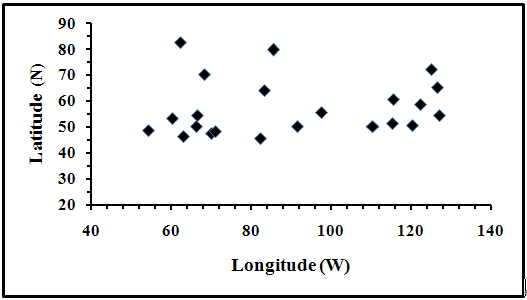 | Figure 1. Distribution of stations in Canada that used in our calculations |
3. Results and Discussion
- The Sun is the source of the energy that causes the motion of the compact atmosphere and thereby controls weather and climate. Any change in the energy from the Sun received at the Earth's surface will therefore affect climate. During stable conditions there has to be a balance between the energy received from the sun and the energy that the Earth radiates back into space. This energy is mainly radiated in the form of long wave radiation corresponding to the mean temperature of the Earth. The surface temperature is a critical measure of climate variations. The debate concerning global warming has been the concern of researches for a long time. In the present study, the correlation and the spectral analysis are utilized to find (a) significant correlation between the surface air temperature of Canada and sunspot number and geomagnetic index, and (b) the power spectrum, which provides continuous temporal evolution of the entire range of periods.Regression analyses have carried out between the considered parameters. Tables, 1 and 2 shows the results of our correlation analyses for entire data and the solar indices for four sub-regions. Table, 1 report the correlation coefficients between the monthly mean surface air temperature of Canada and sunspot number, Rz, sets from 1878 to 2004. The obtained values of significant correlations, as flows in group 1, about 0.44 for a cycle 21 (1976-1986), and in group 2 about 0.72, 0.48, and 0.68 for a cycle 13 (1890-1902), 17 (1933-1944) and 23 (1996-2008) respectively, in group 3 about 0.65 for a cycle 14 (1902-1913). Finally in group 4 about 0.68 and 0.46 for a cycle 13 (1890-1902) and 14 (1902-1913) respectively. Also table 2 represents the results of correlation between the surface air temperature and the geomagnetic index. A significant correlation about 0.65 and 0.57 is obtained in group 2 for a cycle 13 (1890-1902) and cycle 17 (1933-1944), respectively. From these results, statistically significant correlations between the solar indices (sunspot number and geomagnetic index) and surface air temperature over Canada are observed in group 2 (or are not identified). Many studies like (El-Borie and Al-Thoyaib, 2006) displayed that the temperature should lag the geomagnetic aa and the correlation reaches a maximum when temperature lags by 6 years.In order to find a causative parameter in solar variability that may be responsible for the observed climatic change, the running cross-correlation was applied. Results of the running cross-correlation analysis of solar air temperature of Canada (based on monthly average) are shown in Figure (2), for a different sub-region (G1-G4). The 120-month lag time (τ) has been considered. For these correlations, τ is the lag, usually recommended to be of 25% of the data length. The τ = 0 means the both data sets are in time (zero lag). For individual correlation, we can see that.(1) For a group 1, which corresponding to elevation from zero to 100 m, and covering a period of 1913-2004 in figure 2 a, the largest peak are at 12.5-14.2 yr lag with magnitudes of ~ 0.28 ± 0.09 for the correlation aa-ST, and ~ 0.32 ± 0.09 for Rz-ST. A negative correlation coefficient was observed between aa & ST of -0.23 ± 0.09 at zero lag time the relationships between ST and both aa and Rz are moderate for this group.(2) In figure 2b, for a group 2, which corresponding to elevation from 100 to 200 m, and covering a period of 1890-2004. The largest peak at 0-4 yr lag with magnitude of ~ 0.19 ±0.09 for the correlation aa-ST. In contrast, the largest negative amplitude is ~ -0.18 ± 0.09 at lag time of 14.5-18.8 yr.(3) The plot 2c illustrates the correlations of aa-ST and Rz-ST in group 3, which corresponding to elevation from 200 to 500 m, and covering a period of 1895-2004. The largest peaks are at 5.8 - 6.6 yr lag with magnitudes of ~ 0.17 ± 0.09 for the correlation aa-ST, and ~ 0.15 ± 0.09 for Rz-ST. In addition, the two curves have similar behaviour with 1-2 yr lag between them, indicating that both solar parameters have a great role over ST.(4) In figure 2d, for a group 4, which is corresponding to elevation more than 500 m, and covering a period from 1890-2000. The largest peaks are at 15.8 yr lag with magnitudes of ~ 0.15 ± 0.09 for the correlation aa-ST, and ~ 0.07 ± 0.09 for Rz-ST. At zero lag, a negative value ~ - 0.18 ± 0.09 has been observed.It's obvious that the correlation coefficient for the ST and aa is approximately two times higher than the correlation coefficient for ST and Rz specially for group 4,these results are consistent with those from a previous study by [Valev, 2006], which showed the same result.To assess the solar climate link it is important to know the periodicities involved and their interactions with climate phenomena.A series of power spectral density (PSD) have been performed for the 12-month running average for four sub-regions (G1-G4), sunspot number Rz and the geomagnetic index aa from 1890 to 2004. The power spectral density is calculated for the wide range of frequencies (3.9x10⁻² -0.5 c/m), which corresponding to a range from 2 to 255 months (~ 21 yrs).Figure (3) shows the spectral analysis of the surface temperature (ST) for the second sub-regions (G2), geomagnetic indices (aa) and sunspot number (Rz). Plots show that there are no significant peaks observed in the high-frequency region corresponding to the period from ~ 16-2 month. A flat spectrum for the short-term fluctuations is observed. At the selected frequencies (>1.4 yr) the spectral density is high and shows significant variations in frequency. Significant peaks are observed (plot 3a) for surface temperature at 21.3, 15.5, 11.3, 10.04, 7.5, 5.5, 3.5 and 2.1 yrs while plot 3b of aa displayed peaks at wavelengths 15.5, 10.7, 8.1, and 5.1 yrs, furthermore the significant peaks for sunspot number are at 10.7yr. In plot 3b, a remarkable peak is observed at 10.7 yr with high amplitude, this peak was found in Rz spectrum. We found similar fluctuations of 15.5, 10-10.7, 7.5-8.1, 5.1-5.5 between aa and GST. Also, we found similar peak of wavelength 10.7 between Rz and GST. Nearly 10.7-year fluctuation is clear for each panel with few months separation related to the solar cycle. The spectrum of GST has been showed peak of 21.3, which may be related to the solar magnetic polarity. The 5.1-5.3 yr variation found in GST and aa may be attributed to the different paths of the ion particles in helioshpere. Similar periodicities of 5-5.2 years in the solar wind speed and ion spectral density were found (El-Borie, 2002; El-Borie and Darwish, 2006). A simple explanation for 7.5-8.1 year peak is that it may be related to the formation rate and the magnetic structure of achieve regions in the solar southern hemisphere (Mcintosh et al., 1992). So, the surface temperature are strongly sensitive to 21.3, 10.7-11.3, 8.9, and 5.1-5.3 yr variations that observed in the considered geomagnetic and sunspot spectra. Finally we confirm the same results for the other three sub-regions (G1, G3 and G4) with the geomagnetic index aa and the sunspot number. The results of the power spectral analysis for the four sub-regions for the surface temperature (ST), geomagnetic indices (aa) and sunspot number (Rz) with the confidence level 90%, 95%, 99% are reported in Table 3 with the confidence levels.
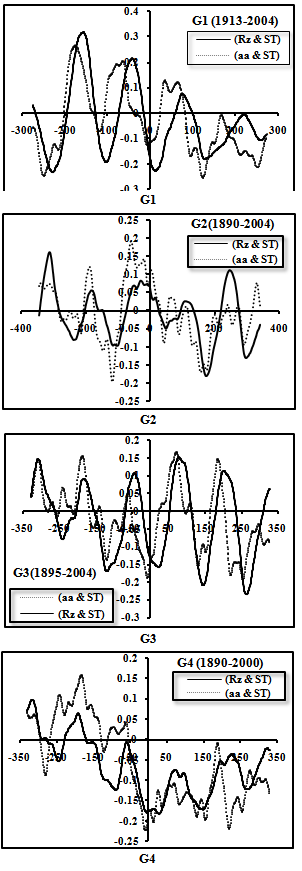 | Figure 2. Shows the running cross-correlation for the surface temperature of Canada (G1, G2, G3 and G4) with the geomagnetic index aa and the sunspot number. |
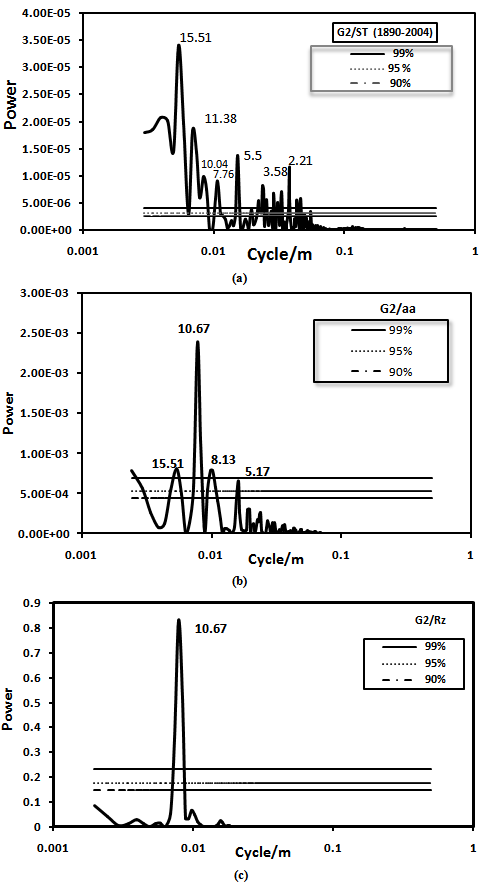 | Figure 3. Power spectrum density based on the monthly means of: (a) surface temperature. (G2) (b) aa geomagnetic index. (b) Sunspot numbers Rz, for the period 1890 -2004 |
| |||||||||||||||||||||||||||||||||||||||||||||||||||||||||||||||||||
| |||||||||||||||||||||||||||||||||||||||||||||||||||||||||||||||||||||||||||||||||||||||||||||||||||||||||||||||||||||
4. Conclusions
- Through the years the conflict between researchers about whether global warming is a human-generated phenomena or a result of solar variability has raised many question marks. The aim of this work is to try to answer some of these questions by studying the possible role of some solar variability parameters such as the aa geomagnetic index, the sunspot number in regional surface temperature in Canada. Firstly we started to study the Cross correlation analysis between each parameter (aa & Rz) and the four sub-regions (G1, G2, G3 and G4) for the ST in Canada. This analysis revealed that the aa index is well correlated with the anomalies G1, r = 0.28±0.09 during this period with 12.5-14.2 yr lag time, it also has a high anticorrelation between aa and G4 through cycle 13 with magnitude r = -0.678 ± 0.084. We also, found a modulate correlation between the sunspot number Rz and G1 (r = 0.32 ± 0.09), when Rz lag the GST by 12.5 years.Then we compared the power spectral density (PSD) of the Rz and aa with the four sub-regions (G1, G2, G3 and G4) in Canada, in order to get a closer look at a possible connection between them. Their spectra have common periodicity of 21.3, 10.7-11.3, 8.9, and 5.1-5.3 years.The power of the ST spectra revealed stronger peak at 21.3yr than 11.6yr. It may be related to the changes in the polarities of main solar magnetic field. This obtained result demonstrates that the interplanetary magnetic field (IMF) effect is more powered on ST than the solar activity cycle. Significant peak at 10.7 yr is observed in both aa and Rz series which is the most established cycle of solar activity.Geomagnetic activity seems to be the possible link through which the solar activity controls the earth’s climate. We believe that the role of the sun variations in forcing the climate change could be a real reason and it is still an open question. Geomagnetic activity indices reflect variations in the solar wind plasma and solar activity parameters. Variations in these parameters have a pronounced effect on the cosmic ray intensity observed on the Earth, which in turn could be of consequences in some of the geophysical processes. The changing aa baseline is somehow related to a long-term irradiance variation on the Sun, there is another possibility and that is that the solar wind itself influence climate, as a result of solar wind itself influence climate, as a result of CR modulation and its effects on the global s CR modulation and its effects on the global electric circuit and cloud nucleation.We conclude that solar variability parameters play an important role in climate change and cannot be excluded from the responsibility of continues global warming. We think that the combined effect of solar-induced changes and increase in the atmospheric greenhouse gases offer the best explanation yet for the observed rise in average global temperature over the recent years.
References
| [1] | Allen, M.R., and Smith, L.A., “Investigate the origins and significant of low frequency modes of climate variability”, Geophy. Res. Lett. 21, 883, 1994 |
| [2] | Benestad, R.E.,” Solar activity and Earth’s climate”, Springer. 12, 273, 2002 |
| [3] | Benner, T.C.“long-term variability and teleconnections”. International Journal of Climatology 19, 391–403,1999. |
| [4] | Crowley, T.J., “Causes of climate change over the past 1000 years”, Science. 289, 270, 2000 |
| [5] | Eddy, J.A., “The Maunder Minimum”, Science. 192, 1189, 1976. |
| [6] | El-Borie, M.A., “Major-Energetic particle fluxes: I. Comparison with the associated ground level enhancements of cosmic rays”, J. Astroparticle. Phys. 19, 549, 2003a |
| [7] | El-Borie, M.A., “Major-Energetic particle fluxes: II. Comparison of the interplanetary between the three largest high energy peak flux events”, J. Astroparticle. Phys. 19, 667, 2003b |
| [8] | El-Borie, M.A., “On long – term periodicities in solar-wind ion density and speed measurements during the period 1973-2000”, Solar Phys. 208, 345, 2002 |
| [9] | El-Borie, M.A., and Darwish, A., “Periodicities in geomagnetic activity indices and solar wind parameters, and their possible solar orgin”, ΙΙ Nuovo Cimento. 29 C, 539, 2006 |
| [10] | El-Borie, M.A., and Al-Thoyaib, S.S., International J. of Physical Science, 1(2), 67, 2006 |
| [11] | El-Borie, M.A., Shafik, E., Abdel-halim, A.A., and El-Monier, S.Y., Spectral Analysis of Solar Variability and Their Possible Role on the Global Warming, Journal of Environmental Protection, 11, 111-116, 2010 |
| [12] | El-Borie,M.A., Abdel-Halim, A.A., Shafik, E., and El-Monier, S.Y., Possibility of a Physical Connection Between Solar Variability and Global Temperature Change throughout the Period 1970-2008, Inter. J. Res & Rev. in Applied Sci., 6(3), 296-301, 2011a |
| [13] | El-Borie, M.A., Al-Sayed Aly , N., and Al-Taher, A., Mid-Term Periodicities of Cosmic Ray Intensities, Journal of Advanced Research, 2, 137-147, 2011b |
| [14] | Georgieva, K., Kirov, B., Tonev, P., Guineva, V., and Atanasov, D., “Long- Term Variations in the correlation between NAO and solar activity, the important of north –south solar activity asymmetry for atmospheric circulation”, Advance in Space Res. 40 (7), 1152, 2007 |
| [15] | Hoyt, D.V., and Schatten, K.H., “The role of the Sun in climate change”, Oxford university press. 32, 1997 |
| [16] | IPCC Working Group I, The Physical Science Basis, Expert Meeting - Integrating Analysis of Regional Climate Change and Response Options”, was held in Denarau Island, Nadi, Fiji, 2007 |
| [17] | IPCC, Intergovernmental panel on climate change, Expert Meeting on “Detection and Attribution Related to Anthropogenic Climate Change”, was held in Geneva, Switzerland, 2009 |
| [18] | Jones, P.D., New, M., Parker, D.E., Martin, S., Rigor, I.G. Surface air “Temperature and its changes over the past 150 years”. Review of 173–186,1999 |
| [19] | Kilick, A., “Regional Sun-climate interaction”, J. Atmos & Solar Terr. Phys. 67, 1573, 2005 |
| [20] | Kilick, A., özgüc, A., Rozelot, J.p. and Yesilyurt , S., “ Possible traces of solar activity effect on the surface air temperature of turkey”, J. Atmos & Solar Terr. Phys. 70,1669, 2008 |
| [21] | Landscheidt, T.,” 1st Solar & Space Weather, Tenerife” solar wind near Earth: indicator of variations in global temperature”, ESA-SP. 463, 497, 2000 |
| [22] | Lassen, K., and Friis-Christensen, E., “Solar cycle lengths and climate”. A reference revisited’ by P. Laut and J. Gundemann, J. Geophys. Res. 105, 27493, 2000 |
| [23] | Lassen, K., and Friis-Christensen, E., “Variability of the solar cycle length during the past five centuries and the apparent association with terrestrial climate”, J. Atmos & Solar. Terr. Phys. 57, 835, 1995 |
| [24] | Laut, P., and Gundermann, J., “Is there a correlation between solar cycle lengths and terrestrial temperatures?”, Proceeding of the 1st Solar & Space Weather Euroconference: The Solar Cycle and Terrestrial Climate. European Space Agency, 189, 2000b |
| [25] | Laut, P., and Gundermann, J., “Solar cycle lengths and climate”, J. Geophys. Res. 105, 27489, 2000a |
| [26] | Lockwood, R., Stamper, R., and Wild, M.N., “A doubling of the Sun’s Coronal magnetic field during the past 100 years”, Nature. 399, 437, 1999 |
| [27] | Mann, M.E., Cane, M.A., and Zebiak, S.E., “Volanic and Solar forcing of the tropical pacific over the past 1000 years”, J. Climate. 18, 447, 2005 |
| [28] | Mann, M.E., Park, J. “Joint spatiotemporal modes of surface Temperature and sea level pressure variability in the Northern Hemisphere during the last century”. Journal of Climate 9, 2137–2162,1996 |
| [29] | Mcintosh, P.S., Thompson, R.J., and Wilcox, E.C., “A 600-day periodicity in solar coronal holes”, Nature. 360, 322, 1992 |
| [30] | North, G.R., and Stevens, M., “Detecting climate signals in the surface temperature records”, J. climate. 11, 563, 1998 |
| [31] | Pulkkinen, T.I., Nevanlinna, H., and Lockwood, M., “The Sun-Earth connection in time scales from years to decades and Centuries”, Space Sci. Rev. 95, 625, 2001 |
| [32] | Shah, G. N., and Mufti, S., “Anti-podal geomagnetic activity, sea surface temperature and long-term solar variations”, 29th International Cosmic Ray Conference Pune. 2, 311, 2005 |
| [33] | Souza Echer, M.P., Echer, E., Nordemann, D.J.R., and Rigozo, N.R., “Multi-resolution analysis of global surface air temperature and solar activity relationship”, J. Armos & Solar Terr. Phys. 71, 41, 2009 |
| [34] | Thejll, P., and Lassen, K., “Solar forcing of the Northern hemisphere land air temperature: New data”, J. Atmos & Solar Terr. Phys. 62, 1207, 2000 |
| [35] | Valev,D. "physics and chemistry of the earth 31 (1-3), pp 109-112,(2006). |
| [36] | Wigley, T.M.L, “The observed global warming record: what does it tell us?”, The National Academy of Sciences. 94, 8314, 1997 |