World Environment

p-ISSN: 2163-1573    e-ISSN: 2163-1581

2011;  1(1): 6-13

doi: 10.5923/j.env.20110101.02

Pollution in Water of Kasardi River Flowing along Taloja Industrial Area of Mumbai, India

Ram S. Lokhande 1, Pravin U. Singare 2, Deepali S. Pimple 3

1Department of Chemistry, University of Mumbai, Santacruz, Vidyanagari, Mumbai 400098, India

2Department of Chemistry, Bhavan’s College, Munshi Nagar, Andheri (West), Mumbai 400058, India

3Department of Chemistry, R.J. College, Ghatkopar, Mumbai 400086, India

Correspondence to: Pravin U. Singare , Department of Chemistry, Bhavan’s College, Munshi Nagar, Andheri (West), Mumbai 400058, India.

Email:

Copyright © 2012 Scientific & Academic Publishing. All Rights Reserved.

Abstract

The area of study selected in the present investigation was Kasardi River which receives heavy discharge of waste effluent from the nearby Taloja industrial belt which is one of the fastest developing industrial belt of Mumbai. The study was performed to investigate the concentration of toxic heavy metals like chromium (Cr), cadmium (Cd), nickel (Ni), zinc (Zn), copper (Cu), lead (Pb) and iron (Fe) in river. It was observed that concentration of most of these heavy metals were much higher than the maximum permissible limits. These heavy metals have created threat to the aquatic life and through biomagnifications may enter the food chain thereby affecting the human beings as well. The research work was extended further to study the physico-chemical properties like temperature, pH, solid content, chloride, oil / grease content, BOD and COD values of the river water. The authors point out that as India moves towards stricter regulation of industrial effluents to control water pollution, there is a need to implement common objectives, compatible policies and programmes for improvement in the industrial waste water treatment methods.

Keywords: Heavy Metals, River Water Pollution, Industrial Effluent, Physico-Chemical Properties, Kasardi River, Taloja Industrial Area, Mumbai; India

Cite this paper: Ram S. Lokhande , Pravin U. Singare , Deepali S. Pimple , "Pollution in Water of Kasardi River Flowing along Taloja Industrial Area of Mumbai, India", World Environment, Vol. 1 No. 1, 2011, pp. 6-13. doi: 10.5923/j.env.20110101.02.

1. Introduction

In India most of the industries are situated along the river banks for easy availability of water and also disposal of the wastes. These wastes often contain a wide range of contaminants such as petroleum hydrocarbons, chlorinated hydrocarbons and heavy metals, various acids, alkalis, dyes and other chemicals which greatly change the pH of water. The waste also includes detergents that create a mass of white foam in the river waters. All these chemicals are quite harmful or even fatally toxic to fish[1,2,3] and other aquatic populations[4]. It is found that one-third of the total water pollution in India comes in the form of industrial effluent discharge, solid wastes and other hazardous wastes. Most of these defaulting industries are petrochemical industries, sugar mills, distilleries, leather processing industries, paper mill, agrochemicals and pesticides manufacturing industries and pharmaceutical industries. For such industries the surface water is the main source for waste disposal. Untreated or allegedly treated effluents have increase the level of surface water pollution up to 20 times the safe level in 22 critically polluted areas of the country. It is found that almost industry or the other[5-7]. Although all industries in India all rivers are polluted in most of the stretches by some function under the strict guidelines of the Central Pollution Control Board (CPCB) but still the environmental situation is far from satisfactory. Different norms and guidelines are given for all the industries depending upon their pollution potentials. Most major industries have treatment facilities for industrial effluents. But this is not the case with small scale industries, which cannot afford enormous investments in pollution control equipment as their profit margin is very slender. As a result there are sufficient evidences available related with the mismanagement of industrial wastes[8-15]. Consequently, at the end of each time period the pollution problem takes menacing concern. Some of the previous studies in the Arabian Sea have shown that the petroleum hydrocarbons ranged from 1.8 to 11.1mg/L in water, 1.84 to 5.81mg/g dry wt in sediments and 0.33 to 3.67mg/g wet wt in fish[16], while the total DDT in zooplankton samples in the Arabian Sea[17] varied from 0.083 to 0.563mg/L. The problem of water pollution has become still worse due to toxic heavy metals. The increasing trend in concentration of heavy metals in the aquatic environment has attracted considerable attention amongst ecologists globally during the last decades and has also begun to cause concern in most of the major industrialized cities. Untreated or allegedly treated industrial effluents often contains variable amounts of heavy metals such as arsenic, lead, nickel, cadmium,copper, mercury, zinc and chromium[12-15,18-20], which have the potential to contaminate crops growing under such irrigation. These heavy metals have a marked effect on the aquatic flora and fauna which through bio-magnification enter the food chain and ultimately affect the human beings as well. Heavy metal pollution is an ever increasing problem of aquatic bodies. In India, incidence of toxic heavy metal accumulation in fish, oysters, sediments and other components of aquatic ecosystems have been reported regularly[1,2]. These toxic heavy metals entering in aquatic environment are adsorbed onto particulate matter, although they can form free metal ions and soluble complexes that are available for uptake by biological organisms[21]. The metals associated with particulate material are also available for biological uptake[22], and are deposited in estuarine sediments[23]. Once deposited, binding by sulfides and/or iron hydroxides immobilizes trace metals until a change in redox or pH occurs[24,25]. Thus, surfical sediments, particularly the fine fraction, accumulate trace metals and provide a means for evaluating the long term accumulation of contaminants[26,27]. Hence there is a need for extensive monitoring of river water pollution along the industrial zones over long periods of time in order to describe average metal precipitation[28] and its trend, which is an essential component of any pollution control management.
The day by day increasing tremendous pollution load along most of the rivers in India has prompted us to carry the systematic and detail study of water pollution in Kasardi River of Taloja industrial area of Mumbai.

2. Materials and Methods

2.1. Area of Study

The Kasardi River which is the study area of present investigation receives heavy pollution load from nearby Taloja industrial area, which is one of the most rapidly developing and heavily polluted industrial belts of Mumbai. The industrial area is spread over 863.18 hectares of land consisting of about 600 large and medium scale industries like engineering units, steel processing industries, chemical units, paints, pharmaceutical units, textile industries etc. The study area lies between latitude 19°3'39"N longitudes 73°6'57"E. The main water source for the industrial consumption is Maharashtra Industrial Development Corporation (MIDC). The industrial area utilizes about 45,000 m3/day of fresh water. The effluent discharge, treated and untreated amounts to 28,750m3/day i.e., 64% of the total industrial effluents. Except for a few major industries, the medium and the small scale industries discharge their treated or untreated effluents through the unlined surface drains into the Kasardi River. Also atmospheric fallout from the chimneys and vehicle exhausts reach the river after washout. All this, has resulted in heavy pollution of the Kasardi River, thereby creating health hazards for local population and also disturbing the aquatic life of the river[7].

2.2. Climatic Conditions

The weather of the study area is typical coastal sultry and humid. The average rainfall records from 1,500mm to 2,000mm. The place experiences the onset of the monsoon in the month of June and experiences monsoon till the end of September. The average temperature recorded varies from 25 to 42 degrees.

2.3. Requirements

All the glassware, casserole and other pipettes were first cleaned with tape water thoroughly and finally with de-ionized distilled water. The pipettes and burette were rinsed with solution before final use. The chemicals and reagent were used for analysis were of analytical reagent grade. The procedure for calculating the different parameters were conducted in the laboratory.

2.4. Water Sampling and Preservation

The water samples were collected randomly twice in a month in morning, afternoon and evening from upstream and downstream stations of the river. Polythene bottles of 2.5L and 2.0L were used to collect the grab water samples (number of samples collected, n = 19). The bottles were thoroughly cleaned with hydrochloric acid, washed with tape water to render free of acid, washed with distilled water twice, again rinsed with the water sample to be collected and then filled up the bottle with the sample leaving only a small air gap at the top. The sample bottles were stoppard and sealed with paraffin wax. The samples were collected every alternate month for the period of two assessment years 1999 and 2000. Water samples (500mL) were filtered using Whatman No. 41 (0.45μm pore size) filter paper for estimation of dissolved metal content. Filtrate (500mL) was preserved with 2mL nitric acid to prevent the precipitation of metals. The samples were concentrated on a water bath depending on the suspected level of the metals[29].

2.5. Heavy Metal Analysis by AAS Technique

The analysis for the majority of the trace metals like chromium (Cr), cadmium (Cd), nickel (Ni), zinc (Zn), copper (Cu), lead (Pb) and iron (Fe) was done by Perkin Elmer ASS-280 Flame Atomic Absorption Spectrophotometer. The calibration curves were prepared separately for all the metals by running different concentrations of standard solutions. A reagent blank sample was taken through the method, analyzed and subtracted from the samples to correct for reagent impurities and other sources of errors from the environment. Average values of three replicates were taken for each determination.

2.6. Physico-Chemical Study

The samples were collected were analyzed for temperature, pH, total dissolved and suspended solids,chloride content, oil /grease, BOD and COD values. The techniques and methods followed for collection, preservation, analysis and interpretation are those given by Rainwater and Thatcher[30], Brown et al.[31], ICMR[32], Hem[33] and American Public Health Association (APHA)[34].

3. Results and Discussion

The experimental data on heavy metal content and physico-chemical properties of water samples collected from Kasardi River flowing along Taloja industrial estate of Mumbai is presented in Tables 1 and 2.
A number of elements are normally present in relatively low concentrations, usually less than a few mg/L, in conventional irrigation waters and are called trace elements. Heavy metals are a special group of trace elements which have been shown to create definite health hazards when taken up by plants. Under this group are included, Cr, Cd, Ni, Zn, Cu, Pb and Fe. These are called heavy metals because in their metallic form, their densities are greater than 4g/cc.
Table 1. Heavy Metal Content in Water Samples of Kasardi River
     
Table 2. Physico-Chemical Properties of Kasardi River Water Samples
     
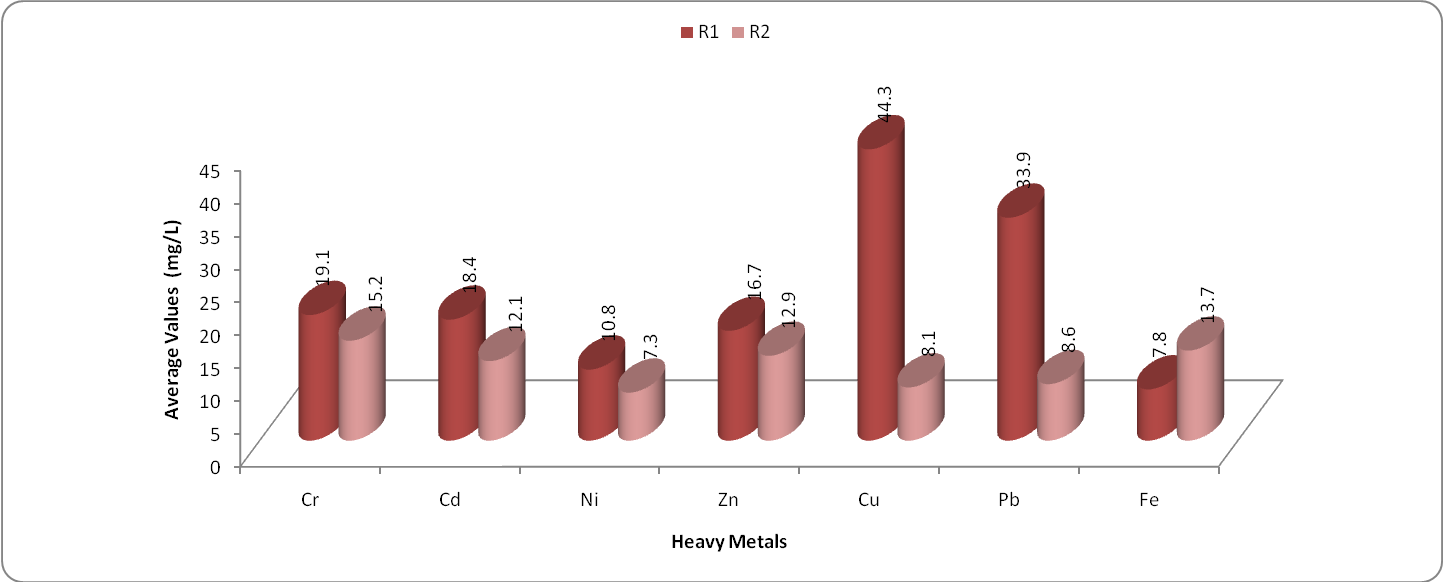
Figure 1. Variation in average concentration of toxic heavy metals in water samples of Kasardi River of Mumbai
The average Cr content in water samples was found to vary between 19.1mg/L in downstream and 15.2mg/L in upstream of the river (Figure 1), which was higher than the permissible limit of 0.05mg/L set by WHO[34]. Cr compounds are used as pigments, mordents and dyes in the textiles and as the tanning agent in the leather. The sources of emission of Cr in the surface waters are from municipal wastes, laundry chemicals, paints, leather, road run off due to tire wear, corrosion of bushings, brake wires and radiators, etc. The high level of Cr in waste water effluent indicates excessive pollution from textile industries and tanneries[10]. Acute toxicity of Cr to invertebrates is highly variable, depending upon species[36]. For invertebrates and fishes, its toxicity is not much acute. Cr is generally more toxic at higher temperatures and its compounds are known to cause cancer in humans[37]. The toxic effect of Cr on plants indicate that the roots remain small and the leaves narrow, exhibit reddish brown discoloration with small necrotic blotches[38].
Cd is contributed to the surface waters through paints, pigments, glass enamel, deterioration of the galvanized pipes etc. The wear of studded tires has been identified as a source of Cd deposited on road surfaces. The average Cd content in water samples was found to vary between 18.4mg/L in downstream and 12.2mg/L in upstream of the river (Figure 1). The values obtained were found to be extremely higher than the permissible limit of 0.01mg/L set by WHO[39] and also according to USPH standards. Higher values of Cd in waste water effluent samples suggest the high level of pollution due to dyes paints and pigments manufacturing industries around. There are a few recorded instances of Cd poisoning in human beings following consumption of contaminated fishes. It is less toxic to plants than Cu, similar in toxicity to Pb and Cr. It is equally toxic to invertebrates and fishes[36].
The average Ni content in the water samples was found to vary between 10.8 and 7.3mg/L in downstream and upstream of the river respectively (Figure 1). The experimental measured values are very much higher than the maximum limit of 0.1mg/L set by WHO. Short-term exposure to Ni on human being is not known to cause any health problems, but long-term exposure can cause decreased body weight, heart, liver damage and skin irritation[40]. The carcinogenic action of nickel carbonyl on rat was reported earlier by Sunderman[41]. Ni can accumulate in aquatic life, but its magnification along in food chain is not confirmed.
In the present study the average concentration of Zn in downstream and upstream water samples was found to be 16.7mg/L and 12.9mg/L respectively (Figure 1), which was also above the permissible limit of 5.5mg/L as per USPH standard. Excessive concentration of Zn may result in necrosis, chlorosis and inhibited growth of plants.
The average Cu content in water samples was found to vary between 44.3mg/L in downstream and 8.1mg/L in upstream of the river (Figure 1). The observed values were above the permissible limit of 0.05mg/L set by WHO and 1.0mg/L as per the USPH standards. It is important here to note that Cu is highly toxic to most fishes, invertebrates and aquatic plants than any other heavy metal except mercury. It reduces growth and rate of reproduction in plants and animals. The chronic level of Cu is 0.02–0.2mg/L,[36]. Aquatic plants absorb three times more Cu than plants on dry lands[38]. Excessive Cu content can cause damage to roots, by attacking the cell membrane and destroying the normal membrane structure; inhibited root growth and formation of numerous short, brownish secondary roots. Cu becomes toxic for organisms when the rate of absorption is greater than the rate of excretion, and as Cu is readily accumulated by plants and animals, it is very important to minimize its level in the waterway.
Lead is one of the oldest metals known to man and is discharged in the surface water through paints, solders, pipes, building material, gasoline etc. Lead is a well known metal toxicant and it is gradually being phased out of the materials that human beings regularly use. Combustion of oil and gasoline account for > 50% of all anthropogenic emissions, and thus form a major component of the global cycle of lead. Atmospheric fallout is usually the most important source of lead in the freshwaters[36]. The average concentration of Pb in water samples was found out to be 33.9mg/L in downstream and 8.6mg/L in upstream of the river (Figure 1), which was extremely higher than the permissible limit for lead in drinking water is <0.05mg/L according to the USPH drinking water standards[34]. Acute toxicity generally appears in aquatic plants at concentration of 0.1–5.0mg/L. In plants, it initially results in enhanced growth, but from a concentration of 5 ppm onwards, this is counteracted by severe growth retardation, discoloration and morphological abnormalities. There is an adverse influence on photosynthesis, respiration and other metabolic processes. Acute toxicity of Pb in invertebrates is reported at concentration of 0.1–10mg/L,[36]. Higher levels pose eventual threat to fisheries resources.
In the present study, the average concentrations of Fe vary from 7.8 to 13.7mg/L in downstream and upstream of the river (Figure 1). The observed experimental value was very much higher than the permissible limit of iron which is 0.3mg/L. The presence of high concentration of Fe may increase the hazard of pathogenic organisms; since most of these organisms need Fe for their growth[40].
Temperature is one of the most important ecological features. It controls behavioural characteristics of organisms, solubility of gases and salts in water. The basis of all life functions is complicated set of biochemical reactions that are influenced by physical factors such as temperature. Disease resistance is also linked to temperature. Increase in temperature also increases the rate of microbial activity. Temperature increase may become barrier to fish migration and in this way seriously affect on reproduction of species. The major sources of thermal pollution are industrial cooling systems working in a manufacturing plant or a power plant. In the present study, the average temperature of river water varies between 27.5°C and 29.7°C respectively in upstream and downstream of the river (Figure 2).
pH is a measure of the acidity or alkalinity of water and is one of the stable measurements. pH is a simple parameter but is extremely important, since most of the chemical reactions in aquatic environment are controlled by any change in its value. Anything either highly acidic or alkaline would kill marine life. Aquatic organisms are sensitive to pH changes and biological treatment requires pH control or monitoring. The toxicity of heavy metals also gets enhanced at particular pH. Thus, pH is having primary importance in deciding the quality of waste water effluent. Waters with pH value of about 10 are exceptional and may reflect contamination by strong base such as NaOH and Ca(OH)2[42]. The range of desirable pH of water prescribed for drinking purpose by ISI[43] and WHO[44] is 6.5 to 8.5. The average pH values of water samples in the downstream of river was 6.3 which was slightly below the acceptable limit, while that in the upstream was 8.7 which was slightly high above the permissible limit (Figure 2).
Chloride occurs in all natural waters in widely varying concentrations. Excessive chloride in potable water is not particularly harmful and the criteria set for this anion are based primarily on palatability and its potentially high corrosiveness[45]. Chloride in excess (> 250mg/L) imparts a salty taste to water and people who are not accustomed to high chlorides may be subjected to laxative effects. The chloride content in the river water samples ranged between 224mg/L in downstream and 222mg/L in upstream of the river (Figure 2). The results indicate that the chloride content is slightly above the acceptable limit of 200mg/L set by WHO and within the limits of 250mg/L according to ISI.
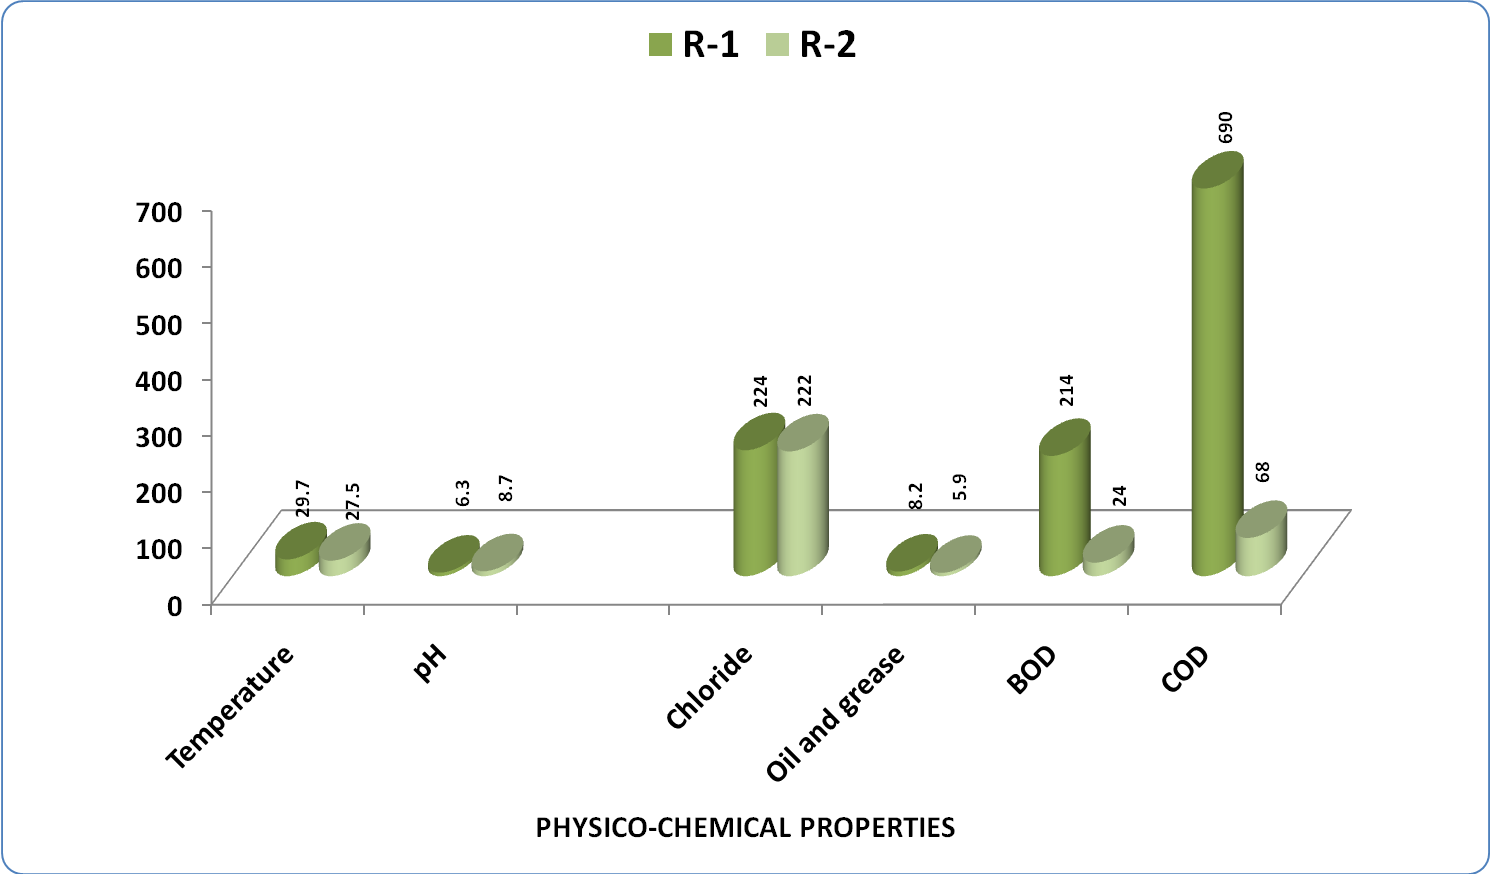
Figure 2. Variation in average Physico-Chemical parameters in water samples of Kasardi River of Mumbai
In the present investigation the average oil and grease content in downstream and upstream of the river was found to be 8.2mg/L and 5.9mg/L respectively. It is important here to note that oil which forms a surface film on the river can coat plants and animals reducing oxygenation from the atmosphere above. The film of oil that floats over the water body affects the transmission of light through the water body there by disturbing the process of photosynthesis in the aquatic plants. In animals, oil coating can destroy the insulating properties of fur and feathers. Oil bioaccumulates in the higher animals and further enters the food chain. Detergents create frothing, and can harm invertebrates and fish; as they are a major source of phosphates. Moreover, petroleum or grease spilled over water also produces chemicals that are extremely harmful for marine animals.
BOD may be defined as the rate of removal of oxygen by microorganisms in aerobic degradation of the dissolved organic matter in water over a 5-day period. Increases in BOD can be due to heavy discharge of industrial waste water effluent, animal and crop wastes and domestic sewage. BOD values have been widely adopted as a measure of pollution effect. It is one of the most common measures of pollutant organic material in water. It indicates the amount of putrescible organic matter present in water. Sources of BOD include leaves and woody debris, dead plants and animals, animal manure, effluents from pulp and paper mills, wastewater treatment plants, feedlots, and food-processing plants, failing septic systems, and urban storm water runoff. According to UN Department of Technical Cooperation for Development the maximum permitted BOD content is < 100 to 300mg/L. The experimental data of present study indicates that the average BOD value in downstream of the river was 214mg/L indicating slightly high pollution level (Figure 2). It is important here to note that low BOD content is an indicator of good quality water, while a high BOD indicates polluted water. BOD directly affects the amount of dissolved oxygen (DO) in rivers and streams. The greater the BOD, the more rapidly oxygen is depleted in the stream. This means less oxygen is available to higher forms of aquatic life. The consequences of high BOD are the same as those for low DO: aquatic organisms become stressed, suffocate, and die.
All organic compounds with few exceptions can be oxidized by the action of strong oxidizing agents under acidic condition. The Chemical Oxygen Demand (COD) determination is a measure of the oxygen equivalent of that portion of the organic matter in a sample that is susceptible to oxidation by a strong chemical oxidant. During COD determination; oxygen demand value is useful in specifying toxic condition and presence of biologically resistant substances. It is an important, rapidly measured parameter for industrial waste water studies and control of waste treatments. COD test is used to measure the load of organic pollutants in the industrial waste water. The COD and BOD values both are a measure of the relative oxygen-depletion effect of a waste contaminant. Both have been widely adopted as a measure of pollution effect. COD is also one of the most common measures of pollutant organic material in water. COD is similar in function to BOD, in that both measure the amount of organic compounds in water. In the present investigation the average COD values lies between 690mg/L in downstream and 68mg/L in upstream of the river (Figure 2), which was very much higher than maximum allowed limit of 4.0mg/L according to USPH Standard.
Total dissolved solids (TDS) content in water is a measure for salinity. A large number of salts are found dissolved in natural waters, the common ones are carbonates, bicarbonates, chlorides, sulphates, phosphates, and nitrates of calcium, magnesium, sodium, potassium, iron, and manganese, etc. A high content of dissolved solid elements affects the density of water, influences osmoregulation of freshwater in organisms, reduces solubility of gases (like oxygen) and utility, of water for drinking, irrigational, and industrial purposes.
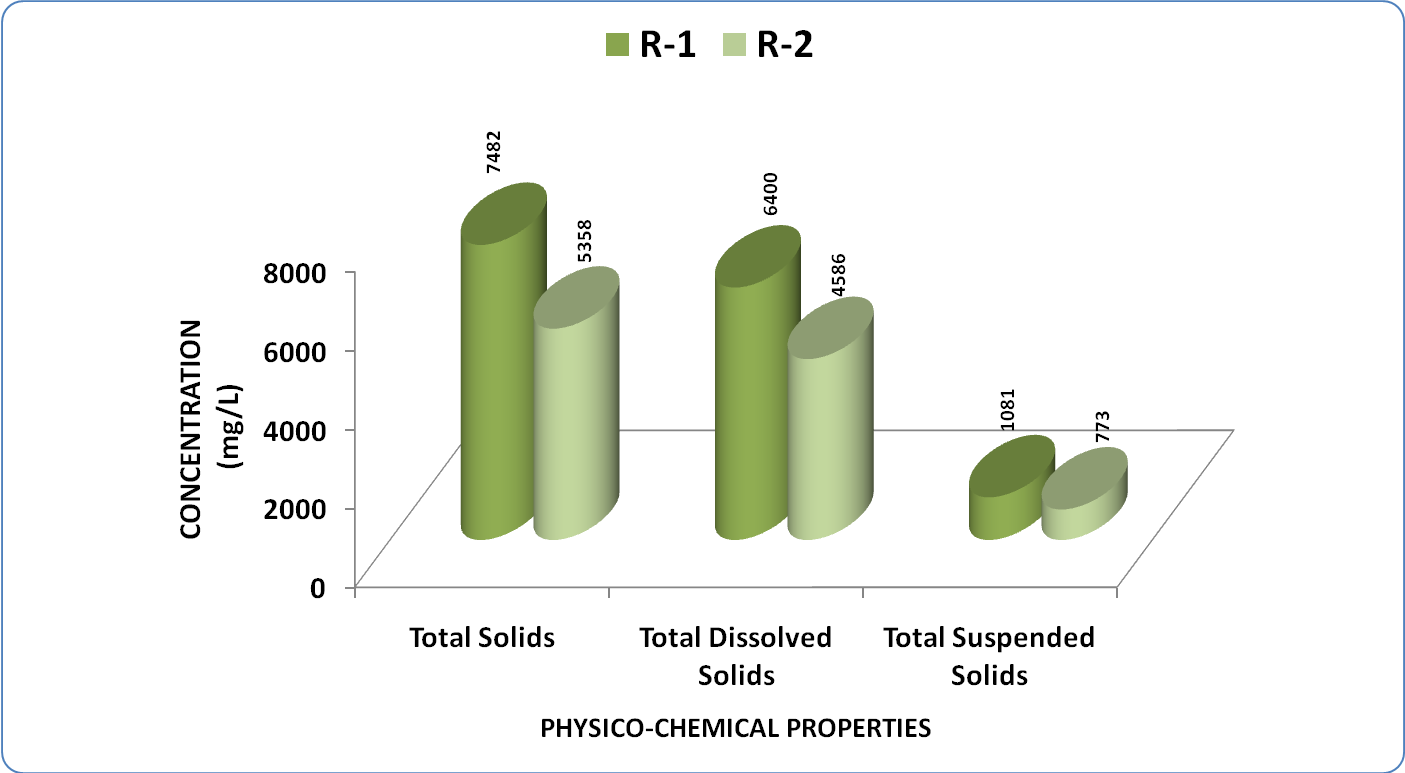
Figure 3. Variation in average concentration of solid content in water samples of Kasardi River of Mumbai
In the present investigation, the average value of TDS lies in the range of 6400 in downstream and 4586mg/L in upstream of the river (Figure 3). Waters can be classified based on the concentration of TDS[46] as, desirable for drinking (up to 500mg/L), permissible for drinking (up to 1,000mg/L), useful for irrigation (up to 2,000mg/L), not useful for drinking and irrigation (above 3,000mg/L). Based on the above classification the river water cannot be considered safe even for irrigation purpose.

4. Conclusions

Around the world as countries are struggling to arrive at an effective regulatory regime to control the discharge of industrial effluents into their ecosystems, Indian economy holds a double edged sword of economic growth and ecosystem collapse. The present experimental data indicates high level of pollution along Kasardi River of Taloja Industrial estate of Mumbai, India. The experimental data suggests a need to implement common objectives, compatible policies and programmes for improvement in the industrial waste water treatment methods. It also suggests a need of consistent, internationally recognized data driven strategy to assess the quality of waste water effluent and generation of international standards for evaluation of contamination levels. The existing situation if mishandled can cause irreparable ecological harm in the long-term well masked by short term economic prosperity.

ACKNOWLEDGEMENTS

The authors are extremely thankful to SAP productions for developing and maintaining the manuscript template.

References

[1]  Aghor, ‘Chemicals make Thane creek the worst polluted water body'. Daily DNA. August 14, 2007. Mumbai, India. [Online]. Available: http://www.dnaindia.com/mumbai/report_chemicals-make- thane- creek- the-worst- polluted-waterbody_1115439
[2]  D. Patil, ‘A lot's fishy about our creek and lake fish’. DailyTimes of India. March 22, 2009. Mumbai, India. [Online]. Available: http://timesofindia.indiatimes.com/city/thane/A-lots- fishy-about-our-creek-and-lake-fish/articleshow/4298566.cms.
[3]  Kumar, A., 1996,Impact of industrial pollution on the population status of endangered Gangetic dolphin (Platanista gangetica) in the River Ganga in Bihar., India Pol. Arch. Hydrobiol., 18(4), 469-476
[4]  Chakravarty, R. D., Roy, P., Singh, S. B., 1959, A quantitative study of the plankton and the physicochemical conditions of the River Jumna at Allahabad in 1954-55., Indian J.Fish., 6(1), 186-203
[5]  M. D. Zingde, K. Govindan, Health status of coastal waters of Mumbai and regions around. In: Environmental Problems of Coastal Areas in India (ed. V. K. Sharma), Bookwell Publishers., New Delhi, pp. 119–132 (2001)
[6]  Modak, D. M., Singh, K. P., Ahmed, S., and Ray, P. K., 1990, Trace metal ion in Ganga water system., Chemosphere, 21(1-2), 275-287
[7]  Lokhande, R. S., Singare, P. U., and Pimple, D. S., 2011, Quantification Study of Toxic Heavy Metals Pollutants in Sediment Samples Collected from Kasardi River Flowing along the Taloja Industrial Area of Mumbai, India., The New York Science Journa l 4(9), 66-71.
[8]  Rajaram, T., and Das, A., 2008, Water pollution by industrial effluents in India: discharge scenarios and case for participatory ecosystem specific local regulation. Futures, 40(1), 56-69
[9]  Khurshid, S., Abdul, B., Zaheeruddin, A., and Usman, S. M., 1998, Effect of waste disposal on water quality in parts of Cochin, Kerala. Indian J.Environ.Health, 40(1), 45-50
[10]  Pachpande, B. G., and Ingle, S. T., 2004, Recovery of the chromium by chemical precipitation from tannery effluent, Orient J. Chem., 20(1), 117-123
[11]  Prabha, S., and Selvapathy, P., 1997, Heavy metal pollution in Indian Rivers., Indian J. Environ. Prot., 17(6), 641-649
[12]  Singare, P. U., Lokhande, R. S., and Pathak, P. P., (2010), Study on Physico-Chemical properties and Heavy Metal Content of the Soil Samples from Thane Creek of Maharashtra, India, Interdisciplinary Environmental Review, 11(1), 38-56
[13]  Singare, P. U., Lokhande, R. S., and Jagtap, A. G., 2011, Water pollution by discharge effluents from Gove Industrial Area of Maharashtra, India: Dispersion of heavy metals and their Toxic effects., International Journal of Global Environmental Issues, 11(01), 28-36
[14]  Singare, P. U., Lokhande, R. S., and Bhattacharjee, S. S., 2011, Physico-Chemical Analysis of the Sediment Samples collected from Thane Creek of Maharashtra, India, Interdisciplinary Environmental Review, 12(2), 95-107
[15]  Singare, P. U., Lokhande, R. S., and Jagtap, A. G., 2010, Study of Physico-chemical quality of the Industrial Waste Water Effluent from Gove Industrial Area of Bhiwandi City of Maharashtra, India, InterdisciplinaryEnvironmental Review, 11(4), 263-273
[16]  Sengupta, R., Fondekar, S. P., and Alagarsamy, R., 1993, State of pollution in the Arabian Sea after 1991 Gulf oil spill., Mar. Pollut. Bull., 27(1), 85-91
[17]  Shailaja, M. S., and Sengupta, R., 1990, Residues of dichlorodiphenyltrichloroethane and metabolites in zooplankton from the Arabian Sea., Curr. Sci., 59(19), 929-931
[18]  Sharma, R. K., Agrawal, M., and Marshall, F. M., 2004, Effects of waste water irrigation on heavy metal accumulation in soil and plants., Paper presented at a National Seminar, Bangalore University, Bangalore, Abst. no. 7, pp. 8
[19]  P. U. Singare, Heavy metal -- in and around the lakes- Pollution due to toxic heavy metals at the Jail Talav and Kalwa Lakes of Thane City, EurekAlert!-Atmospheric Science – Sunday, August 7, 2011. [Online].Available: http://www.worldweatherpost.com/2011/08/07/india- heavy-metal-in-and-around-the-lakes/
[20]  P. U. Singare, Thane lakes high on metal content: Study, Daily Times of India. August 10, 2011. Mumbai, India. [Online].Available: http://timesofindia.indiatimes.com/city/mumbai/Thane-lakes-high-on-metal-contentStudy/articleshow/9547159.cms
[21]  W. Salomons, U. Forstner, ‘Metals in the Hydrocycle’, Springer-Verlag, New York (1984)
[22]  Lee, B. G., Griscom, S. B., Lee, J. S., Choi, H. J., Koh, C. H., Luoma, S. N., and Fisher, N. S., 2000, Influence of dietary uptake and reactive sulfides on metal availability from aquatic sediments., Science, 287(5451), 282-284
[23]  Weston, D. P., and Maraya, K. A., 2002, Predicting bioavailability and bioaccumulation with in vitro digestive fluid extraction., Environ Toxicol. Chem., 21(5), 962-967
[24]  Adams, W. J., Kimerle, R. A., and Barnett J. W., Jr, 1992, Sediment quality: and aquatic life assessment., Environ. Sci. Technol., 26(10), 1864-1875
[25]  Maher, W., Batley, G. E., and Lawrence,I., 1999, Assessing the health of sediment ecosystems: use of chemical measurements., Freshw Biol., 41(2),361-372
[26]  Kennicutt, M. C., Wade, T. L., Presley, B. J., Requejo, A. G., Brooks, J. M., and Denoux, G. J., 1994, Sediment contaminants in Casci Bay, Maine: inventories, sources and potential for biological impacts. Environ. Sci. Technol. 28(1), 1-15
[27]  Singare, P. U., Lokhande, R. S., and Pathak, P. P., 2010, Soil Pollution along Kalwa Bridge at Thane Creek of Maharashtra, India, J. Environmental Protection, 1(1), 121-128
[28]  Johansson, J., and Rasmussen, L., 1977, Retrospective study (1944–1976) of heavy metals in the epiphyte Pterogonium gracile collected from one phorophyte., Bryologist, 80(3), 625-629
[29]  Chen, M., and Ma, L. Q. 2001, Comparison of three aqua regia digestion methods for twenty florida soils. Soil Science Society of American Journal, 65(2), 491-499
[30]  Rainwater, F. H., and Thatcher, L. L., 1960, Methods for Collection and Analysis of Water Samples, U.S. Geol. Surv. Water Supply Papers, 1454, 1
[31]  E. Brown, M. W. Skougstad, M. J. Fishman, ‘Methods for collection and analysis of water samples for dissolved minerals and gases’, Techniques of Water Resources Investigations of the U. S. Geological Survey, 160, Book 5, Chapter A1 (1970)
[32]  Indian Council of Medical Research (ICMR) Manual of Standards of Quality for Drinking Water Supplies (1975)
[33]  J. D. Hem, Study and Interpretation of Chemical Characteristics of Natural Water, 3rd ed., U. S. Geological Survey, Washington (1985)
[34]  American Public Health Association (APHA) Standard Methods for Estimation of Water and Wastewater, 19th ed., American Water Works Association, Water environment Federation, Washington (1995)
[35]  A. K. De, Environmental Chemistry, pp.232–272, 4th ed., New Age International (P)Ltd., New Delhi, India (2002)
[36]  J. W. Moore, S. Ramamoorthy, Heavy Metals in Natural Waters: Applied Monitorin and Impact Assessment, pp.28–246, Springer-Verlag, New York (1984)
[37]  Ember, L., 1975, The spectra of cancer, Environ. Sci. Tech., 9(13), 1116-1121
[38]  Centre for Ecological Sciences, IISc Environmental HandBook – Documentation on Monitoring and Evaluating Environmental Impacts, Compendium of Environmental Standards, Vol. 3, Indian Institute of Science, Bangalore, (2001).[Online].Available: http://wgbis.ces.iisc.ernet.in/energy/HC270799/HDL/ENV/START.HTM
[39]  P. S. Sindhu, Environmental Chemistry, pp.75–243, 1st ed., New Age International (P) Ltd.,New Delhi (2002)
[40]  N. S. Tiwana, N. Jerath, G. Singh, M. Ravleen, (Eds.) ‘Heavy metal pollution in Punjab rivers’, in Newsletter Environmental Information System (ENVIS), Vol. 3, No. 1, pp.3–7, Punjab State Council for Science and Technology, India (2005)
[41]  Sunderman, F. W., 1959, Nickel poisoining carcinogenesis in rats exposed to nickel carbonyl., Arch. Ind., 20(1), 36-41
[42]  D. Langmuir, Aqueous Environmental Chemistry, Prentice-Hall, Inc., New Jersey, (1997)
[43]  Indian Standard Institute (ISI), Drinking Water Specification (1991)
[44]  World Health Organization (WHO), Guidelines for Drinking Water Quality. Health Criteria and other Supporting Information, 1, WHO, Geneva, (1984)
[45]  Bhujangaiah, N. S., and Nayak, P. V., 2005, Study of ground water quality in and around Shimoga City, Karnataka., J. Ind. Coun. Chem., 22(1), 42-47
[46]  L. V. Wilcox, Classification and Use of Irrigation Waters, 966, US Dept. of Agricultural Science, Grc. (1955)