David Ofori, Ebenezer Armah, Bridget Marfo, Isaac Kofi Otchere, Andrew Quansah, Kwabena Amoako Kyeremeh
Department of Computer and Electrical Engineering, University of Energy and Natural Resources, Sunyani, Ghana
Correspondence to: Isaac Kofi Otchere, Department of Computer and Electrical Engineering, University of Energy and Natural Resources, Sunyani, Ghana.
| Email: |  |
Copyright © 2023 The Author(s). Published by Scientific & Academic Publishing.
This work is licensed under the Creative Commons Attribution International License (CC BY).
http://creativecommons.org/licenses/by/4.0/

Abstract
This research is conducted to develop a machine learning based model to monitor the temperature rise of power transformer as a means of monitoring it health status. To achieve this, a real time data was collected from a power transformer, where the data was used to determine whether the power transformer is aging or there is a rise in its temperature parameters. The health status and aging of the power transformer is predicted with the use of trained and tested machine learning models. Different machine learning algorithms like support vector machine, linear regression and the K-Nearest algorithm are trained with an existing dataset of the power transformer taken over a period with sensors. The dataset consists of parameters like top-oil temperature, ambient temperature and hot-spot temperature causing internal fault within the power transformers and thereby increasing the aging rate of the transformer. Amongst the algorithms used, random forest regression gave the highest accuracy of 94.4% in both training and testing. This excellent performance was then employed to predict the health status of the transformer and also how its parameters affect the power transformer’s aging.
Keywords:
Ambient temperature, Hot-spot temperature, Machine learning, Power transformer, Top-oil temperature
Cite this paper: David Ofori, Ebenezer Armah, Bridget Marfo, Isaac Kofi Otchere, Andrew Quansah, Kwabena Amoako Kyeremeh, Predictive Health Monitoring of a Power Transformer Using Machine Learning, Electrical and Electronic Engineering, Vol. 13 No. 1, 2023, pp. 12-18. doi: 10.5923/j.eee.20231301.03.
1. Introduction
In recent years, transient growth in our urban areas has led to an increase in the demand of electricity. To meet such demand, there is a need to improve upon the three major electricity supply chain; generation, transmission and distribution. Power transformer is a critical component used in transmitting electrical energy between the generation station and the distribution station. To supply a stable and uninterrupted power supply, the health condition of the transformer needs to be monitored [1]. Variable loading and weather conditions usually deteriorate the health condition and life span of a power transformer. This device undergoes mechanical stress, thermal stress and electrical stress. Manufacturers sometimes specify the life cycle of a power transformer and most power transformers which are in use are approaching the end of their life cycle. It is therefore important to know their lifetime so as to avoid breakdown or shut down during service time. In recent years, predictive analysis has become the common tool for analyzing data to predict future events [2]. Some of the common aalgorithms deployed for predictive analysis includes linear regression, K-nearest neighbour, Support Vector Machine (SVM), decision tree, random forest, Naives Bayes, Artificial Neural Network, gradient boosting etc [3-7]. Studies has been carried out to predict and classify faults present in transformers by using these various machine-learning algorithms.Controlling the health status of a power transformer is an important task to ensure the reliability of electrical power supply and also to optimize it economical and maintenance cost over their lifetime. Different parts of the power transformer including core windings, tanks, cooling system, oil and on-load tap changer are exposed to electrical faults and environmental conditions. External fault arises due to events happening to the static device (power transformer) which are unreliable, unpredictable and unpreventable. Whereas the internal fault that arises due to events occurring inside the transformer can be prevented by putting in place continuous testing and maintenance practices. Internal faults deteriorate the insulation breakdown of power transformers. Internal faults happens when there are over flux, over voltage and over current within the windings which leads to temperature rise of the power transformer causing excessive mechanical stress [8]. Faults are categorised depending on the severity, occurrence and detection after it has occurred [9]. Different sensors are mounted on a typical oil-filled transformer in the presence or absence of clamping looseness on the windings. These sensors monitor and obtain data to conduct transformer fault analysis. Because vibration varies depending on the sensor placement on the transformer tank, installing a sensor in a specific spot was considered as seen in [8-9]. Authors in [10] conducted further studies by employing dissolve gas analysis technique to diagnose transformer internal faults. The formation of dangerous and undesirable gases occurs as dielectric insulating materials and other elements inside the transformer ages [11].This work aims to analyze and predict the health status of a power transformer using different machine learning algorithms. The models are then simulated using Jupyter notebooks where a power transformer datasets are trained and tested. It is worth noting that this paper focused on temperature rise that caused age reduction in power transformers. Multiple algorithms such as Random Forest, Decision Tree, K-Nearest Neighbor (KNN) are employed in this work to predict the health status of a power transformer due to it higher predictive accuracy as compared to other reviewed works which gave lower accuracies of less than 90%. The algorithm with highest accuracy was used to predict the anomaly rise in temperatures where hot-spot temperature was considered a major contributing factor in transformer aging. The hot-spot temperature was used in determining the aging rate of power transformers in this work since it is one of the major factors that contribute to transformer aging.The work is organized as follows: Integration of machine learning in predicting the health of a power transformer is introduced in Section I. Section II explains the machine learning workflow. A description of methodology and the test system are highlighted in Section III and IV respectively. The next section discusses how the various machine algorithms performed during the training and testing. The last session draws conclusion of the work done.
2. Machine Learning Workflow
Machine learning pipeline as shown in Figure 1 is an end-to-end design that coordinates the machine learning model for defect prediction in order to provide the required output. The machine learning pipeline comprises of multiple sequential steps that performs everything from data extraction and preprocessing through model training and deployment. The machine learning models for predictive analysis algorithm employed in this paper are described below [12]: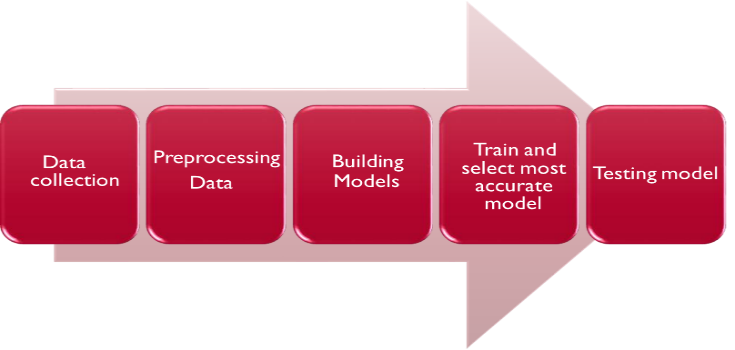 | Figure 1. Diagram for the workflow |
2.1. Linear Regression
A statistical model that assesses the relationship between two or more variables is known as linear regression. Linear regression is a supervised machine learning approach with a continuous and constant slope projected output. Linear regression can be classified into two categories.• Simple Linear Regression: This is written in typical slope-intercept form as seen in equation 1, with m and c being the variables that the system will learn to provide the best accurate predictions. Where x and y respectively denote the input data and the forecast. | (1) |
• Multiple Linear Regression: Multiple linear regression involves the use of more than one independent variables in the training process. The dependent variables in power transformer health monitoring includes ambient temperature, hot-spot temperature and top-oil temperature. This is modelled as: 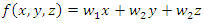 | (2) |
where: x,y,z = dependent variables. w1, w2, w3 = weights or gradients corresponding to each feature respectively.f = output to be predicted
2.2. Support Vector Regression
The regression problem is a generalization of the classification problem in which the model returns a continuous-valued output rather than a finite-valued result. In order to minimize error, support vector regression (SVR) models both linear and nonlinear regression problems by creating a boundary as depicted in (3).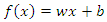 | (3) |
Where:f(x) = the dependent variable of x x = the feature to be used in prediction w = the weight of the regression line b = the bias
2.3. Decision Tree
A decision tree is a versatile machine learning technique that can handle classification, regression and multi-output problems. The decision tree is a tree structure that looks like a flowchart, with each internal node representing a test on an attribute with each branch representing a test outcome and each leaf node (terminal node) holding a class label [12].
2.4. Random Forest
A random forest is a collection of decision trees that have been trained using the bagging method with the maximum sample size set to the size of the training set. Instead of constructing a bagging classifier and handing it in a decision tree classifier, a random forest classifier which is more efficient, practical and tailored for it is possible to employ decision trees. When developing trees, the random forest algorithm adds extra randomization.
2.5. K-Nearest Neighbor
The K-Nearest Neighbors (KNN) algorithm is a data categorization approach that estimates the likelihood that a data point will belong to one of two groups based on which data points are closest to it. The supervised machine learning algorithm KNN is used to address classification and regression problems. However, it is mostly employed to solve categorization difficulties. The KNN algorithm is mostly used as a classifier. The KNNs categorization is straightforward to learn and implement. It works well when the data points are well defined or non-linear.
3. Predicting Power Transformer Health Status Workflow
3.1. Collection of Transformer Dataset
Data gathering is the first step in training a machine learning model. Predicting the health of a power transformer necessitates the collection of historical data about the power transformer. In order to create representative models for the system, historical monitoring data from an appropriate time frame must be available. This information was obtained from IEEE data-pot [13].A total of 16703 data-point was collected from IEEE data-port. The data-point includes ambient temperature, load-factor (in pu), hot-spot temperature, top-oil temperature and datetime. The ambient temperature is the external temperature of the transformer whereas the hot-spot temperature is the winding temperature. The top-oil temperature is the temperature of the oil and the datetime shows the time and date the temperature values were recording. Increase in ambient temperature causes a rise in top-oil temperature thereby affecting the hot-spot temperature. These dependent variables are the main factors that affect the aging of a transformer.
3.2. Preprocessing of Dataset
The next stage is processing the transformer data-pot by converting raw data into a format that machine learning algorithms can understand and interpret. Raw data or real-time data may have errors and inconsistencies, but it is frequently incomplete and lacks a consistent format. This means that if you train the model with dirty data, the outcomes will be poor. Thus, using clean data produces an excellent result.
3.3. Splitting of Data
In every machine learning project, dataset must be segmented. For the two-part partition of data, one portion is utilized for testing and the other half is used for training the model. The training dataset is used to train and build the models and also to compare different model performance. The test dataset is utilized after the training is done. The training and testing data are compared to see whether the final model performs properly. This predictive analysis dataset is separated into two parts; 80% of the dataset used for training and the remaining 20% utilized for testing.
3.4. Building of Models
The algorithm used to train machine learning models is crucial in its development. As a result, choosing a poor algorithm will have a significant impact on the model's performance during the training and testing stages. There are numerous machine-learning algorithms to choose from, each with advantages and disadvantages. As a result, after examining the sort of machine learning algorithm to be utilized and the task at hand, the optimal method that will provide a desirable output must be chosen.
3.5. Model Training
Following the selection of each algorithm, the model is trained on a subset of the dataset. Datasets are divided into two categories; training and testing. The Scikit-Learn Python package splits the data into training and testing. When applied to the test data, the dataset is utilized to train the model to provide the desired output. The data is normalized to produce a better result. Normalization of the data-point allows the machine-learning algorithm to readily grasp the trend and produce desirable results. During the training of a machine-learning model, scenarios frequently arise in which some model hyper parameter on the method used must be further trained to generate the best optimal outcome.
3.6. Model Testing
As previously noted, separating datasets into training and testing sets is critical in every successful machine learning project. During the data splitting process, a number of tests are run on the hold-out set. Model testing is accomplished by comparing model predictions to actual results on the test set. The Root Mean Squared Error (RMSE) and the Mean Absolute Error (MAE) performance metrics were employed in evaluating the model’s performance on a test set. It is critical to use these performance metrics to check for model problems. The model scores range from 0 to 100, providing a clear picture of how the model performed. The technical details of the performance measures on all models will be described in the following section with a graphical representation. After the model has been tested and approved, it is deployed on a dataset recorded from a power transformer.
4. Test System Model
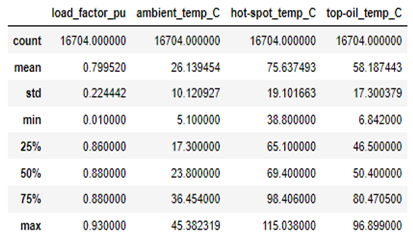
A total of 16704 data points were collected from the IEEE data-port from January to March and September to October. Data cleaning and the removal of some extraneous columns were required while preparing the data for machine learning. As shown in Table 1, the highest ambient temperature, hot-spot temperature, and top-oil temperature recorded were 45.38°C, 115.038°C, and 96.899°C respectively. The lowest ambient temperature, hot-spot temperature and top-oil temperature recorded were 5.1°C, 38.8°C and 6.842°C respectively. The ambient temperature, hotspot temperature, and top-oil temperature are all of interest. Table 1. Transformer Temperature Dataset
 |
| |
|
4.1. Data Visualization
Data was collected at 10-minute intervals to demonstrate the link between the features employed. The relationship between the features (ambient temperature, hot-stop temperature and top-oil temperature) and how they relate during the 10-minute intervals is shown in figure 2. Where the ambient temperature refers to the temperature of the transformer's surroundings, the hot-spot temperature refers to the temperature of a specific location on the transformer winding and the top-oil temperature refers to the temperature of the transformer's oil.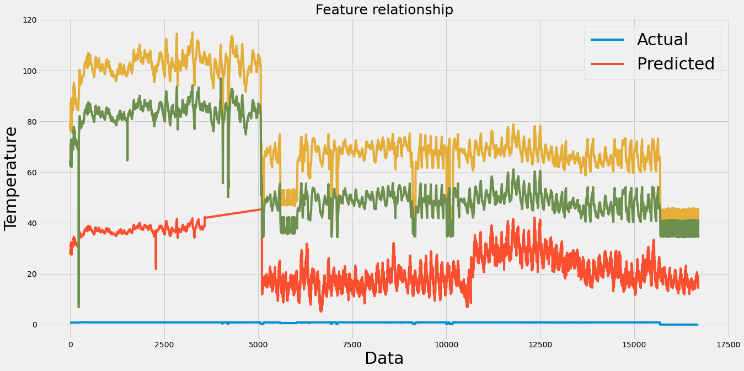 | Figure 2. Feature relationship |
As seen in Fig. 2, an increase in ambient temperature induces an increase in both the hot-spot temperature and the top-oil temperature. The ambient temperature of the transformer has a significant impact on hotspot and winding temperature. Power transformers are rated for a maximum ambient temperature of 40°C and an average ambient temperature of 30°C in a 24-hour period according to the IEEE C57.12.00-2000 std [14]. This standard further says that when operating at rated conditions, an average winding rise of 55°C above ambient temperature shall not be exceeded. The maximum hottest-spot winding temperature cannot be more than 80°C above ambient. Furthermore, IEEE C57.91-1995 std states that the maximum hottest-spot winding temperature should not exceed 110°C in a continuous ambient temperature of 30°C [14].
4.2. Power Transformer Hotspot Temperature Model
Increase in transformer load current will result in a further increase in power losses which will eventually lead to a drastic rise in the winding and oil temperatures of the power transformer [14,15]. The hotspot temperature rise is computed as a first order exponential response from the initial to the final temperature state [16].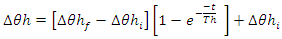 | (4) |
Where: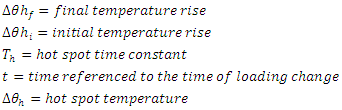 The first order differential equation outcome is given as:
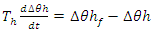 | (5) |
 | (6) |
Where  is the rated hot spot temperature rise over the top oil temperature. m is the empirically derived exponent that depends on the cooling method.The power transformer winding hotspot time constant is computed as below:
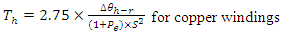 | (7) |
Where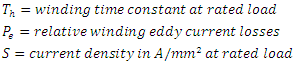 Finally, the hotspot temperature is then calculated by adding the ambient temperature to the top oil rise temperature rise and the hot spot temperature rise as depicted below:
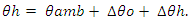 | (8) |
where: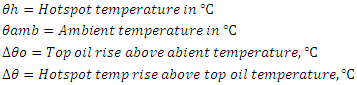
5. Model Training and Evaluation
5.1. Model Training and Evaluation
In this section, assessment and evaluation of each training models were analyzed. The performance of the five different models employed in this paper in training the power transformer dataset were presented below:
5.2. Linear Regression Performance
The linear regression model produced 87.56% accuracy on the training dataset and 87.84% accuracy on the testing dataset as seen in figure 3. As a result, the linear regression has a poor accuracy for both training and testing. This is also an indication that it is not a viable model because it cannot discover patterns in the training dataset. The RMSE is another evaluation metric used with the Linear Regression Algorithm. On the testing data, this algorithm produced a RMSE of 0.0765. On the test data, the mean absolute error was 0.0396. The model was eliminated due to its low accuracy for training and testing respectively.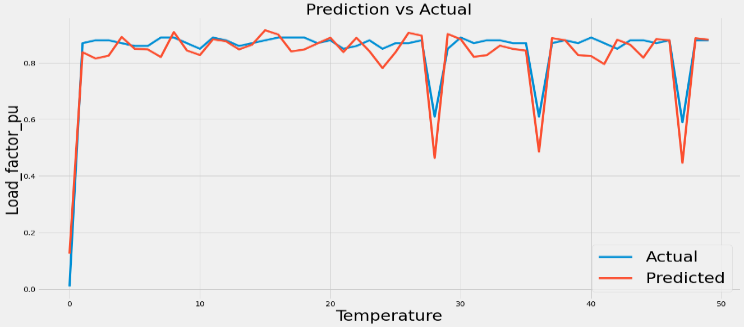 | Figure 3. Prediction vs Actual for Linear Regression Model |
5.3. Support Vector Regression
The support vector regression algorithm was trained on the same dataset. The SVM was evaluated using the score and RMSE. The training dataset received a score of 88.49%, whereas the test dataset received a score of 87.67%. The RMSE for the testing was also 0.077. Using the mean absolute error, which is beneficial for immediately assessing the accuracy of the test dataset, yielded an error rate of 0.054. Fig. 4 depicts the prediction using the SVM. This model was eliminated because it had a low score in both testing and training.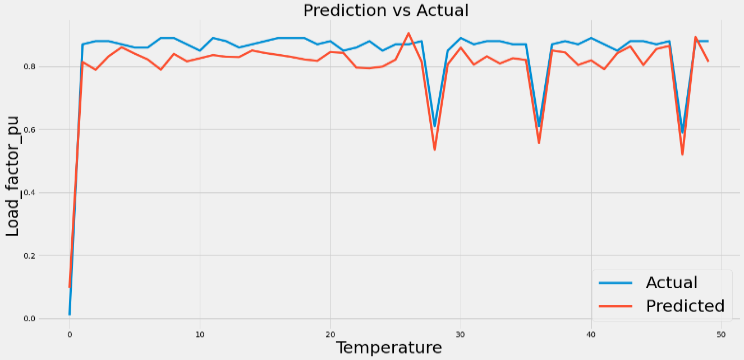 | Figure 4. Model Prediction vs Actual for SVM |
5.4. Decision Tree Regression
Using the decision tree approach for prediction, the score on this algorithm appears to be good, with a score of 99.9% on the training dataset and 91.39% on the test dataset. On the test data, it produced a RMSE of 0.064 and a mean absolute error of 0.016%. The decision tree regression worked well during testing but overfitted during training. As a result, this model was abandoned in this work. 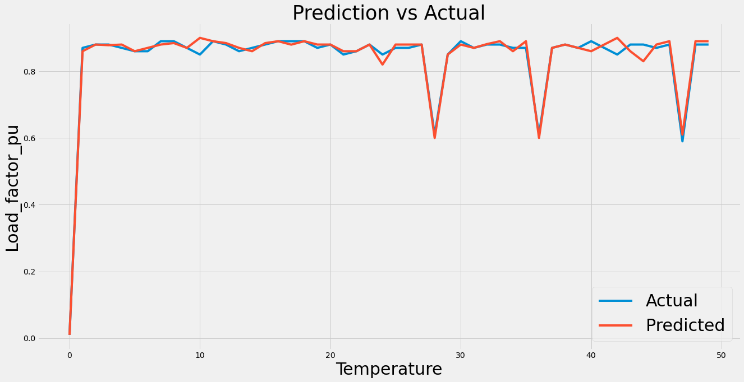 | Figure 5. Model Prediction vs Actual using decision tree |
5.5. K-Neighbor Regression
The dataset was used to test the K-neighbor regression model performance. The KNN algorithm scored 95.6% on training and 92.8% on testing. On the test data, the RMSE was 0.0587, and the mean absolute error was 0.0169. The performance of the K-neighbor approach on the dataset is depicted in Fig. 6. Because there were no obvious deviations as seen in simulation result of Figure 6, the KNN model performed well on the dataset training and testing.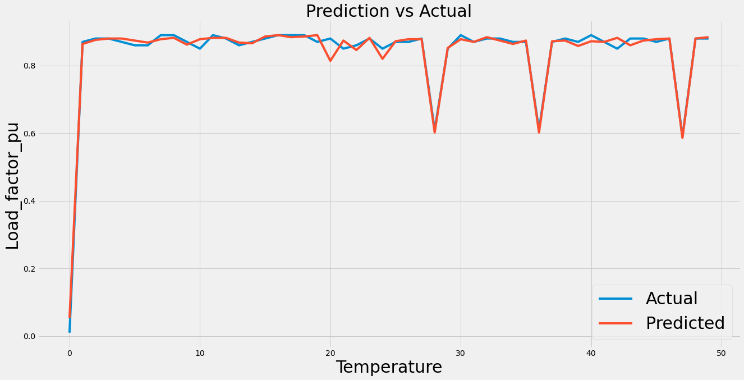 | Figure 6. Model Prediction vs Actual using K-neighbor |
5.6. Random Forest Regression
By constructing more decision trees, the Random Forest Regression (RFR) technique is known to be effective in combating overfitting as seen in the decision tree regression performance. An accuracy score of 99.1% for training and 94.4% for testing was produced as depicted in figure 7 while analyzing the model based on this technique. This shows that overfitting problem has been reduced and the model performed very well using test dataset, with accuracy near to the training set score. On testing, the RFR had a RMSE of 0.0518 and a mean absolute error of 0.0149. This shows an excellent performance and the model best fit to forecast the health status of the power transformer.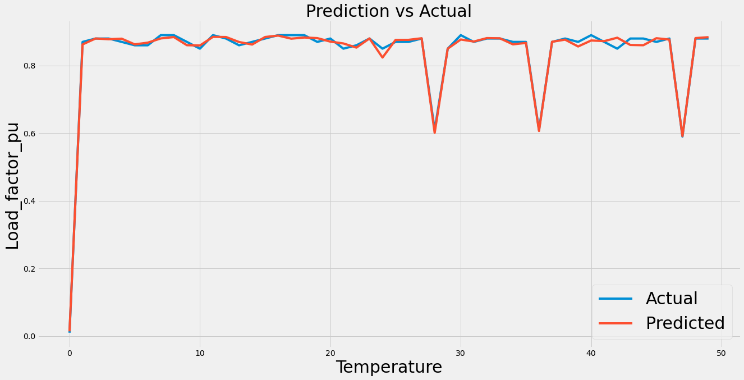 | Figure 7. Model Prediction vs Actual using random forest |
A comparison performance in each of the machine learning models for predicting the health status of a power transformer is shown in figure 8. The result shows an excellent performance for the Random Forest Regression model in forecasting the health status of the power transformer. 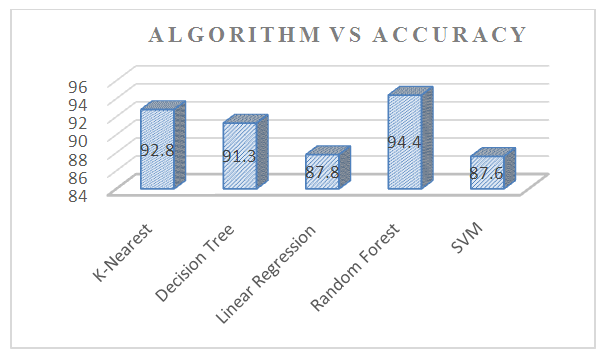 | Figure 8. Machine Learning algorithm vs Test Accuracies |
5.7. The Aging Acceleration Factor of Power Transformer
The thermal analysis's localized temperature results are used to anticipate the transformer's lifetime using the aging acceleration factor Faa. Based on Arrhenius' equation, the aging rate of paper insulation is defined as: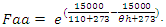 | (9) |
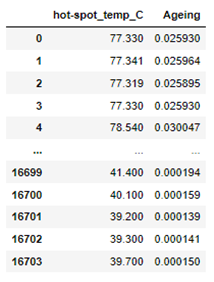
Where h is the temperature in degrees Celsius suitable for transformers having a temperature rating of 110°C, the hot spot temperature is the sum of the ambient temperature and the estimated temperature rise in this empirical model. The temperature rise is affected by the transformer's loading status. A total of 16703 data-point was collected from IEEE data-port. The hot-spot temperature and transformer aging accelerating factor as seen in Table 2 computed using equation 9. Table 2. Hot-spot temperature & Aging acceleration factor
 |
| |
|
As shown in Fig. 9, the hot-spot temperature rises, so does the aging of the power transformer. As the aging acceleration factor grows, the transformer lifespan also increases. | Figure 9. A curve of  vs Hot-spot temperature vs Hot-spot temperature |
6. Conclusions
Machine learning techniques are proven beneficial in power transformer predictive monitoring. They are used as one of the most promising methodologies for planning energy generation, market-planning activities, distribution network development planning and monitoring distribution and generation network performance. In this paper, the performance of predictive health monitoring models was examined based on Decision Tree, Random Forest, Support Vector Regression, Linear Regression, and K-Neighbor Regression on data from the IEEE data-port using 16,703 data point. The random forest regression model was used in the predictive analysis because it provided a higher testing accuracy of 94.4% on the data. It was discovered that the life span of a power transformer is affected by the hot-spot temperature. As the hot-spot temperature rises, so does the power transformer's aging acceleration factor, hence reducing the overall performance and aging of the power transformer.For future developments, the model can be deployed on edge devices. This will increase the application's interaction with the user. Other machine learning tools such as neural network, gradient boosting algorithm, deep learning and reinforcement learning may also bring additional benefits.
References
| [1] | B. Sudha, L.S. Praveen, A. Vadde, “Classification of faults in distribution transformer using machine learning”, Volume 58, Part 1, 2022, Pages 616-622, ISSN 2214-7853, DOI /10.1016. |
| [2] | Q. T Tran, K. Davies , L. Roose. “Machine learning for assessing the service transformer health using an energy monitor device”. IOSR Journal of Electrical and Electronics Engineering (IOSR-JEEE) e-ISSN: 2278-1676, p-ISSN: 2320-3331, Volume 15, Issue 6 Ser. I (Nov. – Dec. 2020). |
| [3] | L. Paulhiac, and R. Desquiens. “Dynamic Thermal Model for Oil Directed Air Forced Power Transformers with Cooling Stage Representation”, 2022, 3145003, IEEE: DOI 10.1109/TPWRD.. |
| [4] | Rajeshkanna, A., Preetha, V., & Arunesh, K. (2019, March). “Experimental Analysis of Machine Learning Algorithm in Classification Task of Mobile Network Provides in Virudhunagar district”. (pp. 335-343). International Conference on E-business and Telecommunication. |
| [5] | Q. Fan, Fei Yu, M. Xuan, “Transformer fault diagnosis method based on improved whale optimization algorithm to optimize support vector machine”, Volume 7, Supplement 7, 2021, Pages 856-866, ISSN 2352-4847, DOI/10.1016. |
| [6] | Z.Xing, Y.He, J.Chen, X.Wang, B. Du,"Health evaluation of power transformer using deep learning neural network", Electric Power Systems Research,Volume 215, Part B, 2023, 109016, ISSN 0378-7796. |
| [7] | D. Saravanan, A. Hasan, A. Singh, H. Mansoor and R. N. Shaw, "Fault Prediction of Transformer Using Machine Learning and DGA," 2020 IEEE International Conference on Computing, Power and Communication Technologies (GUCON), Greater Noida, India, 2020, pp. 1-5, doi: 10.1109. |
| [8] | T. A. Kawady, H. E. Labna and A. E. -M. I. Taalab, "A practical winding fault detector for power transformers," 2008 12th International Middle-East Power System Conference, Aswan, Egypt, 2008, pp. 130-135, doi: 10.1109/MEPCON.2008.4562318. |
| [9] | Ali Reza Abbasi, Fault detection and diagnosis in power transformers: a comprehensive review and classification of publications and methods, Electric Power Systems Research, Volume 209, 2022, 107990, ISSN 0378-7796. DOI/10.1016. |
| [10] | IEEE guide for the interpretation of Gases Generated in oil-immersed transformer, ANSI/ IEEE std. C57. 104. 2016, 1-130. |
| [11] | T Jan, R Afzal, and A. Z Khan, “Transformer Failures, Causes & Impact”, International Conference Data Mining, Civil and Mechanical Engineering, Indonesia, February 2015. |
| [12] | S. Ray, "A Quick Review of Machine Learning Algorithms," 2019 International Conference on Machine Learning, Big Data, Cloud and Parallel Computing (COMITCon), Faridabad, India, 2019, pp. 35-39, doi: 10.1109/COMITCon.2019.8862451. |
| [13] | https://ieee-dataport.org/documents/operational-data-oil-directed-air-forced-transformers. |
| [14] | "IEEE Guide for Determination of Maximum Winding Temperature Rise in Liquid-Filled Transformers", in IEEE Std 1538-2000, vol., no., pp.1-28, 31 July 2000, doi: 10.1109/IEEESTD.2000.91904. |
| [15] | CIGRE working group 09 of study committee 12. Direct measurement of the hot-spot temperature of transformers. CIGRE ELECTRA; 1990. |
| [16] | Elmoudi A. Evaluation of power system harmonic effects on transformers. Ph.D. Thesis. Helsinki University of Technology; 2006. |

 Abstract
 Reference
 Full-Text PDF
 Full-text HTML