Isaac Kofi Otchere, Desmond Ampofo, Joshua Dantuo, Emmanuel Asuming Frimpong
Department of Computer and Electrical Engineering, University of Energy and Natural Resources, Sunyani-Ghana
Correspondence to: Isaac Kofi Otchere, Department of Computer and Electrical Engineering, University of Energy and Natural Resources, Sunyani-Ghana.
| Email: |  |
Copyright © 2023 The Author(s). Published by Scientific & Academic Publishing.
This work is licensed under the Creative Commons Attribution International License (CC BY).
http://creativecommons.org/licenses/by/4.0/

Abstract
The high penetration of distributed generation (DG) in distribution grids may lead to voltage levels rising beyond acceptable limits. Consequently, the introduction of distributed generation affects the planning, dispatching and operation of traditional voltage regulation devices such as capacitor banks and on-load tap changing transformers. There is therefore the need to investigate the optimal placement, sizing and operation of these voltage regulation devices in systems which have DGs. In this paper, the impact of DGs on the performance of capacitor banks and on-load tap changing transformers (OLTC) is assessed through the use of a genetic algorithm optimization technique. The study system used was the 16-bus United Kingdom generic distribution test system. Results of the study show that the presence of DGs in distribution networks positively impact on the performance of voltage regulating devices in terms of loss reduction and voltage profile improvement. However, DGs may increase the amount of shunt compensation required.
Keywords:
Capacitor Bank, Distributed Generation, Genetic Algorithm, On-load Tap Changer, Power Loss, Voltage profile
Cite this paper: Isaac Kofi Otchere, Desmond Ampofo, Joshua Dantuo, Emmanuel Asuming Frimpong, The Influence of Voltage Regulation Devices Based Distributed Generation in Distribution Networks, Electrical and Electronic Engineering, Vol. 13 No. 1, 2023, pp. 1-5. doi: 10.5923/j.eee.20231301.01.
1. Introduction
Traditionally, distribution networks are equipped with capacitor banks (CAPs) and on-load tap changing transformers (OLTC) for voltage regulation purposes. This is to reduce power losses on the network as well as improve the voltage profile across the network. The location and size of these equipment are critical for effective operation. Consequently, several works have investigated the siting and sizing of capacitor banks through the use of various optimization techniques. Particle swarm optimization (PSO) was used to find the optimal sizes of capacitors by minimizing power loss on distribution network in [1,2]. Also, in [3,4], genetic algorithm was used for optimal shunt capacitor placement. However, the works did not consider the effect of integration of distributed energy sources on the performance of the proposed techniques. Integration of distributed generations (DGs) into distribution networks is likely to affect the dispatching and operation of capacitor banks since they create voltage rise problems. Thus there is a need to access the impact of DGs on voltage regulating devices like on-load tap-changing transformers and capacitor banks.As such, some authors have extended the optimization analysis to include DGs by simultaneously optimizing both the sizing and siting of DGs and capacitor banks. A memetic optimization algorithm (MA) was used for simultaneous sizing of DGs and capacitors to improve voltage stability in [5,6]. A combined approach of PSO and GA was used for optimal sizing and siting of DGs and capacitor banks to improve voltage profile and minimize power losses in [7]. The challenge with optimal location of DGs has been established not to only depend on technical factors such as losses or voltage profile but on other non-technical factors such as land availability [8]. Also, the owner/consumer of the DG decides where to connect to the grid, with the distribution system operator having little or no control. Hence, there is the need to study the effect of DG location on optimal siting and sizing of capacitor banks as well as OLTC settings. This work aimed to analyze the impact of varying location of DGs on the siting and sizing of capacitor banks as well as OLTC settings using the genetic algorithm. The test system used was the 16-bus United Kingdom generic system. Voltage profile and loss minimization were the two objective functions considered in the study.This paper contributes to the influence of a distributed generation, capacitor banks and OLTC transformer voltage regulating devices in a distribution network. The optimal location, sizing and the operation of these devices on a distribution network is also determined to maintain the stability of the power system.The work is organized as follows: Integration of DG into distributed network is introduced in Section I. Section III explains the problem formulation of the impact of varying location of DGs and sizing of capacitor banks and OLTC settings using the genetic algorithm. A brief description of the test system is highlighted in Section IV. The rest of the sections discusses in detail various scenario of the behavior of the distribution network with the integration of various size and location of DGs, capacitor banks and OLTC transformer. The last session draws conclusion of the work done.
2. Problem Formulation
Genetic algorithm is a heuristic optimization tool based on natural selection. It has been widely used as power system optimization tool because of its success rate in finding the optimal solution for non-linear mathematical problems [7]. The objective functions and system constraints used in this work are outlined as follows:
2.1. Objective Functions
Voltage profile: The minimization of voltage profile index (Vp) is defined as shown in (1). | (1) |
where  is the voltage at the nth node.Power losses: The total loss on the network is defined in (2) where
  and
and  are the active and reactive power losses respectively.
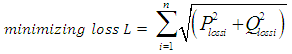 | (2) |
System Constraints: The optimization was done considering the following constraints: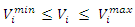 | (3) |
where  and
and  is the voltage magnitude and angle at bus
  The voltage constraint is to keep the voltage within the upper and lower voltage regulatory limit.
 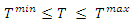 | (4) |
where  is the tap setting of the OLTC. This constraint makes sure that tap limits are not exceeded.
 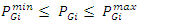 | (5) |
 | (6) |
 | (7) |
where  and
and  are the active power and reactive power generated at bus i.
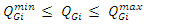
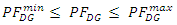
  , is the power factor of DG. Constraints (5), (6), and (7) ensure that the operational limits of the DG are not violated.
  | (8) |
 | (9) |
where  and
and  are the conductance and susceptance between buses
  and
and  and
and  are the active and reactive load demands at bus
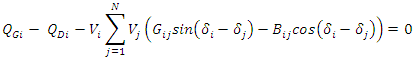
  Equations (8) and (9) are the power balance equations which ensure that the power generated at a bus is equal the load plus the losses.
3. Test System and Simulation
The distribution network employed in this work is the 16-bus UKGD test system. It is a 33kV distribution network fed from a 132kV supply network. It combines both long, medium, and short transmission lines with the shortest and longest lengths being 2.055km and 32.79 km. The total system active power base load is 38.16MW and the base reactive power load is 7.74MVAR. The voltage regulator between buses 8 and 9 was modeled as an autotransformer with tap changers. The taps of the transformers and voltage regulator transformers’ taps and voltage regulators for each distribution line together with other relevant data were obtained from [9]. The 16-bus United Kingdom distribution test system used is this work is shown in Figure 1. The system has two OLTCs. 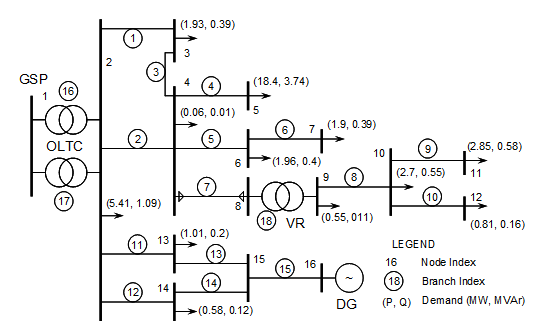 | Figure 1. The 16 bus UKGDS test system |
The test system was modeled using the MATPOWER software [10]. The following were done in the modeling: 1) The minimum and maximum allowable bus voltages were 0.94pu and 1.06pu respectively in accordance with the UK grid code. Furthermore, the maximum and minimum apparent power limit of the substation generator, thermal rating of each transmission line, maximum and minimum tap limits for the OLTCs were all in accordance with the UK Grid code [11].2) The work considered three different DG locations. The selected locations were bus 5, bus 11 and bus 16 representing load center, tail end of a long feeder and a rural area respectively. The basis of the location is to provide the best test scenarios to experience voltage rise and voltage drop on the network, thus the DGs were placed at the heaviest bus (bus 5), the furthest bus away from the substation (bus 11), and bus with the lightest load (bus 16). The DG are modeled as negative load and only supplied active power, thus operating at unity power factor [12,13].3) The size of DG was selected to be 58.2MW, 14.2MW and 3.9MW at bus 5, bus 11 and bus 16 respectively. The ratings were based on the work of authors of [8] who determined the maximum DG capacity at buses 11, 16, and 5.4) Only one CAP bank was considered in the analysis. The maximum amount of shunt compensation was 80% of the total reactive power demand on the network. 5) Bus 1 was made the slack bus while buses 2 and 9 were made PV buses. Newton Raphson method was used for the power flow analysis.The flowchart for the GA used is shown in Figure 2. The number of generations and population size for the GA was selected to be 100 and 20 respectively. Two sample simulation cases are presented.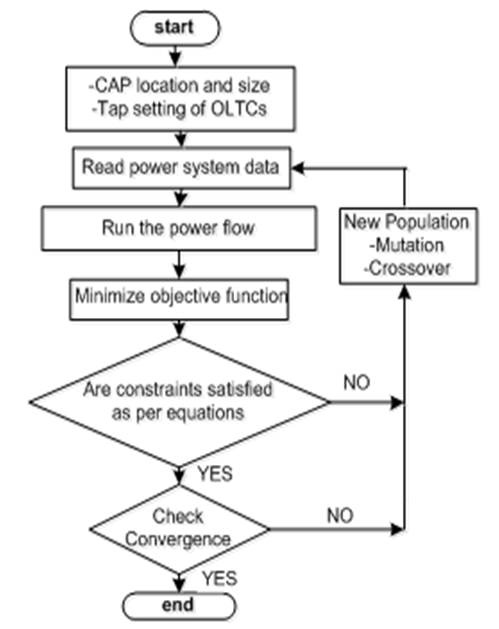 | Figure 2. Flowchart of used genetic algorithm |
Case 1: The objective function for this case is voltage profile improvement as a single objective. The optimal placement and sizing for capacitor banks and setting for OLTC was carried out with four sub-cases, which are; with no DG integrated, DG at bus 5, DG at bus 11 and DG at bus 16. Each of these sub-cases considered the DG operating at both unity power factor and with reactive power capability.Case 2: For this case, the objective function was loss minimization as a single objective subject to system constraints. The sub-cases in case 1 were also considered in case 2.
4. Result and Discussion
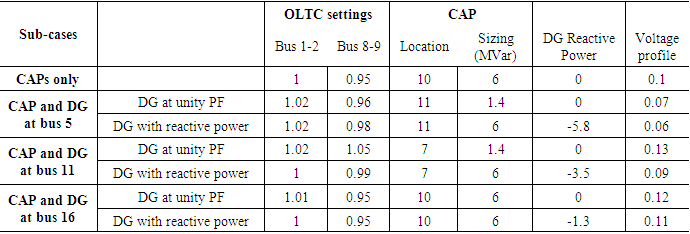
Case 1: Table 1 below shows the results obtained for case 1.Table 1. Simulation results for case 1
 |
| |
|
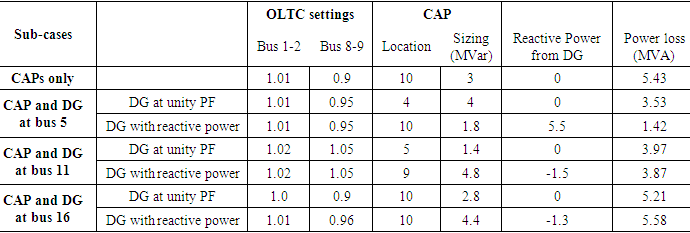
The results presented in Table 1 show that the DGs affect CAPs location and sizing. For CAPs only, the location of the capacitor was bus 10. When the availability of DG was considered through placement at bus 11, bus 7 and bus 10, the capacitor bank was placed at bus 5, bus 11 and bus 16 respectively. Also, in order to improve the voltage profile, the most cost effective location for DG was at the load center (bus 5) and tail end of the feeder (bus 11) because of the minimum amount of shunt compensation (1.4 MVar) that was recorded as compared to the case when the DG was placed at an isolated rural area (bus 16) when the DGs were operating at unity power factor. Furthermore, when the DGs operated with reactive power capability, it did not affect the CAP location as compared to the cases when operating at unity power factor. However, all the DGs were operating in inductive mode (absorbing reactive power from the grid) in order to improve the voltage profile of the network. This increased the amount of shunt compensation required to its maximum value. Subsequently, there was overall improvement in the voltage profile as compared to the cases when the DG was operating at unity power factor in all the three cases. Thus, DGs operating at reactive power capability will result in an improved voltage profile at a cost; which is an increase in required shunt compensation. The results further reveal that best voltage profile was achieved when the DG was placed at bus 5 (load center). The worst voltage profile was recorded with the DG at bus 11. Also, OLTC setting at the substation (between bus 1 and bus 2) in all the cases experienced little movement as compared to the one between bus 8 and bus 9, which experienced significant movement in all the analysis.Case 2: The results for case 2 are presented in Table 2. There was a general reduction in the losses on the network with the presence of DG as compared to the case when there was the capacitor bank. The only exception was when the DG (with reactive power capability) was located at bus 16. When the capacitor bank was optimized alone, the optimal location was at bus 10. However, with the placement of DG at buses 5, 11 and 16, the optimal capacitor bank location was found to be at buses 4, 5 and 10 respectively. For power loss minimization, the capacitor bank location changed when the DG operated with reactive power capability as compared to the unity power factor case. The only exception was when the DG was located at bus 16. In both cases, the optimal capacitor bank was at bus 10. Thus DG mode of operation does affect the optimal location of capacitor banks. Also the best value for losses was achieved when the DG was located at bus 5 with 1.42MVar and 3.98MVar for unity power factor and with reactive power capability respectively. Table 2. Simulation results for case 2
 |
| |
|
5. Conclusions
This paper explored the effect of voltage regulating devices (i.e. Capacitor banks, OLTC) in distribution network having Distributed Generation using the 16-bus UKGD test system as case study. The impact of DGs on the optimal location of capacitor banks was also investigated considering two objective functions namely minimizing of power losses and voltage profile improvement. The results reveal that for voltage profile improvement, DG mode of operation does not affect the location of capacitor banks. Also, DGs operating with reactive power capability result in an improvement in voltage profile across a network. For loss minimization, the mode of operation of DG has an impact on the capacitor bank location. The best result for loss minimization is achieved when the DG is located at the load center. Also, DG location has little impact on the setting of substation OLTC as compared to OLTC located along a distribution feeder. Best performance from voltage regulating devices in terms of losses and voltage profile improvement is obtained when DG is located at the load center while the worst performance is recorded when DG is located at an isolated area.
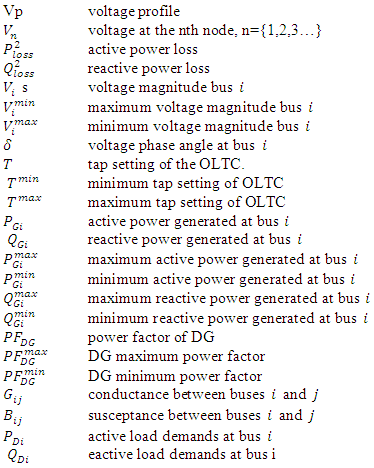
Nomenclature
References
| [1] | K. Prakash and M. Sydulu, "Particle Swarm Optimization Based Capacitor Placement on Radial Distribution Systems," 2007 IEEE Power Engineering Society General Meeting, 2007, pp. 1-5, doi: 10.1109/PES.2007.386149. |
| [2] | D. Neupane, B. Poudel, N. Khatri, D. Yadav, and D. Khadka “Optimal Capacitor Placement using Particle Swarm Optimisation (PSO): A Case Study in 33kV Distribution System”, (2020). |
| [3] | A. Kalyuzhny, G. Levitin, D. Elmakis, H. Ben-Haim, “System approach to shunt capacitor allocation in radial distribution systems”, Electric Power Systems Research, (56) 1, 2000, Pages 51-60, doi.org/10.1016/S0378-7796(00)00106-1. |
| [4] | S. Nawaz, A. Jain and A. Gupta, "A novel technique for optimal allocation of capacitors in radial distribution system," (2017), 4th International Conference on Power, Control & Embedded Systems (ICPCES), 2017, pp. 1-5, doi: 10.1109/ICPCES.2017.8117622 |
| [5] | S.M. Sajjadi, M.R. Haghifam, J. Salehi, “Simultaneous placement of distributed generation and capacitors in distribution networks considering voltage stability index”, International Journal of Electrical Power & Energy Systems, Vol 46, 2013, Pages 366-375, doi.org/10.1016/j.ijepes.2012.10.027. |
| [6] | A. Rahiminejad, A. Aranizadeh, and B. Vahidi, "Simultaneous distributed generation and capacitor placement and sizing in radial distribution system considering reactive power market", Journal of Renewable and Sustainable. Energy 6, 043-124 (2014). https://doi.org/10.1063/1.4893431. |
| [7] | M.H. Moradi, M. Abedini,“A combination of genetic algorithm and particle swarm optimization for optimal DG location and sizing in distribution systems”, International Journal of Electrical Power & Energy Systems, 3(1), 2012, Page 66-74, doi.org/10.1016/j.ijepes.2011.08.023. |
| [8] | Al Kaabi, S. S., Zeineldin, H. H., & Khadkikar, V. (2014). Planning active distribution networks considering multi-DG configurations. IEEE Transactions on Power Systems, 29(2), 785-793. |
| [9] | Generation, D. Sustainable Electrical Energy Centre. United Kingdom Generic Distribution System (UK GDS). Retrieved from http://www. sedg. ac. Uk. |
| [10] | MATPOWER. http://www.pserc.cornell.edu/matpower. |
| [11] | United Kingdom Generic Distribution System (UKGDS). [Online].Available: http://www.sedg.ac.uk. |
| [12] | A.F.A. Kadir, T. Khatib, and W. Elmenreich, “Integrating Photovoltaic Systems in Power System: Power Quality Impacts and Optimal Planning Challenges”, in International Journal of Photoenergy, vol. 2014, pp. 1- 7, 2014. |
| [13] | R.A. Shayani, M.G. de Oliveira, R. S. Camargos, L. P. de Andrade, R. Spandre, and C. da Mota, “Penetration Limit of Photovoltaic Distributed Generation – Case Study for the Italian Embassy in Brasília”, in Proc. Clean Electrical Power. |

 Abstract
 Reference
 Full-Text PDF
 Full-text HTML