-
Paper Information
- Paper Submission
-
Journal Information
- About This Journal
- Editorial Board
- Current Issue
- Archive
- Author Guidelines
- Contact Us
Electrical and Electronic Engineering
p-ISSN: 2162-9455 e-ISSN: 2162-8459
2021; 11(1): 13-21
doi:10.5923/j.eee.20211101.03
Received: Aug. 17, 2021; Accepted: Sep. 6, 2021; Published: Sep. 15, 2021

Modeling and Energy Management Strategy in a Grid Connected Solar PV System
 Abstract
 Reference
 Full-Text PDF
 Full-text HTML
Elias Apiyo1, Christopher Maina1, Livingstone Ngoo2
1Department of Electrical & Electronics Engineering, Murang’a University of Technology, Murang’a, Kenya
2Department of Electrical & Telecommunications Engineering, Multimedia University of Technology, Nairobi, Kenya
Correspondence to: Elias Apiyo, Department of Electrical & Electronics Engineering, Murang’a University of Technology, Murang’a, Kenya.
| Email: |  |
Copyright © 2021 The Author(s). Published by Scientific & Academic Publishing.
This work is licensed under the Creative Commons Attribution International License (CC BY).
http://creativecommons.org/licenses/by/4.0/

Electric power is substantially an important resource in the modern world. With the increase in demand for electric energy, there is a need to search for alternative energy sources because conventional resources are being exhausted. This results to significant increase in electricity cost. Use of green energy as an alternative to the conventional generation of electricity is currently on the rise. This study presented modeling and energy management of a grid-connected solar PV system aimed at reducing electric energy cost to an ordinary consumer in Kenya. Electricity cost is one of the top expenses of the ordinary consumer. The study was conducted at Murang’a University of Technology, Kenya. MATLAB Simulink software was used for modeling. Arduino Uno was chosen to perform real-time energy management that involved switching between the micro sources and the grid when the supply current from the micro sources dropped below a defined threshold value. Arduino microcontroller used instantaneous method of calculating current, voltage and power. An Application Programming Interface was proposed for forecasting energy production from the solar Photovoltaic system. Significant savings in electric energy bill was expected with the proper application of the Energy Management System in a smart house. The prototype developed managed to disconnect the loads one at a time and reconnect the particular load to the grid whenever the supply current from the micro sources dropped below the specified threshold value.
Keywords: Energy Management System, Micro Grid, Solar Photovoltaic, Weather Forecasting
Cite this paper: Elias Apiyo, Christopher Maina, Livingstone Ngoo, Modeling and Energy Management Strategy in a Grid Connected Solar PV System, Electrical and Electronic Engineering, Vol. 11 No. 1, 2021, pp. 13-21. doi: 10.5923/j.eee.20211101.03.
Article Outline
1. Introduction
- Use of green energy as an alternative to the generation of electricity from conventional resources is currently on the rise. This is because the conventional resources are being exhausted. Government policies, technological innovation and the drive to address climate change have also made renewable energy gain global popularity [1]. Micro-grid system is a technology which provides a solution to green energy production [2]. Micro-Grid is defined in [3] as a low tension distribution network consisting of distributed generations, storage devices and loads which are flexible. The Micro-Grid system is controllable, provides reliable energy, is localized, minimizes environmental pollution and is able to reduce grid electricity needs [4]. The commonly installed distributed generations are solar Photo-Voltaic (PV) and wind turbine systems. Solar energy depends on changing weather conditions i.e. irradiance and temperature. Batteries are therefore used to store surplus energy generated from PV panels and later on releases this energy when the necessary environmental parameters drop in their value. This reduces the unreliability problem of the solar energy. Over a span of time, several studies have been conducted on Micro Grids. The study conducted by [5] modelled and simulated a 400 kW grid-connected solar PV but did not use energy storage system (ESS). Energy management between the micro source and the utility grid was not performed in this study. Authors in [6] used deep-cycle lead acid batteries to model ESS for their 3.4 MW grid connected PV-battery hybrid system for Adamawa State and addressed synchronization issues. The study did not address energy management between the grid and the micro sources. Researchers in [2] provided literature review on modeling and simulation of a micro grid system that can be operated in both islanding and in grid-connected mode. Researchers in [7] applied Arduino-based Energy Management System to control the power flow in the Micro Grid consisting of renewable energy resources like wind, solar, battery and utility grid with a view to minimise carbon dioxide emission to the atmosphere and to reduce energy consumption rate. In [8], detailed literature review on the Micro Grid EMSs is provided classifying them into various categories. Researchers in [9] applied MATLAB/Simulink software to perform Optimal Energy Management System in a grid-connected PV system. A load management system for a home in Pakistan was simulated using Proteus software in [10] to automatically reduce the load during peak hours. The recent research conducted in [11] modelled and simulated Energy Management in a smart Micro Grid the possibility of using Electric Vehicle as energy storage system consisting of a battery, Power Electronic converters and electric motor was studied. The simulation was validated using prototype hardware. Modeling of components and Energy Management Systems in Micro-Grids have been studied mostly by simulations. Real-time studies are rare. This study aims to model a grid-connected solar PV system, apply energy management system to manage its energy sources in real-time application and estimate the next day energy production from the solar PV. The study implements modeling of Micro-Grid components using MATLAB Simulink software because of its effectiveness and manages its energy resources in real-time using Arduino-based microcontroller. The aim of this energy management is to reduce the grid electricity need and create dependency on the renewable energy resources. Real and laboratorial hardware equipment are used in the study. One Solar PV, battery energy storage system, medium rating consumer loads connected in parallel and the utility grid are the main micro grid players in this study. The energy demanded by the loads is supplied from either the micro-source or the utility grid. An Application Programming Interface (API) is proposed for forecasting the next day energy production from the solar PV. The API provides short-term (7 days ahead) forecast weather data necessary for economic dispatch. The API is a new technology to related literature about the solar PV systems. It is based on Google search to predict solar radiation parameters. The API allows for easy download of live and forecast solar radiation data [12]. It can be integrated with other systems which require live and forecast solar radiation data. Research conducted in [13] analyzed and validated Solcast’s global performance on hourly Ghi data. The study provided a comprehensive validation highlighting the strengths and weaknesses of the data. The organization of the remaining parts of the study are as follows: Section 2 presents the methodology used, section 3 presents results and analysis of the study and section 4 provides conclusion and future work of the study.
2. Materials & Methods
2.1. Micro Grid Modelling
- Various components of the Micro Grid system are modeled using MATLAB/Simulink software.
2.1.1. PV Modelling
- The single diode model of figure 1 was chosen for modelling the PV system.
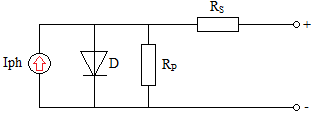 | Figure 1. Single diode model of a solar cell |
 | (1) |
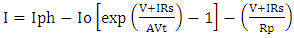
 | Figure 2. Simulink model of a solar PV |
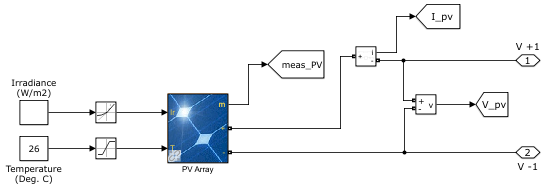
2.1.2. Inverter Modelling
- This model uses single phase IGBT bridge as its converter to operate as unidirectional from the PV panel and the battery to the A.C load. Voltage, phase and frequency are harmonized to the grid. The Simulink model of an inverter is shown in figure 3.
 | Figure 3. Simulink model of an Inverter |
2.1.3. Battery Modelling
- A more convenient generic model of a Lead-Acid battery was used in this modeling because of its low cost and availability. A Basic model as described in [14] is given by equation (2) for charging (+) and discharging (-) states.
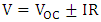 | (2) |
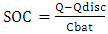 | (3) |
 | Figure 4. Simulink model of a Lead-Acid battery |
2.1.4. Load Modelling
- For the simulation to execute faster, the best-form mathematical model by MathWorks was chosen. The load was modeled as resistor-inductor-capacitor series circuit. The voltage drop across this circuit is expressed as in equation (4).
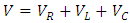 | (4) |
2.1.5. Grid Modelling
- The utility grid was modeled as a 240 V single phase voltage source supplied from a typical 11 kV distribution feeder. The user-defined built-in MATLAB/Simulink model was used in the modelling.
2.1.6. Complete Model of the Micro Grid System
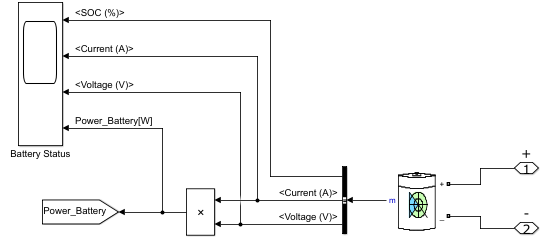
- The complete MATLAB/Simulink model of the grid connected solar PV system is shown in figure 5. The controls and scopes are modeled to enable energy management and monitoring of the Micro Grid.
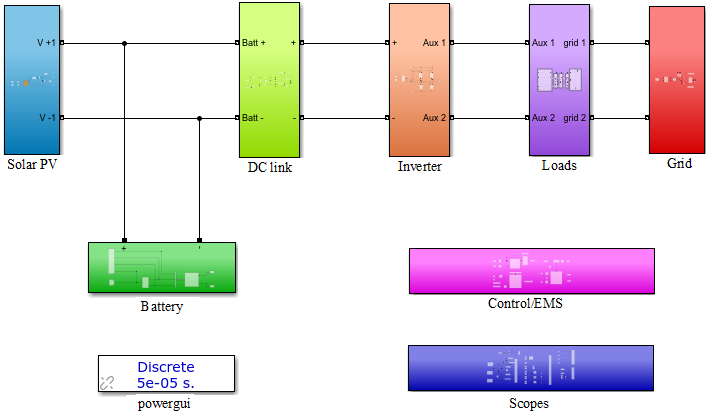 | Figure 5. Simulink model of the Micro-Grid system |
2.2. Micro Grid Energy Management
- Arduino microcontroller was selected to perform the energy management between the micro sources and the utility grid by switching between the two and meeting the thresh hold limits specified in the study. Arduino is an electronic building platform that consists of a programmable physical circuit board and accompanying software [15]. The programmable circuit is the microcontroller and the accompanying software is the Integrated Development Environment (IDE). The IDE is used to write and upload code to Arduino module. As in [16], the preassembled Arduino module costs less, has extensible hardware, Arduino software is easy to use and the software can be extended by advanced programming.According to research conducted in [17], the solar energy produced within a time frame of one day can be estimated using equation (5).
 | (5) |
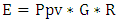
 | Figure 6. Proposed Micro-Grid system |
2.2.1. Hardware Components
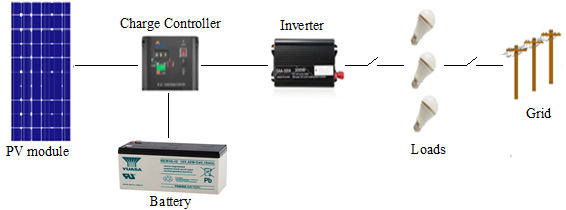
- The components used for the prototype development included one Yingli Energy (China) YL210P-26b solar panel, 150 AH Lead-Acid battery, 5A charge controller, 300 W power inverter, 240 V power supply bench socket outlet, three light bulbs of 100 W, 60 W and 40 W used as home consumer loads, Arduino Uno development board, 5A current sensor ACS712, voltage sensor detection module, Arduino-compatible 250Vac 10A 12Vdc 8-channel relay interface board, Arduino-compatible AC250V 10A DC12V 4-channel relay interface board, 16x2 LCD display with 12 channel interface, bread board and jumpers. Arduino Uno board architecture is shown in figure 7.
 | Figure 7. Arduino Uno board architecture |
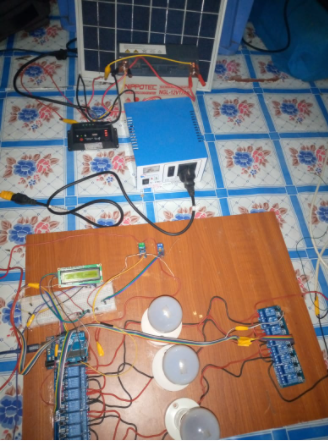 | Figure 8. Snapshot of assembled hardware components |
2.2.2. Software Code
- The sequence and flow of energy, as implemented by Arduino Uno, is represented by the flowchart given in figure 9.
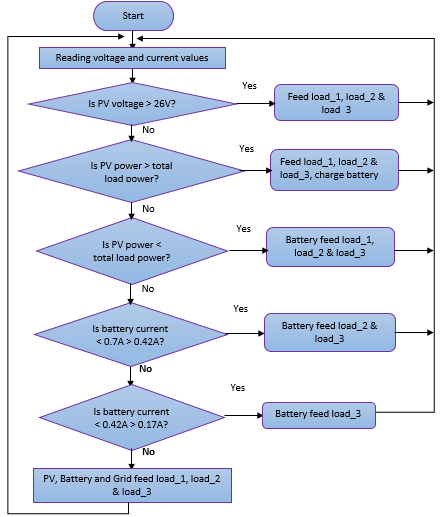 | Figure 9. Flow chart showing the sequence and flow of energy |
2.3. API Forecast
- In [18], the API is an intermediary software allowing two applications to communicate with each other. When an API is used in a mobile device, it connects to the internet and sends data to a server. The server interprets the data performing the necessary actions and sends it back to the mobile device. The API then presents the information to the user in a readable form. Various sequential steps are followed to retrieve live and forecast solar data from the API Toolkit. The user browses internet on a networked mobile device like laptop or smart cell phone at https://solcast.com. The first-time user registers as a student or a research institution or a commercial entity in order to use the API Toolkit. Once registered, the user accesses the data commensurable with the free credit allowance provided. A registered user can access live and forecast data specific to the location of interest around the world. The user navigates to world API-Radiation which provides solar irradiance data at 30-minute resolution and selects Solar Radiation. The user selects or inserts location of interest in address search provided then proceeds to download data directly as CSV by selecting type Forecast. Finally get solar irradiation data in excel spreadsheet. Desired data variables for download include Global Horizontal Irradiance (Ghi), Direct Normal Irradiance (Dni), Diffuse Horizontal Irradiance (Dhi), air temperature and cloud opacity. Forecasts are made for the next 7 days. The API has the advantage of global coverage covering the five major continents of the world. Ground measured data in the study area was done using the standard instruments (irradiance meter and mercury thermometer for instantaneous irradiance and temperature respectively) for a period of three months.
3. Results and Analysis
3.1. Micro Grid Modelling and Simulation
- The model of figure 5 was simulated using MATLAB/Simulink software with the powergui simulation type set to discrete. Environmental weather conditions i.e. solar radiation and temperature were considered while modelling the solar PV. The model was simulated at 800 W/m2 and 26°C measured irradiance and temperature respectively at East African time 2021-08-02T12:00:00Z. The simulation results of loads, battery and grid switching are shown in figure 10.
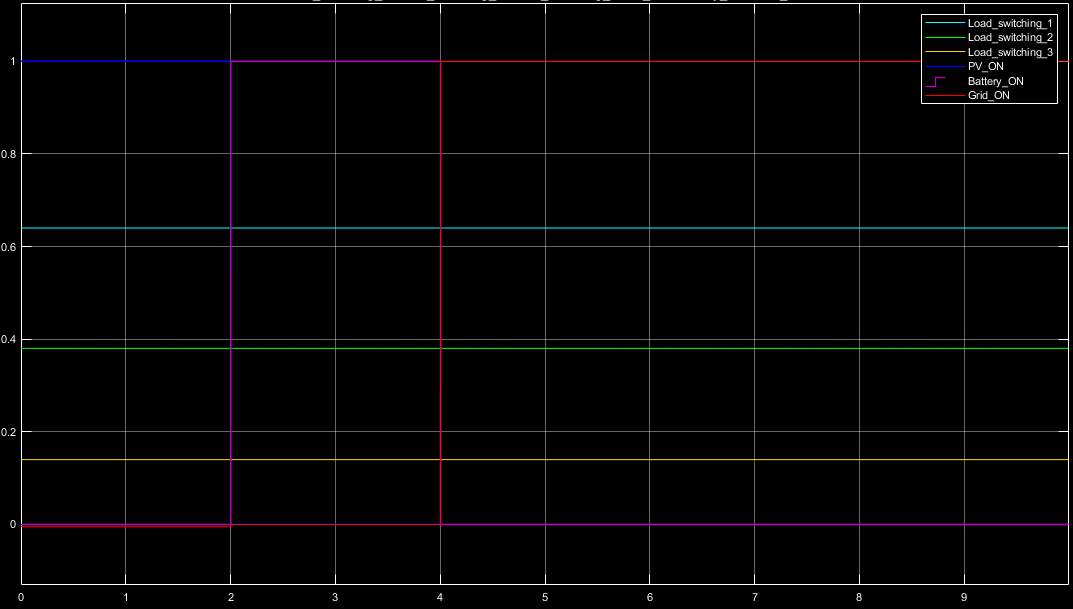 | Figure 10. Simulation results of switching load_1, load_2 load_3, PV, Battery and Grid |
3.2. Real-time Energy Management
- The Arduino programming code used for sensors reading is shown in figure 11. The Code for calculating instantaneous voltage and current is shown in figure 12.
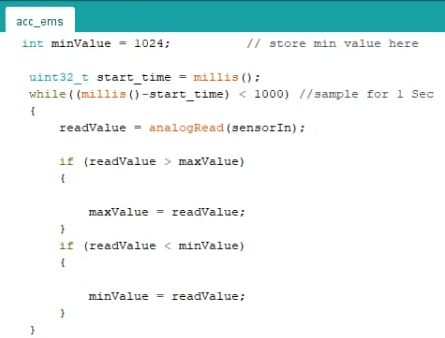 | Figure 11. Code for sensor reading |
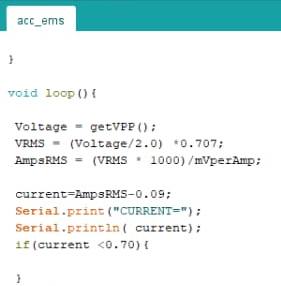 | Figure 12. Code for calculating instantaneous voltage and current |
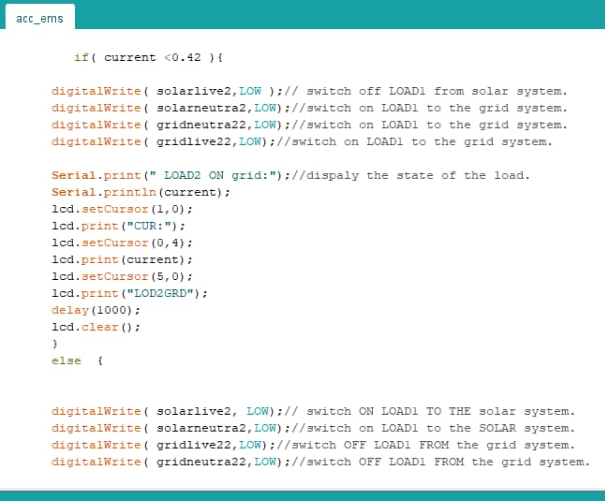 | Figure 13. Code for switching load_1 and load_2 between the micro sources and the grid |
3.3. Energy Generation Forecasting
- The Live and Forecasts weather data collected from the API-Radiation of the study area on 2nd August 2021 at T05:30:00Z is shown graphically in figure 14 and its summary in table 1.
|
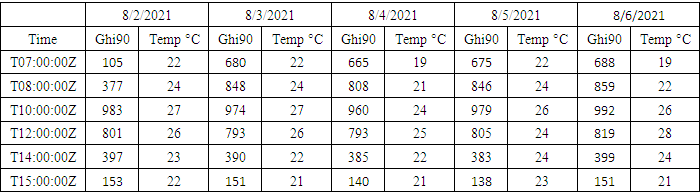
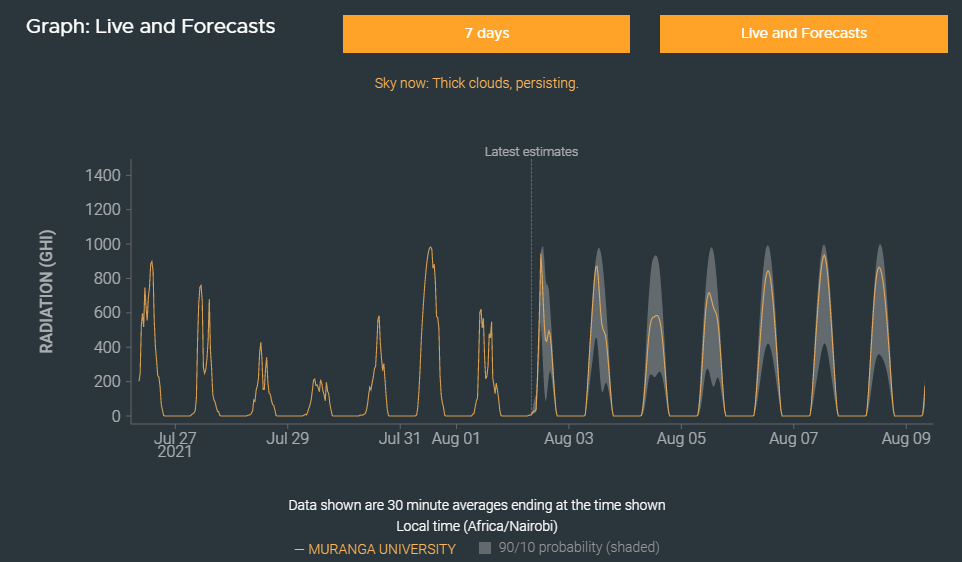 | Figure 14. Live and Forecast solar radiation of Murang’a University of Technology |
4. Conclusions and Future Work
- This study discussed Micro-Grid modeling, real- time Energy Management and a weather forecast for the study area. Experimental setup with Arduino board was made and an API used as web interface. Based on the simulation results, the system was able to manage the energy balance between the micro sources and the grid. The prototype built managed to switch the loads automatically between the micro sources and the grid without going beyond the set thresh hold limits of the study. The API made possible forecast of weather data which led to the prediction of next day power production from solar PV system. The measured weather data at the study area used as simulation inputs were validated by comparing with those obtained by the Solcast’s API-Radiation forecast of the same area. This work is beneficial to people in remote areas. It is economical as creates dependency on renewable energy resources and also modifies the usage habit of the consumer. The system implemented in this study is a prototype developed to control three bulbs only. The future direction of this work is to predict consumer behavior using artificial intelligence and integrate it with the appliance automation studied for load scheduling.
ACKNOWLEDGMENT
- The authors gratefully thanked Job Masika Wekesa of Murang’a University of Technology and Yusuf Abdiwali Mohamed of the Technical University of Kenya for their humble contribution in developing this research.