M. Firoz Pervez 1, Abdul Al Mortuza 1, Md. Hasan Ali 2, M. A. Sayid Haque 1, H. K. Ghosh 1, Mahbubul Hoq 1
1Institute of Electronics, Atomic Energy Research Establishment, Savar, Dhaka, Bangladesh
2Department of Electronics and Telecommunication Engineering, Begum Rokeya University, Rangpur, Bangladesh
Correspondence to: M. Firoz Pervez , Institute of Electronics, Atomic Energy Research Establishment, Savar, Dhaka, Bangladesh.
| Email: |  |
Copyright © 2016 Scientific & Academic Publishing. All Rights Reserved.
This work is licensed under the Creative Commons Attribution International License (CC BY).
http://creativecommons.org/licenses/by/4.0/

Abstract
A Conventional progressive scanning method can be used for small and medium size LED (Light Emitting Diode) dot-matrix display board. However, this conventional scanning approach has some drawbacks such as flicker, lower luminous intensity, requirement of high speed LED driver, etc., specifically for large LED dot-matrix display. This paper brings forward the analysis of scanning method clarifying the limitations of conventional scanning approach with several critical design parameters. After that, a new scanning approach, congenial to both small and large has been proposed to get over these limitations. Eventually, simulation of the mathematical models of the two methods are expounded that points to the vital design parameters constraints along with the advantages of new method. The mathematical models and analyses give understanding of system design approach to the LED driver circuit designers to estimate various design parameters.
Keywords:
LED dot-matrix display, LED text display board, LED dot-matrix scanning, Flicker
Cite this paper: M. Firoz Pervez , Abdul Al Mortuza , Md. Hasan Ali , M. A. Sayid Haque , H. K. Ghosh , Mahbubul Hoq , Novel Scanning Technique for LED Dot-Matrix Display to Reduce Flicker, Electrical and Electronic Engineering, Vol. 6 No. 2, 2016, pp. 19-24. doi: 10.5923/j.eee.20160602.01.
1. Introduction
LED displays stand for modernization of city and digital era, and catch on for its versatile application with several advantages. Compared to other traditional display technology (such as neon light, fluorescent tubes, LCD display) it has benefits like high brightness, wide viewing angle, less energy consumption, long service life, wet resistance, hot cold resistance, etc. with reasonable cost [1-4]. This type of display, carved out by segmented or dot-matrix LEDs, can be of small, medium or large size.Small segmented and dot-matrix displays are widely used in electronic and medical equipment, instrument panels [5-7]. Though segmentation type displays require simple driving circuit, dot-matrix displays can generate characters of better shape [8] of different languages [4, 6] facilitating both static and animated image-pattern [9]. Due to charm for animated effect such as scrolling and flying, advertisement and emergency information can be got about through LED dot-matrix display in public places like railway station, hospital, airport, bus stand, restaurant, super shop, bank, stock exchange etc. [3, 4, 9-12].An LED dot-matrix display consists of LED panel and driving circuit for row and column with simple x-y addressing [13, 14]. Three sorts of scanning approaches namely row scan, column scan, and dot-by-dot are usually employed [15] in large display that calls for complex controller and extensive processing power. In present day, single chip microcontroller (SCM), CPLD (Complex Programmable Logic Device), FPGA (Field-Programmable Gate Array) along with other digital IC’s such as latch, shift register etc. are used to simplify the data transmission path and control signal path in PCB layout [16, 17].To design a large LED dot-matrix display, we need to deal with flickering and lower luminous intensity issues. As the size of display becomes larger, to reduce perception of flickering, frame rate and refresh rate need to be increased in both horizontal and vertical directions [21, 22]. However, in spite of using fast digital controller, delays associated with other digital circuitry, stray inductance and capacitance restrict to the number of LED dot-matrix modules and refresh rate. More to the point, in case of large display board, data and control signal need to be transmitted long distance via long wire having large inductance. In addition to that, parallel long wires exhibit stray capacitance and mutual inductance generating interference effect between parallel wires that is bar to high speed data transmission in normal configuration. At the same time, though using data latch and shift register with driver to control column states facilitates reducing number of connecting wires between controller and display board, it also introduces delay and increases processing time [17]. For these reasons, as the number of modules increases, frame rate of the display becomes lower having more perception of flicker. As luminous intensity of LEDs is directly counted on the current flow through the LEDs, lower frame rate (with same switch-on time) reduces overall luminous intensity [15, 17].This paper comes forward with the mathematical model and analysis of traditional progressive scanning approach in view of several parameters including screen frame rate, refresh rate, number of modules, luminous intensity, etc. Afterwards, it presents mathematical model of a new scanning approach adapted from interlaced scanning method. Finally, the two models have been simulated illustrating that the new approach can solve many design constraints facilitating less perception of flicker, use of more number of modules (i.e. construction of larger display), higher refresh rate, better luminous intensity, etc.
2. LED Dot-Matrix
A dot-matrix is comprised of rows and columns where each LED is connected with a specific row and a specific column. For a particular row and column, anode of each LED associated with that row is electrically connected and cathode of each LED related to that column is connected together as well (as shown in Fig. 1) or vice-versa. Matrix modules with simple x-y addressing of each pixel are cascaded to create a large LED display that can be extended to both horizontal and vertical direction (as shown in Fig. 2). In order to reduce the number of I/O lines between the controller and dot-matrix display, multiplexing technique is employed where each column of the display is driven on and off in quick succession (column scanning) according to the data present in the rows to have a complete frame. In case of row scanning data are fed to column and LED-drive control signal are fed to row.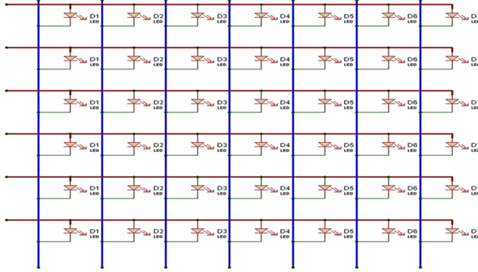 | Figure 1. LED dot-matrix array arrangement. This type of array can be made of any number of rows and columns as required |
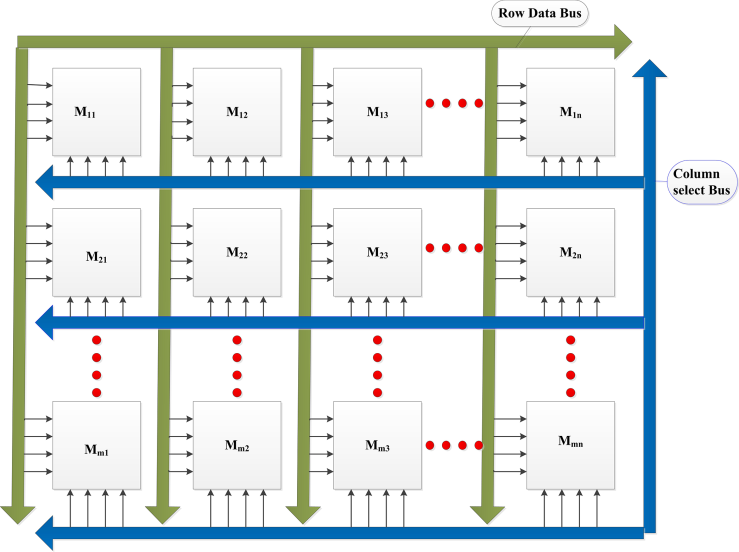 | Figure 2. Typical LED dot-matrix cascading for two-dimensional large display where horizontal line consists of n modules and vertical line consists of M modules. Row Data Bus is connected in parallel with all modules and Column Select Bus is used for sending control signal to drive the particular columns at specific time, or vice-versa |
If the column update time is fast enough to scan the frame on and on within brief period of time, then due to build in optical integrator known as persistence of vision gives the illusion that all the columns are switched-on at the same time. To create a steady pattern, scanning rate is generally set to be higher than 50Hz [15].
3. Delay Associated with Driver Circuit
Every digital circuit performance is affected by delay associated with that circuitry. Skew, source latency, network latency, path delay, propagation delay, gate delay, etc. are the kinds of delays commonly appeared. Sources of these delays in the LED driver including transmission path, data latch, column driver, controller, etc. play critical role in overall circuit performance. To make the mathematical model and the digital circuit to work properly, we need to consider those delays with worst possible event.Usually in large LED display, each matrix module is associated with a data-latch (as shown in Fig. 3). Data are sent from controller to latch through a transmission path (wires). To simplify delay consequence, here data-setup-time, output disable time, output enable time, net delay etc. have been considered together as a combined delay named as “data-setup-time”.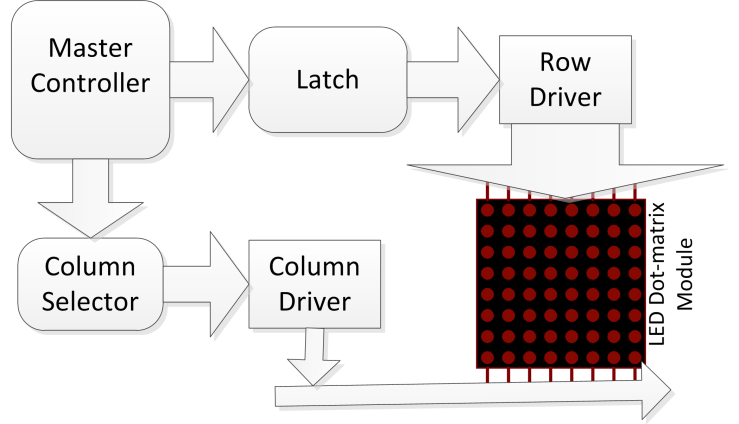 | Figure 3. Typical interfacing with controller, data-latch, row-driver, column-selector, column-driver and single matrix-module that can be easily extended for multiple cascade-modules |
Similarly, column driving related to propagation delay, turn-on delay, turn-off delay, etc. have been considered together in terms of “column-setup-time”. Furthermore, though the controller itself needs some processing time to settle I/O pins, here, zero latency between consecutive signals from the controller and zero rise and fall time for LED are assumed with a view to simplifying model.
4. Mathematical Modelling of Scanning Method
4.1. Conventional Scanning Method (Case-1)
In traditional method, adjacent columns are driven by turn according to data latched in the rows of that matrix for that column. First, data are latched into the rows of a matrix module, and then control signal is sent by the controller to drive the specific column (Fig. 4). This process is repeated to scan all the columns consecutively.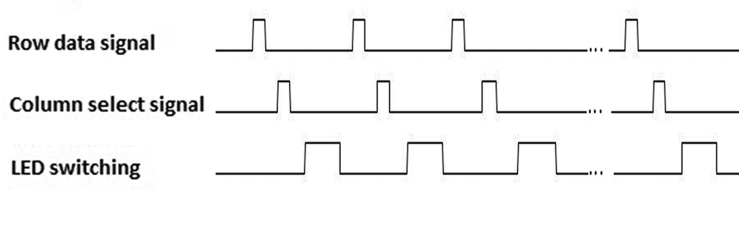 | Figure 4. Conventional progressive scanning method signaling diagram to scan a single frame |
If the number of columns per module is  and the number of modules is m*n = x (as shown in Fig.2), then the total number of columns is,
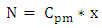 | (1) |
Now, if data-setup-time for each column is  , then total data-set-up time for
  columns is,
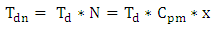 | (2) |
Now, if column-setup-time for each column is  , then for the
  columns total required time is
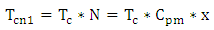 | (3) |
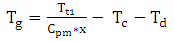
If LED-ON-time (switched-on) for each column is  , then total time to scan all the pixels of an LED board for a frame is,
 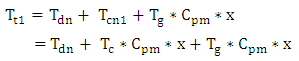 | (4) |
From (4), we have, 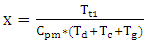 | (5) |
 | (6) |
When  , LED is faded away that gives the maximum possible number of modules
 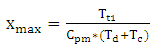 | (7) |
4.2. Proposed Scanning Method (Case-2)
This scanning approach is tailored from CRT TV monitor interlaced scanning to deal with flickering and other design constraints.In this approach, a data-latch is engaged with every matrix module where first columns of every module are connected together; second columns of every module are connected together; and similarly rest of the columns are connected in this fashion. In lieu of driving each single column consecutively, scanning process is set about by sending data to the linked latches for the first columns of every module, and then all the first columns are driven at a time. In this fashion, second columns and the rest of the columns of the modules are scanned by turn (Fig. 5).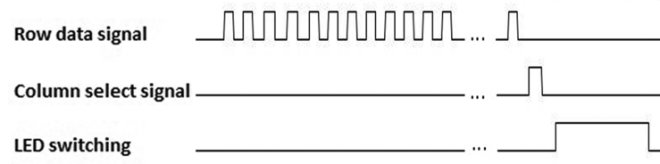 | Figure 5. Proposed scanning method signaling diagram to scan a single frame |
In this case, total data-setup-time  for conventional and proposed method to scan a frame are same, but the total accumulated column-setup-time would be different.Now, if column-setup-time for each column is
  , then for the N columns, total required time is,
 | (8) |
If LED-ON-time for each column is  , then total time to scan all the pixels of an LED board for a frame is
 | (9) |
From (9), we have | (10) |
 | (11) |
When  then maximum possible number of modules is
 | (12) |
5. Simulation Results of Mathematical Models
To postulate the parameters value that reflect practical design, widely used 74/54/40 series ICs are taken into account. Considering Fig. 3 where Latch, Row driver, Column selector and column driver are 74LS374, BJT transistor array, 4017 decade counter and IRF540 MOSFET respectively, we can estimate the amount of delay associated with the driver as follows:In 74LS374, total time for data to reach output from input is around 117ns (considering minimum data-setup time, output-enable time, output disable time, propagation delay) [18]. In 4017 counter, propagation delay is around 650ns [19].In IRF540 MOSFET, gate delay is around 175ns (considering turn-on, turn-off, rise-time, fall-time) [20].In order to observe the delay effect associated with the digital circuitry in simulation, data-setup-time and column-setup-time are roughly assumed to be 200ns and 1µs respectively from the above information. In addition, the number of columns per module is taken as 10 and frame rates are varied between 50Hz to 150Hz.
6. Advantages of New Method
6.1. Reduction of Flicker
Luminance distribution and panel refresh rate are the most two important factors for perception of flicker and the new method facilitates improvement of these factors to eliminate flicker [21].In this new method, refresh rate is N times higher for N columns matrix than that of conventional progressive method. Thus at 100 Hz frame rate, refresh rate is 1000 Hz for 10 columns matrix module. Higher temporal refresh rate effectively eliminates perception of flicker. Flicker reduction can be predicted by the quantitative analysis of the Farrell analytical method [22, 23].Moreover, during each refresh, illuminated pixels are distributed over the display board. Spatially luminance distribution also contributes to perception of continuity of a large display.
6.2. Higher Pixel Luminance with Large Number of Modules
It is clear from Fig. 6 that if the number of modules increases, LED-ON-time hence the luminous intensity decreases for both cases (holding frame rate constant). For case-1, it decreases at a certain rate and at the end slumps to zero. On the contrary for case-2, at the onset it goes through subtle change and fall steadily, and it plummets to x-axis when the number of modules becomes substantially large. | Figure 6. Equation (6) and Equation (11) give the above simulated line graph that presents the change of LED-ON-time per pixel for a complete frame scan with number of matrix modules (while keeping frame rate constant) |
6.3. Higher Pixel Luminance with Higher Frame Rate
Fig. 7 shows that LED-On-time for case-2 is substantially large (around 100 times) than case-1 for same frame rate.  | Figure 7. Equation (6) and Equation (11) give this graph that presents the change of LED-ON-time per pixel with the frame rate of the display for a complete frame scan (while keeping the number of modules constant) |
6.4. Higher Maximum Number of Modules
For a large number of modules, the curves (Fig. 6) decline to a point where LED-On-time is comparable to the sum of data-setup-time and column-setup-time and start falling sharply. This area of rapid changes can give an estimation of the maximum possible number of modules with desired light intensity and frame rate. Fig. 8 shows that maximum possible number of modules for new scanning method is almost 10 times (depends on the number of columns per module). | Figure 8. Simulation of Equation (7) and Equation (12) give this graph showing the relation between maximum possible number of modules with the frame rate |
7. Conclusions
The graphs originated from the simulation of the mathematical models point to the advantages of new scanning approach over conventional approach. These mathematical models can be used to estimate luminance of the display to be designed; hence quantitative analysis of perception of flicker can be calculated before construction of the display board as well. As the new scanning approach mitigates perception of annoying flicker increasing refresh rate without increasing frame rate, it gives the following advantages: constructing large display without sacrificing overall LED display luminous intensity by reducing the effect of LED rise time, fall time and other delays in the driver circuitry; simplifying PCB layout design and using long transmission path alleviating effect of skew, jitter, etc.However, switching-on several columns at a time requires a powerful power supply which also limits the display size in practical implementation. Despite this limitation, it is possible to build up substantially large display employing new scanning approach commonly seen around us. Furthermore, other sources of delays can be included in the models to estimate the behavior of the driver system more accurately.
References
| [1] | Kezhi Lin, T.Y., Lin Li and Donghui Guo. A new algorithm of dynamic display for the large led screen of multi-scanning-beam. In Anti-Counterfeiting Security and Identification in Communication (ASID), 2010 International Conference on IEEE IEEE Chengdu, pp 142 – 145, 2010. |
| [2] | Jingrui Liu, Z.M. System design and simulation of led dot-matrix screen displaying chinese characters based on proteus. In 2012 International Conference on Computer Science & Service System (CSSS), IEEE: Nanjing pp 2106 – 2108, 2012. |
| [3] | Popoola Rotimi Olaoluwa, A.M.R., and Shoneye Shola David. Design and construction of multi-coloured led scrolling display using pic microcontrollers. Journal of Environmental Science, Computer Science and Engineering & Technology vol.3, pp1619-1630, 2014. |
| [4] | Darshil J. Modi, P.V.S.V. Advertising display system using led and graphical led. International Journal for Scientific Research & Development pp153-157, vol.1, 2013. |
| [5] | Lau, W.L.G.a.K.T. Dot matrix display system for korean numerals. IEEE Transactions on Consumer Electronics 892 – 896, vol. 37, 1991. |
| [6] | Huang, W.-F. Designing a display unit to drive the 8x8 led dot-matrix displays. In 2013 IEEE 5th International Nanoelectronics Conference (INEC), IEEE: Singapore, pp 385 – 388, 2013. |
| [7] | Md. Shahnur Azad Chowdhury, M.S.A.a.M.A.U. Designing a 36 segment display for bengali compound character. International Journal of Computer Science and Network Security (IJCSNS) 2013, vol. 13. |
| [8] | M. Salim Beg, W.A. Two simple bar matrix display formats for alphanumeric english characters. IEEE Transactions on Consumer Electronics pp357 – 360, vol. 34, 1988. |
| [9] | Htet Thit San, C.M.N.a.H.M.T. Implementation of pic based led displays. International Journal of Electronics and Computer Science Engineering (IJECSE) pp191-198, vol. 3, 2014. |
| [10] | Adamu Murtala Zungeru, G.D.O., Ochi Fortunatus Uche and Taidi Eli. Design and implementation of a gsm-based scrolling message display board. International Journal of Computational Science, Information Technology and Control Engineering (IJCSITCE) pp 21-31, vol. 1, 2014. |
| [11] | Yongxian Song, Y.F.J.M.a.X.Z. Design of led display control system based on at89c52 single chip microcomputer. Journal of Computers, Academy Publisher vol. 6, 2011. |
| [12] | K. Mateur, R.E., H. Dahou, L. Hlou Optimized design for controlling led display matrix by an fpga board. Journal of Advanced Computer Science & Technology, Science Publishing Corporation pp120-128, vol. 3, 2014. |
| [13] | Ding Yanchuang, G.J. Led display screen design and proteus simulation based on single-chip microcomputer. In Information Engineering and Computer Science (ICIECS), 2010 2nd International Conference on IEEE: Wuhan, pp 1 – 4, 2010. |
| [14] | Hui JIANG, J.X., Keren WANG. Software and hardware design and implementation of led display system of stadium big screen. In Multimedia Technology (ICMT), 2011 International Conference on, IEEE: Hangzhou, pp 3663 – 3666, 2011. |
| [15] | Huang, W.-F. Three approaches to light an 8x8 led dot-matrix display. In IEEE 2nd International Symposium on Next-Generation Electronics (ISNE), IEEE: Kaohsiung, pp 37 – 40, 2013. |
| [16] | Mitică Iustinian NEACĂ, A.M.N. Control system for a 8×8 bi-color dot matrix display. In Applied and Theoretical Electricity (ICATE), 2014 International Conference on IEEE: Craiova, Romania, pp 1 – 4, 2014. |
| [17] | Kurdthongmee, W. Design and implementation of an fpga- based multiple-colour led display board. Microprocessors and Microsystems, Elsevier B.V. pp327–336, vol. 29, 2005. |
| [18] | 74LS374 Datasheet, OCTAL D-TYPE FLIP-FLOP WITH 3-STATE OUTPUT, Motorola, Ed., ed. |
| [19] | HCF4017B Datasheet, DECADE COUNTER WITH 10 DECODED OUTPUTS," STMicroelectronics, Ed., ed, 2001. |
| [20] | IRF540, N-CHANNEL 100V - 0.055 W - 22A TO-220 LOW GATE CHARGE STripFET™ II POWER MOSFET, STMicroelectronics, Ed., ed, 2003. |
| [21] | K. T. Lili Wang, Yan Tu, Li Chen, Flicker visibility in scanning-backlight displays. Journal of the SID, pp. 375-381, vol. 16, 2008. |
| [22] | J. E. Farrell, An analytical method for predicting perceived flicker. Behaviour & Information Technology, pp. 349-358, vol. 5, 1986. |
| [23] | B. L. B. J. E. Farrell, and Carl R. Haynie, Predecting Flicker Thresholds for Video Display Terminals. Proceedings of the SID, vol. 28, 1987. |

 Abstract
 Reference
 Full-Text PDF
 Full-text HTML