E. O. Ogunti1, W. Lawal1, S. O. Olatunji2, B. Kareem3
1Department of Electrical and Electronics Engineering, Federal University of Technology Akure, Nigeria
2Department Computer Science, University of Dammam, Dammam, Saudi Arabia
3Department of Mechanical Engineering, Federal University of Technology, Akure, Nigeria
Correspondence to: B. Kareem, Department of Mechanical Engineering, Federal University of Technology, Akure, Nigeria.
| Email: |  |
Copyright © 2015 Scientific & Academic Publishing. All Rights Reserved.
Abstract
Signal strength performance of a detector circuitry was evaluated under White Gaussian Noise (WGN). A component-based sigma quality improvement model was developed and utilized to assess the performance of the signal detector. The resulting model was implemented on MATLAB software. The results obtained revealed that reduction in probability of false alarm (PFA), and probability of not meeting target were sustainable to detectable signal strength with increased signal energy-to-noise ratio. Greater signal strength performance was resulted from the deployment of sigma quality strategy. Generally, from the results it can be concluded that signal strength could be positively influenced by the application of six sigma component-based system. This showed that detector‘s signal sensing strength depended on circuitry components quality.
Keywords:
Signal, Strength, Quality, Component, Noise
Cite this paper: E. O. Ogunti, W. Lawal, S. O. Olatunji, B. Kareem, Optimisation of Signal Strength for a Detector under Noise Using Sigma Quality Approach, Electrical and Electronic Engineering, Vol. 5 No. 1, 2015, pp. 13-21. doi: 10.5923/j.eee.20150501.03.
1. Introduction
The presence of noise in signal is responsible for fading/interference [1, 2] and inaccuracy in signal detection [3, 4]. This noise needs to be reduced for optimal signal detection [5, 6, 7]. There are many research efforts in the areas of improved signal strength (detection) by noise reduction. These include detection-interpolation scheme [7], penalty function technique [8], minimax noise variance estimation [9], performance improved nonlinear detector of spread spectrum receiver [10], nonparametric dynamic model for monitoring changes in signal detection performance [11], synthetic antenna array concept for signal detection enhancement [12], algorithm based on sparsity hypotheses [13], successive interference cancellation architecture and channel decoding to treat the co-channel interference [14], Dynamic Spectrum Access (DSA) [15], and orthogonal frequency division multiplexing scheme for fading / interference mitigation [1, 2]. Apart from Broumandan [12] that carried out research on enhancement of signal detection using synthetic antenna array concept, scanty studies were identified in applying the component-based circuitry for improved signal strength through increased signal energy-to-noise performance ratio. This study will close the gap mentioned.
2. Materials and Methods
In Figure 1, the detector circuitry system developed by Lawal [16] is given. The detector was embedded with buzzer and microcontroller circuitries to alert the users of signal detection or not. The circuit was developed on multism 11.0 CAD tools, the hardware implementation of the mobile phone detector/sniffer developed for single sniffer connected to the microcontroller that was linked with the liquid crystal display (LCD) that serves as information display unit for the activities of the developed sniffer to indicate phones sniffed and the position.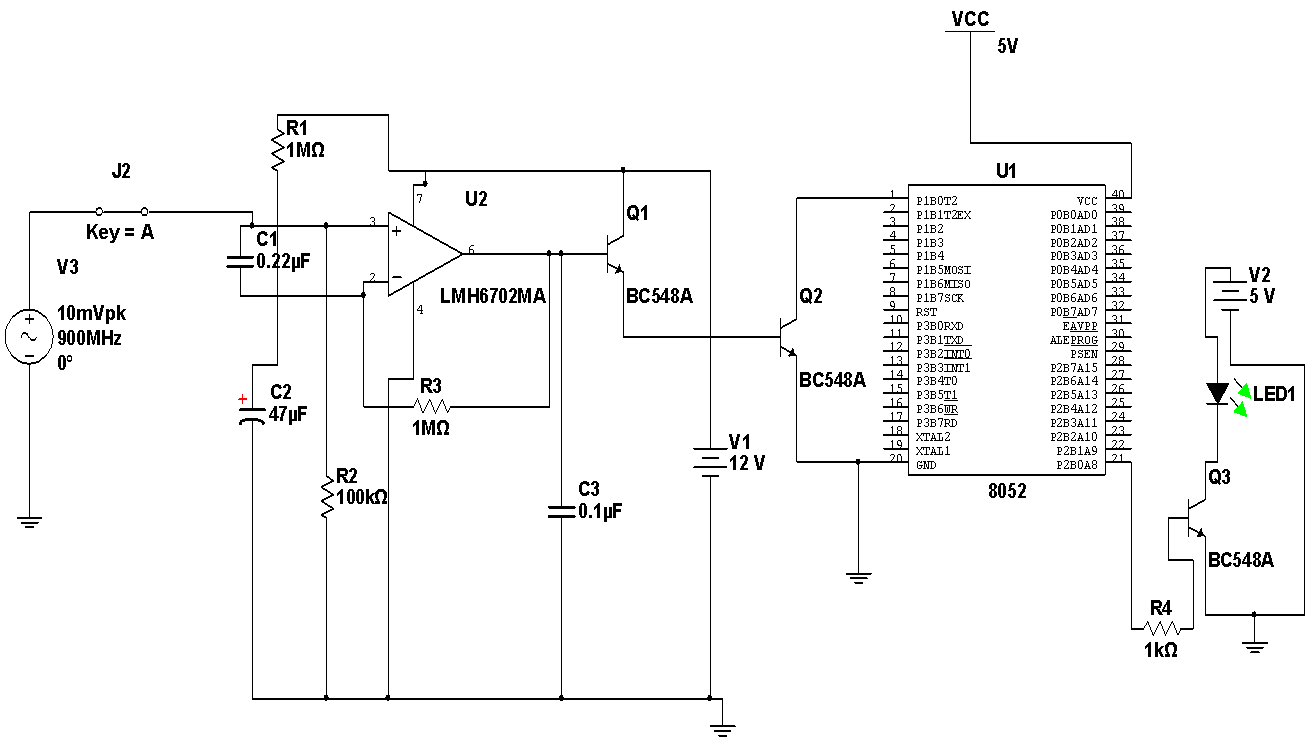 | Figure 1. Detector circuit with buzzer and microcontroller |
The design utilized 0.22μF disk capacitor (C1) to capture the Radio Frequency (RF) signals from the mobile phones. The lead length of the capacitor is fixed at 18 mm with a spacing of 8 mm between the leads to get the desired frequency. The disk capacitor along with the leads acted as a small gigahertz loop antenna to collect the RF signals from the mobile phone. Op-amp IC (U2) was used in the circuit as a current-to-voltage converter with capacitor C1 connected between its inverting and non-inverting inputs. The output CMOS transistor was capable of swinging the output voltage to within 10 mV of either supply voltage terminal. Capacitor C1 in conjunction with the lead inductance acted as a transmission line that intercepts the signals from the mobile phone. This capacitor created a field, stored energy and transferred the stored energy in the form of minute current to the inputs of (U2). This had upset the balanced input of (U2) and converted the current into the corresponding output voltage. Capacitor C2 along with high-value resistor R1 kept the non-inverting input stable for easy swing of the output to high state. Resistor R2 provided the discharge path for capacitor C2. Feedback resistor R3 made the inverting input high when the output became high. When the mobile phone signal was detected by C1, the output of U1 became high and low alternately according to the frequency of the signal as indicated by LED1.Capacitor C3 maintained the base bias of transistor Q1 for fast switching action. This oscillation was indicated by the flashing of the LED and beeping of Buzzer. Capacitor carried energy in form of electromagnetic field. A slight change in field caused by the RF from phone due to noises disturbed the field and forced capacitor to release energy that the RF-signal detector circuit could sense by continuous sounding of the buzzer with the blinking of LED1. The control of the sniffer activities including the length of blinking time range was achieved using microcontroller, intel8051series (Atmel 89c52) that accommodated simultaneous single and multiple cell phone detectors on RF-signal platform. This was not present in the identified former design [20]. The detection performance of the detector was affected by both internal noises (noise in circuit components) and external noises (noises due to environmental conditions, which are, humidity, temperature, barriers, etc.). The stated noises have ability to influence detection performance in two principal ways: detector detected signal and it was true detection, PD; and detector detected signal and it was false detection, PFA (Figure 2). With special attention to internal noises-White Gaussian Noise (WGN), the detection performance was improved upon by reducing (removing) noises form the circuitry components using sigma quality-based statistical model (Figure 3). 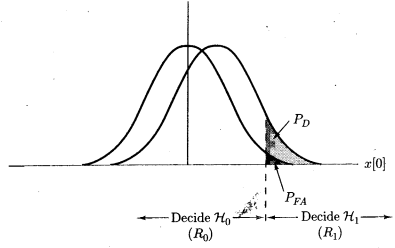 | Figure 2. Decision region and probability |
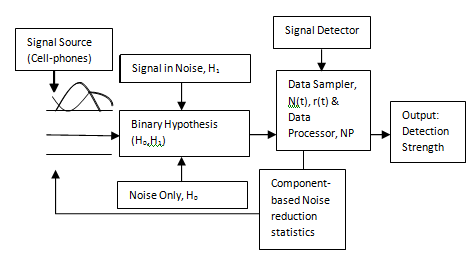 | Figure 3. Signal strength improvement system |
2.1. Modeling Approach
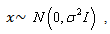
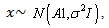
The block diagram of the proposed cell-phone signal detection improvement system is shown in Figure 3. The binary hypothesis based on right (true, H1) or wrong (false, H0) can fit adequately into detection problem. In Neyman-Pearson (NP) approach to cell-phone signal detection, let assume that a realization of a random variable whose probability density function (PDF) is either  or
or is observed when the detector is being tested. The notation
  denotes a Gaussian PDF with mean
  and variance
  . For a sustainable hypothesis testing on
  then the problem is to choose between two competing hypotheses expressed as follows [17]:
 | (1) |
Where  is referred to as the null hypothesis (noise only) and
  as the alternative hypothesis (signal present in noise). This problem is known as a binary hypothesis test since we must choose between two hypotheses (Figure 2). The PDFs under each hypothesis with the difference in means may cause the PDF under
  to be shifted to the right. A reasonable approach might then be to decide
  if
if This is because if
 the observed sample is more likely.If
  is true, or if
  it can be seen from Figure 2 that
 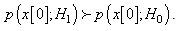 The detector then compares the observed datum value with
  the latter being called the threshold. With this scheme, two types of errors can be identified. If
  is decided but
  is true, that is a Type I error. On the other hand, if
  decided but
  is true, then a Type II error is made. Those errors
  indicates the probability of deciding
  when
when  is true. For example,
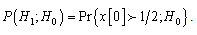 These two errors are unavoidable to some extent but may be traded off against each other. The Type I error probability
  is decreased at the expense of increasing the Type II error probability
  . It is not possible to reduce both error probabilities simultaneously. A typical approach then in designing an optimal detector is to hold one error probability fixed while minimizing the other. Let choose to constrain
  to fixed value, say
  . The problem of Eq. 1 can be viewed as an attempt to distinguish between the hypotheses:
  ,
,  Where
Where  and
and 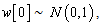 then the signal detection problem arise. Deciding
  when
when  is true can be thought of as a false alarm. As a result,
  is referred to as the probability of false alarm and is denoted by
  . To design the optimal detector there is need to minimize the other error
  or equivalently to maximize
  . The latter is
  and in keeping with the signal, detection problem is called the probability of detection, denoted by
  . This setup is termed the Neyman-Pearson (NP) approach to hypothesis testing or to signal detection (Figure 2). The objective function is to maximize
  subject to the constraint
  Based on the stated illustration
  can be constrained by choosing the threshold
  since
since 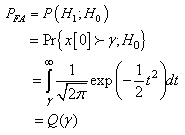 Meanwhile, the goal of a detector is to decide either
  or
or  based on an observed set of data
 . This is a mapping from each possible data set value into a decision. A detector then may be thought of as a mapping from the data values into a decision. In particular, let
  be the set of values in
  that map into the decision
  This region is termed the critical region in statistics. The set of points in
  that map into the decision
  is the complement set of
  Clearly,
  since
since  and
and  partition the data space. The
  constraint then becomes
 | (2) |
In statistics,  is termed the significance level or size of the test. Now there are many sets
  that satisfy Eq. 2, the goal is to choose the one that maximizes
 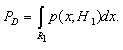 | (3) |
In statistics,  is called the power of the test and the critical region that attains the maximum power is the best critical region. The NP theorem indicates how to choose
  for a given
 , and
, and  [17], Neyman-Pearson, NP theorem maximize
  for a given
 Then decide
  if
if 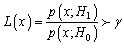 | (4) |
Where the threshold  is found
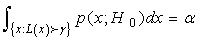 For a general signal detection problem under White Gaussian Noise (WGN):
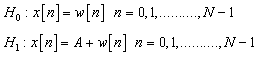 Where the signal is
  for
for  is WGN with variance
  . The previous illustration (Eqs 1-4) is a special case where
  and
and  Also, note that the problem is a test of the mean of a multivariate Gaussian PDF. This is because under
 while under
 where, 1 is the vector of all ones. Hence, we have equivalently
 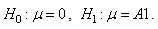 This parameter test of the PDF interpretation is used in describing the signal detection problem. Then the signal detector decides
  if
if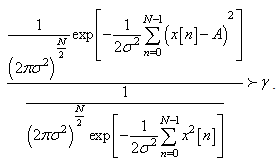 Taking logarithm of both sides results in
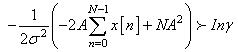 This simplifies to
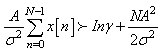 .Since,
  then
then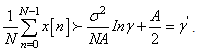 | (5) |
The signal based NP detector compares the sample mean  to a threshold
  This is intuitively reasonable since
  may be thought of as an estimate of A. if the estimate is large and positive, then the signal is probably present. How large the estimate must be before declare that a signal is present depends upon concerns that noise only may cause a large estimate. To avoid this possibility,
  can be adjusted to control
  with larger threshold values to reduce
  To determine the detection performance the test statistic
  should be Gaussian under each hypothesis. The means and variances are [17,18]:
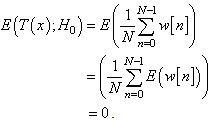 Similarly,
 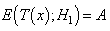 and
and 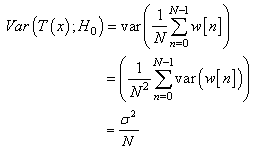 Similarly,
 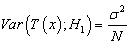 We have then
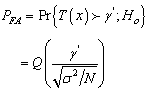 | (6) |
and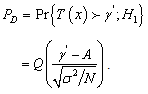 | (7) |
 can be related directly to
  by noting that the
  function is monotonically decreasing since
  is a CDF, which is monotonically increasing. Thus,
  has an inverse denoted as
  . As a result, the threshold is found from Eq. (5) as [17, 18],
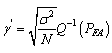
 is the probability of exceeding a given value (target) as:
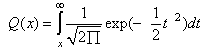 From which,
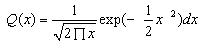 Then inverse, complementary Cumulative Distribution Function (CDF);
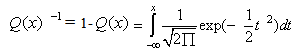 and
and 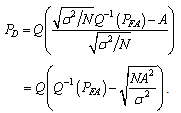 | (8) |
It is seen that for a given  the detection performance would increase monotonically with
  , which is the signal energy-to-noise ratio (ENR) [17, 18]. In case of a hypothesis, testing problem called the mean-shifted Gauss-Guass problem. It was observed the value of a test statistic T and decide
  if
if  and
and  otherwise, where,
  Hence, we wish to decide between the two hypotheses that differ by a shift in the means of T. If
  Then for this type of detector, the detection performance is totally characterized by the deflection coefficient
  [17]. This is defined as
 | (9) |
In the case 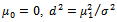 may be interpreted as a signal-to-noise ratio (SNR). To verify the dependence of detection performance on
  we have that
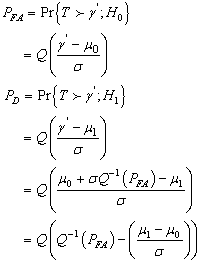 And using Eq. (9), we have
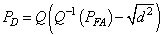 | (10) |
Since,  The detection performance is therefore monotonic with the deflection coefficient. Where,
 Each point on the curve corresponds to a value of
  for a given threshold
  By adjusting,
  any point on the curve may be obtained. As expected as
  increases,
  decreases but also does
  and vice-versa. This type of performance summary is called the Receiver Operating Characteristics (ROC). This ROC also support the detection probability that relates
  and
and . An alternative way of summarizing the detection performance of a NP detector is to plot
  versus
  The improvement on probabilities of signal detection
  can be achieved through deployment of sigma quality statistic on components responsible for signal detection, namely, capacitors, transistors, resistors, antennae, etc. (Figures 1 and 3). Improvement strategies based on one-, two, three-, four-, five-, or six-quality sigma (δ) could be imposed on the components as a whole [19]. The detection enhancement sigma (δ) is capable of removing noises with reduced probabilities of false alarms. With the new arrangement, Eq. (10) then becomes:
 | (11a) |
Signal strength termed signal Energy-to-Noise Ratio (ENR) at a given probability of exceeding the target (threshold value) can be statistically estimated as | (11b) |
2.2. Model Testing
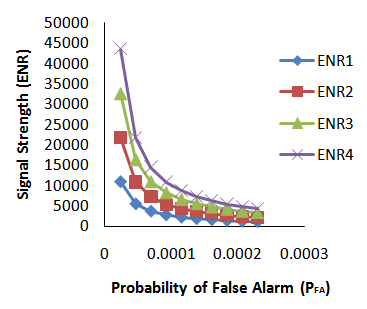
Information on cell-phone signal detector of the type shown in Figure 1 was used for experimentation. The cell-phone detector was designed to detect RF-signals of the cell-phone in active mode located within radii 0-6m. The data generated from the experiment showed a representation of general detectors’ behaviours with probabilities of false alarm ranging from 0 to 1. This indicated that when false alarm is 0, there is full (accurate) signal detection and if false alarm is 1, then detector is not functioning well. Therefore, accuracy of detection can be enhanced by reducing false alarm in order to improve detection accuracy. Reduction of false alarms was carried out by introducing component based sigma improvement strategies varied from one (1) to six (6) sigma under homogeneous behaviour of the system. In this arrangement, the range 0.69 to 0.0000034 would have reduced circuitry system failure probabilities [19]. The probability of exceeding the given value (target)  was also assumed a failure range, 0 – 1. The distance (d) between means of the two densities of hypothesis (Ho, H1) was taken in the range 0.5 to 2.0 in step of 0.5. Analysis of the optimized detection system was carried out on MATLAB computer software to determine the effect of sigma improvement system on the signal strength performance. The signal strengths generated based on signal energy-to-noise ratio (ENR) and its corresponding probabilities of false alarm are presented in Figures 4-10.
3. Results and Discussion
The results based on balanced probability of not exceeding the target of 0.5 were generated to illustrate performance of the system in terms of signal strength performance based on ENR under the influence of sigma quality. Figure 4 shows probability levels of false alarm with signal strength based on signal energy-to-noise ratio, at the probability of not exceeding the target (0.5). It can be seen from Figure 4 that at given probabilities of false alarm and meeting target, the signal strength performance increased monotonically with the signal energy-to-noise ratio at varying degrees depending on the value of distance, d (range from 0.5 to 2.0) between the two densities H0 and H1. The results from Figure 4 showed that the signal strength (ENR4) monotonically and steadily increased fastest at distance 2.0. The fast rate of noise removal from the system has led to reduction in probabilities of false alarm from the detector.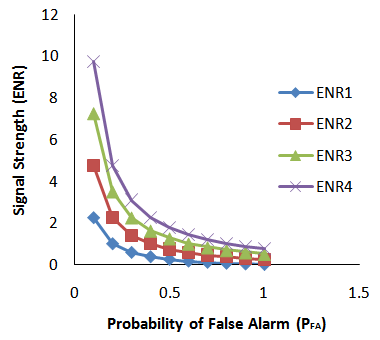 | Figure 4. Signal strength without sigma improvement system |
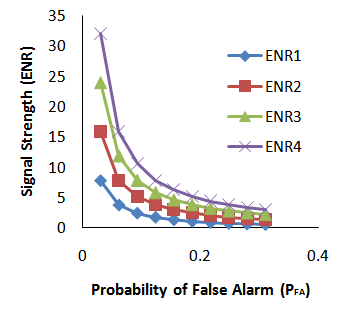
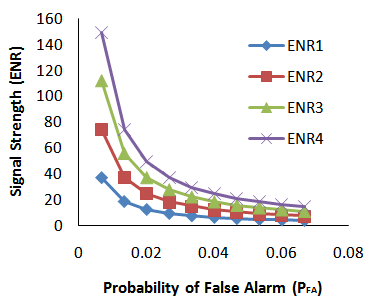
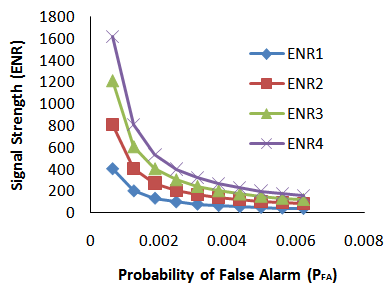
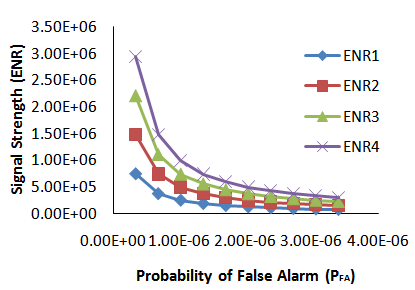
Figures 5-10 revealed signal strengths (ENR1, ENR2, ENR3 and ENR4) and probabilities of false alarm (PFA) outcomes for the densities distance 0.5, 1.0, 1.5 and 2.0 when component based sigma improvement circuitry was imposed on the system. The results obtained when detection system was treated with component-based improvement system based on single sigma (Figure 5) indicated a slight improvement in signal strengths with reduction in probabilities of false alarm over untreated results given in Figure 4 which served as control.Steadily and more satisfactorily improved signal detection performance was noticed and demonstrated by considerably higher monotonically increased signal strength as the system was moving from two-sigma (Figure 6), three-sigma (Figure 7), four-sigma (Figure 8), five-sigma (Figure 9) to six- sigma (Figure 10). The outcomes generally revealed that signal strength could be fully enhanced with the application of six-sigma component-based quality system. Signal strengths based on signal energy-to-noise ratios were running into thousands while the probabilities of false alarms were running close to zero with the application of six-sigma quality scheme. The outcomes have demonstrated a promising approach to effective noise removal from the communication system. 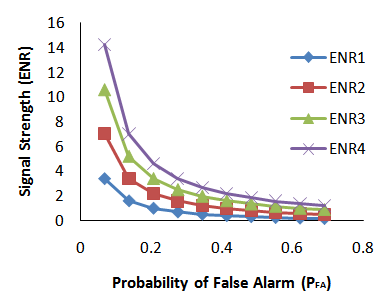 | Figure 5. Signal strength with one- sigma improvement system |
 | Figure 6. Signal strength with two-sigma improvement system |
 | Figure 7. Signal strength with three- sigma improvement system |
 | Figure 8. Signal strength with four- sigma improvement system |
 | Figure 9. Signal strength with five-sigma improvement system |
 | Figure 10. Signal strength with six-sigma improvement system |
4. Conclusions
The detection circuit was developed to take care of signal detection strength/probability through incorporation of component-based sigma improvement system. Signal detection strength modeling was developed based on sigma quality improvement strategy. It can be generally concluded from the results of the study that signal detection performance could be fully strengthened with the application of six sigma component-based improvement system. The deployment of six-sigma quality system may demand high quality component-based circuitry. One cannot conclude yet on the strength of signal detection until thorough analysis of the components quality is carried out. Therefore, determination of signal detection strength would demand balancing the component quality with strength of signal being detected. These promising outcomes of improved signal strength due to decreased probability of false alarm through component-based sigma quality improvement strategy could break a new ground in simplifying the complex nature of electronics manufacturing systems of modern days.
ACKNOWLEDGEMENTS
The authors wish to express gratitude to the Managements of the Federal University of Technology, Akure, and Rufus Giwa Polytechnic, Owo, Nigeria, for providing necessary facilities for this study.
References
| [1] | O.S. Adewuyi, W. Lawal and E.O. Ogunti, 2013, Performance Analysis of OFDM in Combating Multipath Fading. IOSR Journal of Electronics and Communication Engineering (IOSR-JECE), 6 (2) 99-107. |
| [2] | W. Lawal, S.O. Adewuyi, and E.O. Ogunti, 2014, Effect of Cyclic Prefix on OFDM over AWGM Channel. International Journal of Innovative Research in Advanced Engineering (IJIRAE), 1 (9) 185-191. |
| [3] | Y.W. Lau., 2008, Noise in Accounting Information: The Signal Detection Theory Perspective. Int. Journal of Economics and Management 2(1): 179 – 193. |
| [4] | T. Kailath, and H.V. Poors, 1998, Detection of Stochastic Processes. IEEE Transactions on Information Theory, 44 (6) 2230-2259 (1998). |
| [5] | R. Tandra, 2005, Fundamental Limits on Detection in Low SNR. A Thesis Submitted in Partial Satisfaction of the Requirements for the Degree of Master of Science in Engineering, Electrical Engineering and Computer Sciences in the Graduate Division of the University of California, Berkeley, Spring 2005. |
| [6] | S.V. Veseghi, 2000, Advanced Digital Signal Processing and Noise Reduction, Second Edition, pp. 356- 377. John Wiley & Sons Ltd. |
| [7] | S.V. Vaseghi and P.J.W. Rayner, 1990, Detection and Suppression of Impulsive Noise in Speech Communication Systems. IEE Proceedings, 137 (1) 38-46 (1990). |
| [8] | D. Kundu, 2000, Estimating the Number of Signals In The Presence of White Noise. Journal of Statistical Planning and Inference. 90 (1) 57 – 68. |
| [9] | G. Shevlyakov and K. Kim, 2006, Robust Minimax Detection of a Weak Signal in Noise with a Bounded Variance and Density Value at The Center Of Symmetry. IEEE Transactions on Information Theory, 52 (3) 1206- 1211. |
| [10] | S.M. Saberali, and H. Amindavar, 2007, Spread Spectrum Signal Detection In Overlay Systems Using Maximum Entropy PDF Estimation Based on Fractional Moments, IEEE ICASSP 2007, III, pp. 1269-1272 (2007). |
| [11] | B.M. Turner, 2009, Signal Detection Theory: A Proposal for a Nonparametric Model. A Thesis Presented in Partial Fulfillment of the Requirements for the Degree Master of Arts in the Graduate School of the Ohio State University, 2009. |
| [12] | A. Broumandan, 2009, Enhanced Narrowband Signal Detection and Estimation with a Synthetic Antenna Array for Location Applications. A Thesis Submitted to the Faculty of Graduate Studies in Partial Fulfillment of the Requirements for the Degree of Doctor of Philosophy, University of Calgary, September 2009. |
| [13] | D. Pastor and F.X. Socheleau, 2012, Algorithms Based On Sparsity Hypotheses For Robust Estimation of the Noise Standard Deviation in Presence of Signals with Unknown Distributions and Occurrences. Collection des rapports de recherché de Telecom Bretagne, RR-2010001-SC, hal-00703291, version 1-1 June 2012, Telecom Bretagne, France. |
| [14] | H. Chaouech and R. Bouallegue, 2012, Multiuser Detection in Asynchronous Multibeam Communications. Inter. Journal of Wireless & Mobile Networks (IJWMN). 4 (1) 21-34. |
| [15] | T.J. O'shea, T.C. Clancy and H.J. Ebeid, 2014, Practical Signal Detection and Classification in Gnu Radio. Research Conducted at Laboratory for Communication Sciences, US Department of Defense 2014. |
| [16] | S.M. Kay, 1998, Fundamental of Statistical Signal Processing-Detection Theory, Prentice Hall, New Jersey. |
| [17] | H.L. Van Trees, 2001, Detection, Estimation, and Modulation Theory, Part I: Detection, Estimation, and Linear Modulation Theory. pp. 19-86. John Wiley & Sons, Inc. |
| [18] | W. Lawal, 2012, Development of Unauthorized Cell-Phone Usage Sniffing System. A Thesis Submitted to the School of Postgraduate Studies in Partial Fulfillment of the Requirements for the Degree of Master in Engineering in Electrical and Electronics Engineering, the Federal University of Technology, Akure, Nigeria, December 2012. |
| [19] | B. Kareem, 2015, Evaluation of Failures in Mechanical Crankshafts of Automobile based on Expert Opinion, Case Study in Engineering Failure Analysis, 3(1) 25-33. |
| [20] | W.S. Nicholas, Study of Cellular Phone Detection Techniques, M.Sc. Dessertation, Computer and electronics Engineering, Department of Dissertations & Student Research in Computer Electronics & Engineering, University of Nebraska-Lincoln, 2011. |
 Abstract
 Reference
 Full-Text PDF
 Full-text HTML