Laurent Bitjoka, Ousman Boukar, Alban Ngatchou, Gamraïkréo Djaowé, Lamsikreo Banbe
Energy, Signal, Imagery and Automatic Control Laboratory, The University of Ngaoundere, Ngaoundere, Cameroon
Correspondence to: Laurent Bitjoka, Energy, Signal, Imagery and Automatic Control Laboratory, The University of Ngaoundere, Ngaoundere, Cameroon.
| Email: |  |
Copyright © 2015 Scientific & Academic Publishing. All Rights Reserved.
Abstract
Choice and social acceptance of one beans varieties (Phaseolusvulgaris L.) in the market are determined by the color, texture and shape of its grains. It is in this way that the consumers or producers conduct sorting or varietal identification to classify different varieties of beans in the preference order. This varietal identification is done either manually by visual inspection or by determining grain shape feature using the finite element method. However, it appears that these classical existing methods are laborious and require many manipulations; hence the need to implement a fast and efficient determination method of the bean grain shape attributes. The objective of this work is to develop a method to identify bean varieties (Phaseolusvulgaris L.) using CFA (Color Filter Array) images analysis. To do this, a shape attribute bean grain analysis system from CFA images, based on the determination of the compactness, was developed. Sixteen (16) beans varieties namely DOR-701 MERINGUE (PH-201), MAC-33, SENEGALAIS, CIM 9331-1, ACA PAN 019, ACA PAN 021, GLP- (F.B.), GLP-190 (F.V.), MAC-16, MAC-18, MAC-55, MPOLO, TY 3396-12, Vtt 926 5-7 and ZEBRA were the subject of this study. Shape attribute image, namely compacity, was calculated on CFA segmented images. The results obtained show that the compacity levels of different bean varieties studied ranged from 0.34 to 0.55; corresponding respectively to the ZEBRA and DOR-701 varieties. Comparison between the compacity levels obtained by image analysis method to those obtained by the finite element method has shown that both methods give similar results. This allows saying that image analysis method is presented as a suitable tool and best method for varietal identification, because this approach is relatively easy to implement and use.
Keywords:
CFA images analysis, Bean grain, Compacity
Cite this paper: Laurent Bitjoka, Ousman Boukar, Alban Ngatchou, Gamraïkréo Djaowé, Lamsikreo Banbe, Fast Objective Identification of Beans Grains (Phaseolus vulgaris L.) Varieties Using CFA Images Compacity Measurement, Electrical and Electronic Engineering, Vol. 5 No. 1, 2015, pp. 1-5. doi: 10.5923/j.eee.20150501.01.
1. Introduction
Surface area and volume of legume seeds is an important physical characteristic in processes such as harvesting, cleaning, separation, handling, aeration, drying, storing, milling, cooking and germination [1]. Geometric parameters of legume seeds are important for germination process as well, bigger bean seeds germinate faster than smaller and medium ones, Kelli (2007) cited by [2]. The size and shape are important in electrostatic separation from undesirable materials and in the development of sizing and grading machinery [2, 3]. The size and shape of agricultural products are the most important quality and processing parameters; they have significant importance in determining the market value of beans grains varieties [4].Owing to the irregularities and variation in shapes, surface profiles, and dimensions of beans grains, it is very difficult to evaluate their actual surface areas. A complete specification of shape requires an infinite number of measurements. The shapes of most natural food grains generally resemble some of the regular geometrical objects, and this feature is utilized in the theoretical estimation of the surface area utilizing certain techniques using a calliper. To overcome this difficulty of food shapes measurements, Brosnan and Sun [5] used computer vision based on digital image analysis to enables size measurements faster and more accurately. Computer vision includes the capturing, processing and analysing images, facilitating the objective and non destructive assessment of visual quality characteristics in food products. Koc [6] determined the volume of watermelon (Citrullus lanatus cv. ‘Surme’) using an image process system. Tahir et al. [7] evaluated the variability in the colour, morphology and textural features of cereal grain due to the change in moisture content of the kernels by using image analysis. Yan et al. [8], investigated the change of shape factor by image analysis system with moisture content changing during drying. Tanska et al. [9] tested the determination of the geometrical features of rapeseed, surface colour of seeds, and also identification impurities that are difficult to separate during the cleaning process. Firatligil-Durmus et al. [2] measured the projected area, equivalent diameter, perimeter, maxferet, minferet, circularity, elongation and thickness of bean and lentil seeds using an image analysis system.The objectives of this study were to determine the utility of compacity feature obtained by CFA images analysis for classification of kernels of sixteen Cameroonian beans (Phaseolus vulgaris L.). To validate our approach, our results will be compared to results obtained by physical measurements using the finite element method.
2. Materials and Methods
In this part we are presenting the material used and the experimental protocol used in this work. The first section presents the bean varieties used, the second paragraph is devoted to the presentation of acquisition and image processing devices, the third section presents the protocol used.
2.1. Biological Materials
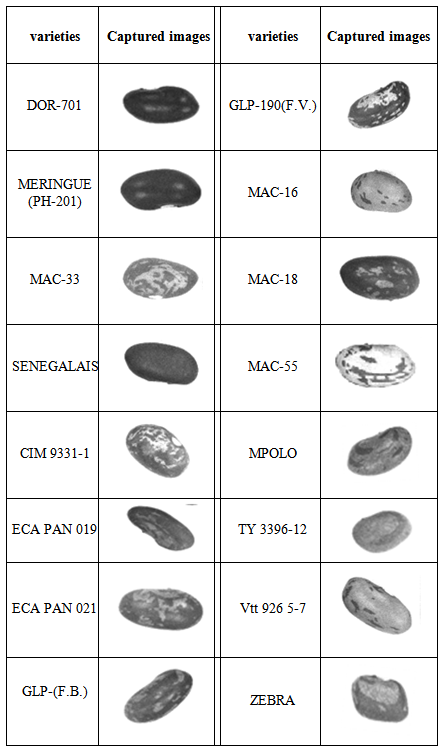
Bean (Phaseolus vulgaris L.) grain samples of sixteen freshly harvested varieties, namely, DOR-701, MERINGUE (PH-201), MAC-33, SENEGALAIS, CIM 9331-1, ECA PAN 019, ECA PAN 021, GLP-(F.B.), GLP-190 (F.V.), MAC-16, MAC-18, MAC-55, MPOLO, TY 3396-12, Vtt 926 5-7 and ZEBRA were obtained from the Regional Center for Research and Innovation West, Bafoussam, Cameroon. The different varieties of beans grains samples used in this study are given in Table 1.Table 1. Bean samples used in this study
 |
| |
|
2.2. CFA Images Acquisition Device
CFA images were captured using an image acquisition system of a digital color camera similar to that developed by Bitjoka et al. [10] and Boukar et al. [11] (Figure 1). This image acquisition system is a box type enclosure. Samples were illuminated by using four parallel fluorescent lamps with a color temperature of 6500 K (Philips, Natural Daylight, 40 W) and a color rendering index (Ra) near to 95%. The four lamps were situated 40 cm above the samples and at angle of 45° of the food sample plane. This illumination system gave a uniform light intensity over the food plane. A CCD digital color camera (FUJIFILM Finepix HS10) was located vertically at a distance of 25cm from the samples through a hole on the top surface of the box. The angle between the camera lens axis and the lighting sources was around 45°. Sample illuminators were inside a wood box whose internal walls were painted white, firstly to increase contrast and eliminate areas with grey levels close to white [12] and secondly to assure a uniform illumination inside the room [13]. Images were captured with the mentioned CCD digital color camera with its maximum resolution (3664 X 2742 pixels), and stored as a raw image without compression. The white balance of the CCD digital color camera was set using a simple white reference. Color standards were photographed and analyzed periodically to ensure that the lighting system and the CCD digital color camera were working properly.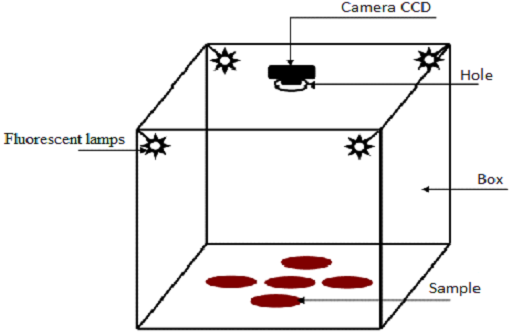 | Figure 1. Schematic representation for beans grains image acquisition system [11] |
Treatment and analysis of the images are made in Image Java using extensions (plugins) developed in JAVA language. Image Java is free software written in Java language for processing and analysing 2D or 3D images. It offers many features that can complete through macros or plugins.
2.3. Methodology and Compacity Extraction
12 grains of each bean variety was selected to be analyzed; giving a total of 192 beans grains. The choice of 12 beans grains allows a compromise between the spatial resolution of one grain and the representative kernels number for one variety. The 12 beans grains are spread on a surface so that they are not in contact with one other in order to allow objective measures of the grains surface area and fast digital edge detection of the image. The 12 grains are photographed in raking light conditions to increase the contrast between the grains and the image bottom. Beans grains arranged like this can be independently analyzed. The compacity of each available grain present in only CFA image was calculated. The average compacity of one variety image acquired is calculating such as the average compacity of the various beans grains presents in the CFA image acquired.Compacity reflects the compactness of an object. As part of this work, the capacity level reflects the compactness nature of seeds bean. Compacity is defined by: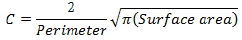 | (1) |
Compacity Levels by digital analysis image will be determined using ImageJ and compacity levels by finite element method will be determined using physical measures as defined by Kara et al. [3].Analysis image using ImageJ was to determine surface area and perimeter. As indicated in figure 2, le surface area is defined as the total number of pixels inside the closed boundary and the perimeter the number of pixels along the closed boundary. 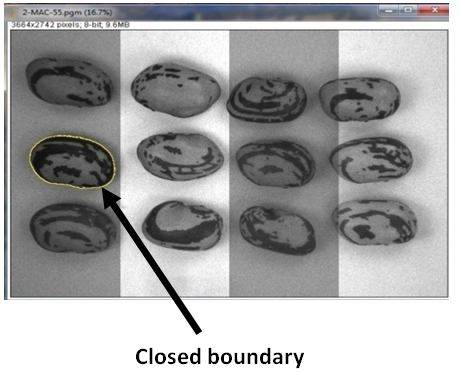 | Figure 2. One bean grain CFA image selection |
3. Results and Discussion
In this section we give firstly results of compacity obtained by digital images analysis and secondly we make a comparison between the results obtained by digital images analysis and those obtained by the finite element method.
3.1. Compacity Evaluation using Digital Images Analysis
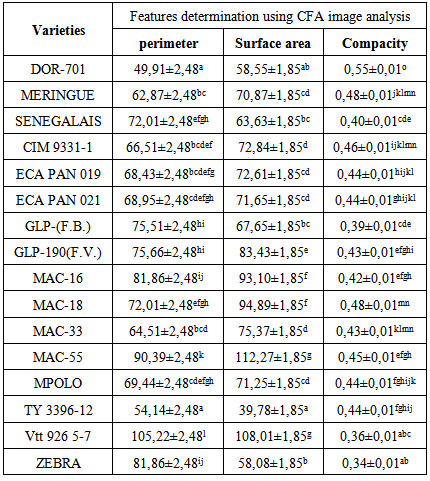
Features measurements obtained by digital images analysis are shown in Table 2. From the results obtained, the values of the perimeter, area and compacity vary respectively to range of 49.91 to 105.22 mm, 39.78 to 112.27 mm2, and 0.34 to 0.55. We obtain also ZEBRA variety has a lower compacity level more than the 15 others varieties. These results show that Variety DOR-701 beans grains are more compact Compared to the others varieties beans grains Analysed. Table 2. Features obtained using digital CFA images analysis
 |
| |
|
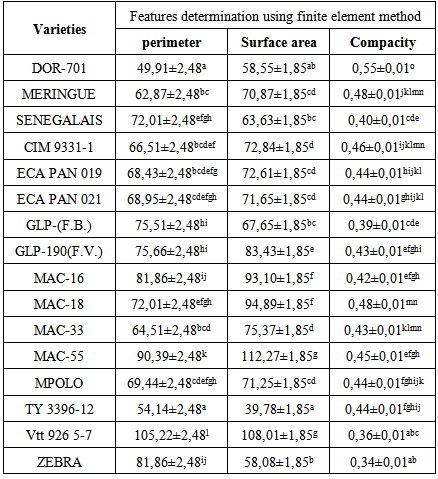
Analysis of the obtained results shows that the coefficient of variation is around 5%. Compacity levels obtained here are at least three times lower compared to the compacity levels reported by Najafabadi and Farahani [14]. However, the compacity levels reported by Kara et al. [3] are closer to our results compared to results reported by Najafabadi and Farahani [14].The compacity application is also present in the ranking of four varieties of wheat namely Gohar, Dehdasht, Koohdasht and Seimareh [4].In each column of Table 2, the levels containing the same letter or groups of letters are not significantly different (p < 0.05). Column compacity shows that the all levels compacity vary from one variety to another.Table 3. Features obtained using finite element method
 |
| |
|
3.2. Results of Comparative Study
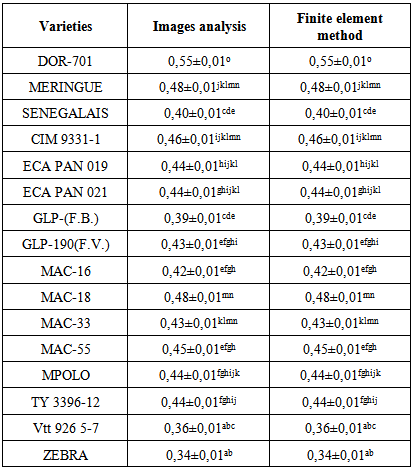
The results of comparative study of compacity obtained using images analysis and finite element methods are shown in Table 4. According to these results, it was noted that there is no significant difference between compacity obtained by digital image analysis and that obtained by the finite element method. Figure 3, as the column compacity of Table 2, shows that the level of compacity varies from one bean grain variety to another. This change lets us say as Najafabadi and Farahani [14] that compacity is a suitable and essential method to measure beans grains (Phaseolus vulgaris L.) morphological features or legume grains in general.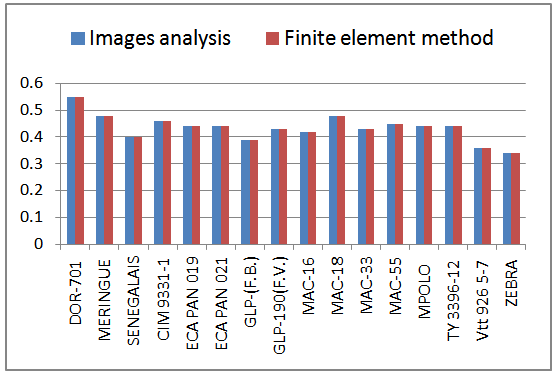 | Figure 3. Illustration of comparative study of compacity level obtained using image analysis and finite element methods |
Table 4. Comparative study of compacity level obtained using image analysis and finite element methods
 |
| |
|
4. Conclusions
Beans (Phaseolus vulgaris L.) stigmatized “poor man’s steak” are staple foods for peoples of subsistent or lower income levels in developing countries. The consumer has traditional purchase criteria that include: appearance (color, gloss or sheen), size and shape (typical of the expected class) and overall quality (splits, defects, and debris) of the seed. Bean selection and consumption patterns are often influenced by the physical characteristics of the seed. Factors such as seed color, size, and shape are often well established within a culture and are strong determinants affecting use. Generally, size and shape factors are measured by finite element method, but this technique is not automatic. The objective of this study was to implement an automatic discrimination of sixteen beans grains varieties based on CFA images compacity measurement, which is a bean grain size and shape factor.Results obtained show that compacity extracted by CFA image analysis could facilitate many agricultural programs such as application of them in automated detections in machine vision systems, discrimination of cultivar seeds from each other. This compacity method evaluation can provide fast identification and measurement of beans grains and then the selection of beans grains with a best cooking time.
ACKNOWLEDGEMENTS
This study was supported, in part, by Cameroon Ministry of Higher Education through the program « modernisation de la recherche universitaire au Cameroun ». We would like to express our special thanks to Mr. Martin NGUEGUIM of the Regional Center for Research and Innovation West (IRAD Cameroun) for the sample of beans grains varieties.
References
| [1] | Igathinathane C., Pordesimo L. O., Columbus E. P., Batchelor W. D., and Methuku S. R., 2008, Shape identification and particles size distribution from basic shape parameters using ImageJ, Computers and Electronics in Agriculture, 63, 168–182. |
| [2] | Firatligil-Durmus E., Sarka E., Bubník Z., Schejbal M., and Kadlec P., 2010, Size properties of legume seeds of different varieties using image analysis, Journal of Food Engineering, 99, 445–451. |
| [3] | Kara M., Sayinci B., Elkoca E., Öztürk İ., Özmen T. B., 2013, Seed size and shape analysis of registered common bean (Phaseolus vulgaris L.) cultivars in Turkey using digital photography, Tarım Bilimleri Dergisi – Journal of Agricultural Sciences, 19, 219–234. |
| [4] | Khoshroo A., Arefi A., Masoumiasl A., and Jowkar G.-H., 2014, Classification of wheat cultivars using image processing and artificial neural networks, Agricultural Communications, 2(1), 17–22. |
| [5] | Brosnan T. and Sun D. W., 2002, Inspection and grading of agricultural and food products by computer vision systems: a review, Computers and Electronics in Agriculture, 36, 193–213. |
| [6] | Koc A. B., 2007, Determination of watermelon volume using ellipsoid approximation and image processing, Postharvest Biology and Technology, 45, 366 –371. |
| [7] | Tahir A. R., Neethirajan S., Jayas D. S., Shahin M. A., Symons S. J., and White N. D. G., 2007, Evaluation of the effect of moisture content on cereal grains by digital image analysis. Food Research International, 40, 1140–1145. |
| [8] | Yan Z., Sousa-Gallagher M. J., and Oliveria F. A. R., 2008, Shrinkage and porosity of banana, pineapple and mango slices during air-drying, Journal of Food Engineering, 84, 430–440. |
| [9] | Tanska M., Rotkiewicz, D. Kozirok, and Konopka W. I., 2005, Measurement of the geometrical features and surface colour of rapeseeds using digital image analysis, Food Research International, 38, 741–750. |
| [10] | Bitjoka L., Boukar O., Tenin D., Mbofung C. M. F., and Tonye E., 2010, Digital camera images processing of hard-to-cook beans, Journal of Engineering and Technology Research, 2(9), 177–188. |
| [11] | Boukar O., Bitjoka L., and Djaowé G, 2013, Nondestructive Determination of Beans Water Absorption Capacity Using CFA Images Analysis for Hard-To-Cook Evaluation, International Journal of Electrical and Computer Engineering, 3(3), 317–328. |
| [12] | Del Moral F. G., O’Valle F., Masseroli M., and Del Moral R. G., 2007, Image analysis application for automatic quantification of intramuscular connective tissue in meat. Journal of Food Engineering, 81, 33–41. |
| [13] | Mendoza F., Dejmek P., and Aguilera J. M., 2006, Calibrated color measurements of agricultural foods using image analysis, Postharvest Biology and Technology, 41, 285–295. |
| [14] | Najafabadi S. S. M. and Farahani L., 2012, Shape analysis of common bean (Phaseolus vulgaris L.) seeds using image analysis, International Research Journal of Applied and Basic Sciences, 3 (8), 1619 – 1623. |
 Abstract
 Reference
 Full-Text PDF
 Full-text HTML