-
Paper Information
- Paper Submission
-
Journal Information
- About This Journal
- Editorial Board
- Current Issue
- Archive
- Author Guidelines
- Contact Us
Electrical and Electronic Engineering
p-ISSN: 2162-9455 e-ISSN: 2162-8459
2014; 4(2): 36-44
doi:10.5923/j.eee.20140402.03
Morphological Classification for Traffic Sign Recognition
 Abstract
 Reference
 Full-Text PDF
 Full-text HTML
Hai Nguyen Thanh
Faculty of Electrical and Electronics Engineering, HCMC University of Technical Education, Vietnam
Correspondence to: Hai Nguyen Thanh, Faculty of Electrical and Electronics Engineering, HCMC University of Technical Education, Vietnam.
| Email: |  |
Copyright © 2014 Scientific & Academic Publishing. All Rights Reserved.
In this paper, a novel method is proposed for the Traffic Sign Recognition (TSR) using the Principle Component Analysis (PCA) and the Multi-Layer Perceptron (MLPs) network. In particular to the proposed morphological classification method, the candidate signs are individually detected from two chrome components of the YCbCr space and then classified into three shape classes: circle, square, and triangle based on computing the rotated version correlations. The PCA-based features of these sign objects will be used for the MLPs as the training system corresponding to previously determined class. This approach not only reduces the time but also increases the performance in the recognition process. In simulation, the proposed method is estimated with over 500 statistic images and its accuracy rate is up to 96%.
Keywords: Traffic Sign Recognition, Principle Component Analysis, Multi-Layer Perceptron, Morphology Classification
Cite this paper: Hai Nguyen Thanh, Morphological Classification for Traffic Sign Recognition, Electrical and Electronic Engineering, Vol. 4 No. 2, 2014, pp. 36-44. doi: 10.5923/j.eee.20140402.03.
Article Outline
1. Introduction
- Intelligent Transport System (ITS) has become the great solution for drivers in protection and improvement of life in recent decades. As one of the important fields in the ITS, the traffic sign recognition system immediately represents the current traffic situation to give the warning from road signs [1-2]. In addition, it suggests drivers some useful advices for safety and convenience. In this paper, the morphological classification for traffic sign recognition is proposed to alert traffic participation.In feature extraction for recognition, Lafuente-Arroyo et al. [3] proposed an optimization in the traffic sign identification task on the spatial domain. It could be seen as the study of a Two-Dimension (2D) reduction method based on the Principle Component Analysis (PCA) for optimal recognition. In the letter [4], Deli Pei et al. extended the original unsupervised model with an additional supervised term to restrain the classification errors of the recovered feature representations, called the supervised low-rank matrix recovery model. As an effective method, the eigen-based Traffic Sign Recognition (TSR) [5] applied a PCA algorithm to extract the most significant components of the input images for categorization. A set of weights was computed from most effective eigenvectors of a database and then unknown objects would be classified using the Euclidean distances. The high accurate rate of this method is around 97%.In another feature extraction of various traffic sign shapes, the process sequence to extract traffic signs including color segmentation, shape simplification, and shape decomposition was presented [6]. The recognition was achieved through the direct matching to templates for closed candidate shape and computation of the minimum geometric difference between object and template for unclosed shapes. A novel approach to detect and recognize traffic signs based on ridge regression [7], in which a precise segmentation in the RGB color space was obtained with the same performance as other learning machines. In order to resist the illumination variations and distortions, features were extracted using the Otsu method for a recognition process. However, this method is inappropriate for the subsequent frames.Object recognition plays an important role in detecting traffic signs. One of recognition methods is that the Support Vector Machines (SVMs) for image detection and the Gaussian-kernel SVMs for content recognition have been utilized [8]. In detail, this SVM algorithm used the colour-based segmentation to identify all various shape signs such as, circular, rectangular, triangular and octagonal. Ke lu et al. [9] proposed a novel graph structure which is a balance between local manifold structures and global discriminative information of traffic signs. The result is that this algorithm allows to recognize traffic signs with better performance than the previous methods. As the main component of the Driver Assistant Systems (DAS) [10], a real-time traffic detection and classification method for circular and triangular signs was proposed using the HOG-based SVM algorithm.In order to improve the accuracy rate, the segmentation based on the enhancement of red color channel was utilized in an identification process using the tree classifiers. In addition, candidate regions as Maximally Stable External Regions (MSERs) [11] were automatically detected before they were recognized based on a cascade of the SVM algorithm. Another method is that the TSR was introduced as the Advanced Driver Assistance System (ADAS) [12], in which the combination of Viola and Jones (VJ) object detection and the Hue, Saturation, Intensity (HSI) colour space were represented. The detection process in this scheme found an optimal set of candidates using Adaptive Boosting (AdaBoost) cascades. Therefore, a hierarchy of the SVMs was employed to control the recognition of traffic sign types. A Multi-Column Deep Neural Network DNN (MCDNN) algorithm from 25 nets, 5 per pre-processing method was proposed to classify the German traffic sign with a recognition rate of 99.46%. Moreover, this method increases robustness to various types of noise [13]. Moreover, this network with 25 nets increased the recognition rate. In addition, a previous method for video detection of road signs based on computation of color eigenvectors was proposed [14], in which the candidate signs from road scenes were detected and a global model was built to detect and new road signs. Thus, all road sign candidates were recognized using the Radial Basis Function (RBF) network. Experimental results proved that this method for road signs detection is robust, powerful and accurate.In this research, a novel TSR method using the morphological detection and classification is proposed to identify candidate objects for recognition. Based on the examination of correlations of each object and morphological samples in rotation, the decisions for the class of these objects are made. Therefore, the recognition using the combination of the PCA and the MLPs network becomes easier and faster with the high accuracy rate. This paper is organized as follows: the section II described the proposed morphological detection and classification. The recognition based on the PCA-MLPs network will be represented in section III. Finally, the experimental results and the conclusion are written in section IV and V in this paper, respectively.
2. Morphological Classification
- Due to the chrome of traffic signs, the scheme, as shown in Fig. 1, for detection of doubt objects based on the Canny method for separated component in the YCbCr color space is proposed. The traffic signs are filtered by the scale condition to reject unsuitable objects and then they are classified into three classes by mapping their shapes to the samples.
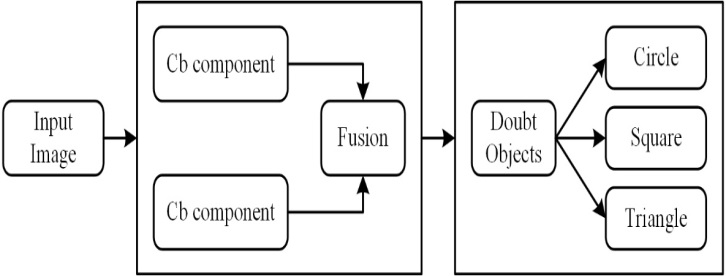 | Figure 1. Block Diagram of the morphological detection and classification of traffic signs |
2.1. Doubt Region Extraction Using Contrast Enhancement
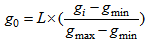
- In this research, the effective detection method based on the morphological analysis is applied. The innovation of this method is that candidate objects are detected and categorized based on the morphology to reduce the time and to also improve the accuracy rate of the recognition process. Thus, the Canny segmentation is employed as the edge detection to find edges by looking for the local maxima of the gradient magnitude. In particular, the level of edge can be controlled through the threshold value. In order to improve a capability of detecting more doubt objects, especially, the RGB color images with more colors are converted and then separated into three components: the luminance Y, the blue-difference Cb, and the red-difference Cr. The YCbCr-based analysis can be considered as the effective solution for the traffic sign system with red and blue colors using for most of signs as shown in Fig. 2. In order to enhance sign objects, the Cb and Cr components have been adjusted using the following equation:
 | (1) |
 | Figure 2. The Canny segmentation for two separated color components. The first one with the images (a), (b), (c): Cb-component; the second with the images (d), (e), (f): Cr-component |
 | (2) |
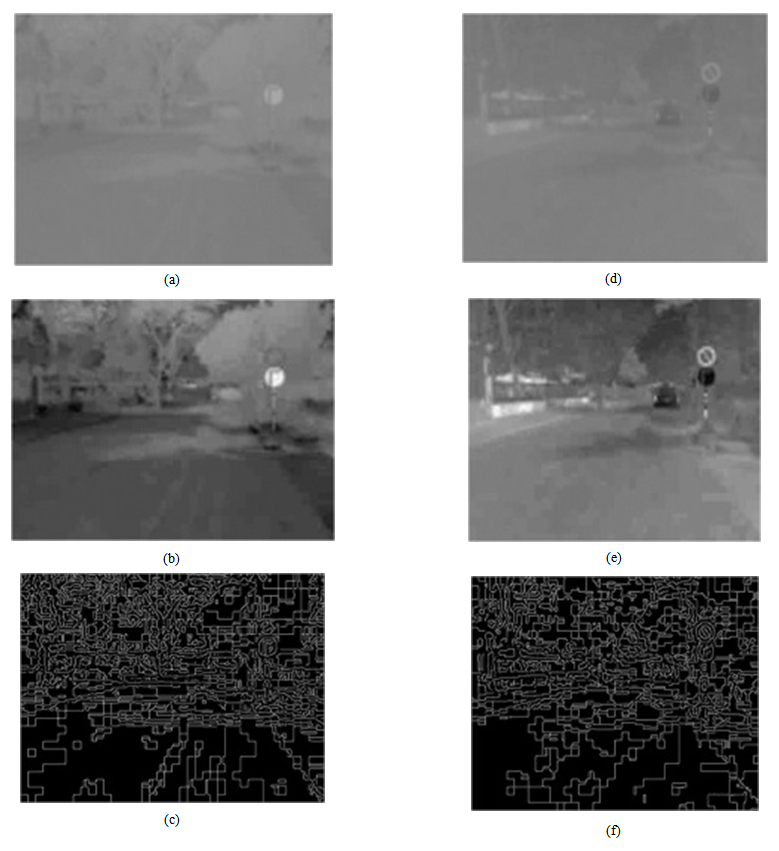
 | Figure 3. Detection of doubt regions based on the fusion of two Cb and Cr components, (a) Cb-component, (b) Cr-component, (c) The fusion image |
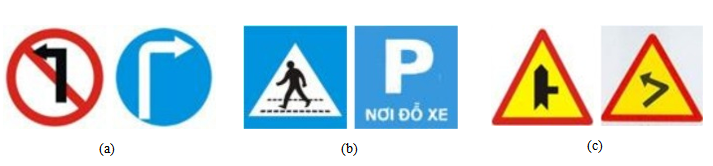
2.2. Morphological Classification Based on Correlation
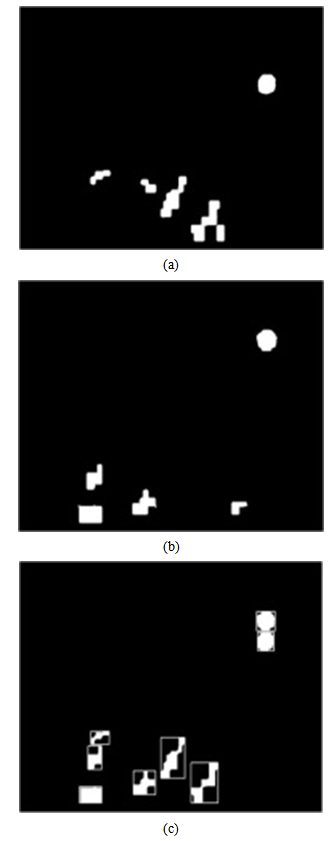
- These objects are individually extracted into the separated images and categorized based on their morphology. The main idea is comparing these objects with the samples corresponding to three classes such as triangle, circle, and square as shown in Figs. 4a - 4c. Classification of these objects, that can reduce the time of recognition on a neural network, can be listed in detail through the following steps:
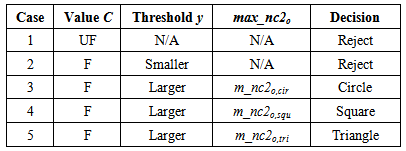
2.2.1. Removal of Objects with Unsatisfactory Size
- The bounding boxes of these objects as shown in Fig. 3c are usually the square (for circle or square signs) or the rectangle (for triangle signs). Therefore, the ratio of width , which has been set at the range
 , is written as follows:
 | (3) |
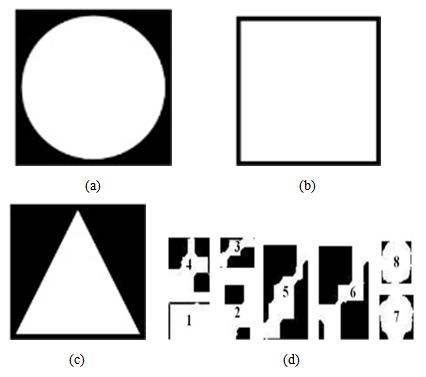 | Figure 4. Three samples corresponding to three groups for classification and the objects have been extracted as the individual images, in which (a) Triangle, (b) Circle, (c) Square, (d) 8 Doubt Objects |
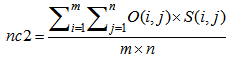
2.2.2. Computation of the Normalized Correlation Factors
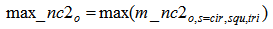
- The basic ideal is that the correlations of the doubt objects are compared with each sample for categorization. In particular, both sample and object can rotated with the angle α=30 degrees for determination of the correlation factors. The decision object class is calculated using the following average equation:
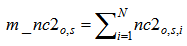 | (4) |
 | (5) |
 | (6) |
|
|
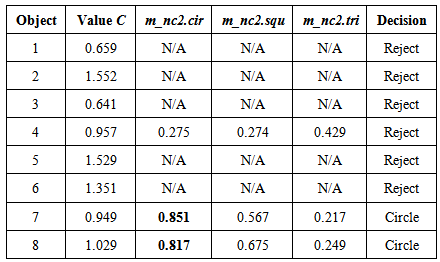
 | Figure 5. Normalization of two extracted objects based on their positions: (a) Cropped version, (b) Gray-scale version, (c) Normalized version |
3. Traffic Sign Recognition Using PCA-MLPs Algorithm
- For the recognition problem in this paper, the authors used the PCA algorithm to extract features traffic sign image which then can be propagated on the MLPs network with the previous trained set. In order to be more details, the recognition algorithm is described in Fig. 6.
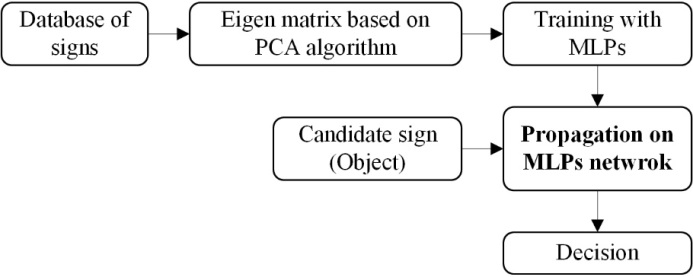 | Figure 6. Block diagram of recognition based on the PCA-MLPs algorithm |
3.1. PCA Algorithm for Sign Images
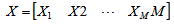
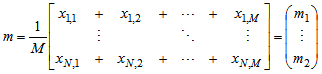
- In recent years, the Principal Component Analysis (PCA) that alters the data into the new structure based on its variance has been used as the solution for face recognition [9] and others. In particular, a 2-D image is represented as a 1-D vector by concatenating each column (or row) into the vector as follows:
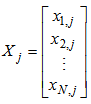 | (7) |
 | (8) |
 | (9) |
 | (10) |
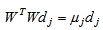 | (11) |
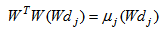 | (12) |
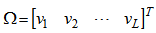 | (13) |
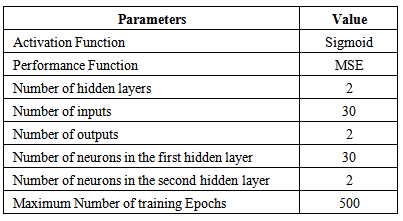
3.2. MLPs Neural Network
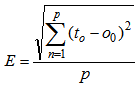
- The Multi-Layer Perceptrons (MLPs) have been assigned to implement the recognition core after feature extraction. As the improvement of original perceptrons, the MLPs have been upgraded by cascading one or more extra layers [10], called hidden layers, which are not directly connected to the external environment. The main algorithm of the MLPs learning is the propagation of the error backwards. This method can be shown briefly as the following steps: Correction of the output layer of weights using the following formula:
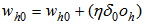 | (14) |
 | (15) |
 | (16) |
 | (17) |
 | (18) |
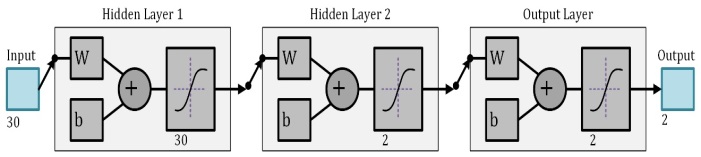 | Figure 7. Structure of MLPs network for each class |
|
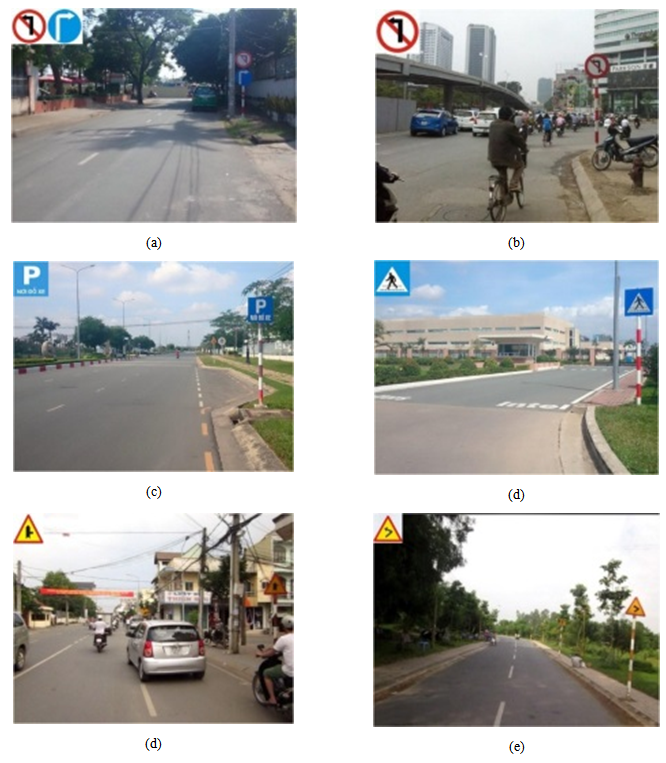
4. Experimental Results and Discussion
- Simulation results of the proposed method for statistic images are represented. There are over 500 test images (150 for circle, 200 for square, and 150 for triangle) from urban areas and suburbs used for evaluation of 6 traffic signs with three classes. Fig. 8 shows the traffic signs which need to be recognized and Fig. 9 represents some original samples of recognition. In particular, the traffic signs were effectively recognized and shown on top left corner of each image.
 | Figure 8. Set of traffic signs used for evaluation |
 | Figure 9. Result of simulation with some sample images |
|
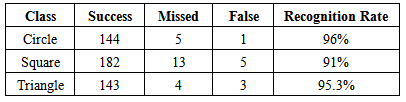
5. Conclusions
- In this research, a novel traffic sign recognition method was represented using the PCA-MLPs algorithm with two main issues of the morphological detection and classification. In particular, the sign objects were separately determined from two chrome components of the YCbCr space and then categorized into three classes: triangle, circle, and square by computing the correlations of these objects and samples in different rotated versions. The result is that the PCA-MLP- based recognition is implemented simpler and faster for the classification. In addition, the method was evaluated on statistic images captured on Vietnam roads with complex different conditions, but the high accuracy rate obtained is up to 96%. Simulation results have proved the effectiveness of the proposed approach.