Hilmi Zenk1, A. Sefa Akpinar2
1Vocational School of Technical Sciences, Giresun University, Gazipasa Campus, Giresun, 28200, Turkey
2Department of Electrical and Electronics Eng., Eng. Faculty, Karadeniz Technical University, Kanuni Campus, Trabzon, 61000, Turkey
Correspondence to: Hilmi Zenk, Vocational School of Technical Sciences, Giresun University, Gazipasa Campus, Giresun, 28200, Turkey.
| Email: |  |
Copyright © 2012 Scientific & Academic Publishing. All Rights Reserved.
Abstract
The Transformers in the power system is one of the most widely used elements. Transformers working in the linear region with a yield of electromagnetic energy provides a high rate conversion. However, with the onset of saturation of the transformer ferromagnetic core begins to fall due to the efficiency of energy conversion losses start to increase. Any power system elements constituting a sudden ferrorezonans are enough potential for the realization of the event. These elements of the transformer inductance and non-linear loads can be summarized in the resistance and capacitance. In this study, high-voltage transmitter to the controlled switched my order to make semiconductor power electronic switching elements connected with the resistance and capacitance cargoes including ferroresonance instantly switches opening and closing built resonance will occur in the electrical events, actual circuit conditions were investigated.
Keywords:
Ferroresonance, Overvoltage, Switch angle position (SAP), FFT Analysis
Cite this paper: Hilmi Zenk, A. Sefa Akpinar, High Voltage Instrument Transformers Ferroresonance Events Occurring in the Investigation of the Circuit Breaker Switch Positions, Electrical and Electronic Engineering, Vol. 4 No. 1, 2014, pp. 10-19. doi: 10.5923/j.eee.20140401.02.
1. Introduction
In recent years, the rapidly growing energy needs and, in parallel, rising energy prices and environmental factors such as pollution, renewable energy sources and in particular to people in proportion more efficient use of the energy produced is headed.Renewable resources is continuous and does not cause environmental pollution in this area has attracted the attention of many researchers. However, if the energy produced in whatever way you produced, reducing losses and improving the quality of power is an area that is always worth working on.Determines of the power quality their basic components, electrical energy supply continuity, frequency, voltage effective value of the voltage transient period occurs because the pits and hills, sudden voltage changes between phases unbalance, voltage and current waveforms that occur in harmonics and flicker as listed[1].Electric power generation, transmission and distribution is a very complicated process. Transmission line; generators, transformers, capacitors, there are loads of protection elements. In such a transmission system, the presence of such elements or some malfunction of the circuit in the event of different work situation can cause various physical events[2]. One of these events, many researchers focus on is the Ferrorezonans event. Transformer in a power system where you will also remain disabled even with some of the load groups or ferroresonance can occur with very little loading[3]. Ferroresonance having a wide variety of events, generally iron-core coil with saturable occurring between capacitors known as nonlinear resonance condition[4].In the case of ferroresonance, overvoltage and very irregular wave patterns revealing these cases, one or more may be saturated inductance in series are often stimulated by the co-located with capacitive circuit occurs[5]. Power transformers, reactors, transformers and electromagnetic voltage measurement will be effective until the system is inherently included in the system which is in close proximity capacitive elements occurs between[6]. Ferroresonance in electric power systems are known for many years that the event has occurred. Ferroresonance to understand and analyze a variety of models are used[7].Hayashi almost periodic solutions of nonlinear differential equations to do is use the harmonic balance method[8]. Depending on the frequency content of the fluctuations normally harmonic ferroresonance basic, sub-harmonic, quasi-periodic and can be classified as irregular ferroresonance[9]. In this study, a single-phase system on the high-voltage instrument transformers with a real ferroresonance event which is formed, the system's electrical parameters were analyzed and the results interpreted and ferroresonance effect consisting of the various current and voltage waveforms are analyzed.In addition, the same system in Matlab/Simulink was created as a virtual digital environment, again mentioned parameters were examined and comparing this with the results of real circuits.The effect of power systems ferroresonance transformers, transmission lines and can be devastating on all equipment [10]. Because ferroresonance events occurring on the system during the nominal voltage surge may reach levels about three times[11].
2. Ferrorezonans Equivalent Circuit Model
Figure 1 in the non-linear inductance and parallel resistance are shown in parallel with the transformer. 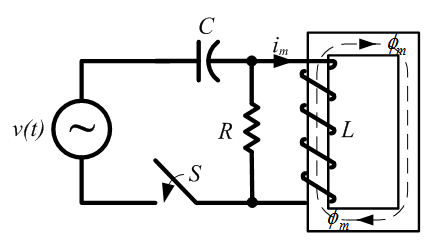 | Figure 1. Ferrorezonans Analysis of RC Circuit Models |
Hysteresis losses are neglected, so the total iron loss resistance shows. The core of the non-linearity is given in equation (1).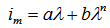 | (1) |
C capacitor, supply voltage and frequency are affected. Source voltage,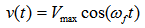 | (2) |
is defined by the expression. Duffing, resonance, sub-and super sub-ferroresonance rezonans resonance of the first researchers who work on issues and evidence given by equation (3) can be likened to the Duffing oscillator[12-15]. In equations "n" indicates the degree of expression magnetization. 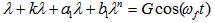 | (3) |
The other parameters of the equation, k, a1, b1 and G equations (4-7), respectively. | (4) |
 | (5) |
 | (6) |
 | (7) |
3. Designed System Model
Models of the computer system and the actual system designed using the same parameters in this section are individually designed.
3.1. Matlab/Simulink Model
Power system modeling using Matlab / Simulink are used. In this study asarlan ferrorezonans event that occurs on the system in Matlab / Simulink simulation was performed in the circuit model shown in Figure 2.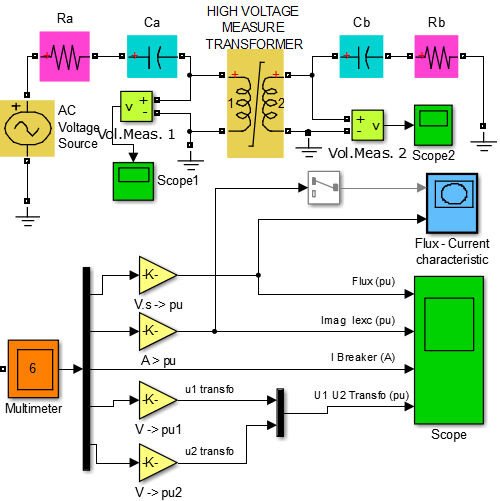 | Figure 2. Ferrorezonans Circuit Simulink Models |
The parameters of the voltage transformer used in the circuit is shown in Figure 3. | Figure 3. The parameters of voltage transformer |
3.2. Real-Circuit Model
Designed as the first element in the system, the mains voltage is logged and the system should be replaced when the voltage level of the AC voltage supply circuit is prepared for the adjustment. The purpose of this circuit is used, the actual voltage levels of the circuit to ensure operation of the second voltage transformer primary to provide a first transformer to the ends of the standard voltage is controlling. Designed for high voltage transformer isolated and regulated power supply circuit in Figure 4 is given.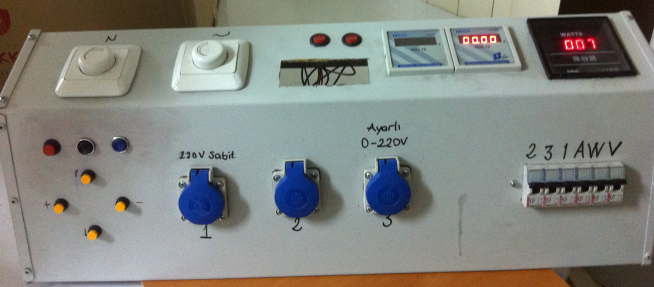 | Figure 4. Isolated and regulated power supply circuit |
The first voltage transformer, booster transformer (T1) was used. T1 analyzed for the purpose of using ferrorezonans second voltage transformer (T2) in the actual system voltage insulation is to keep running and circuits. T2 obtained after the high voltage of 31.5 kV Ferroresonance circuit of the second voltage transformer primary is connected to the ends to the ends that the AB. The second voltage transformer ferrorezonans event is tested and the main system components. The secondary of the second voltage transformer with the first two corners, at the ends 110V 1a-1b, 2a-2b and the second of its ends, which is measured at 220V. So the second voltage transformer voltage will be used as stepdown.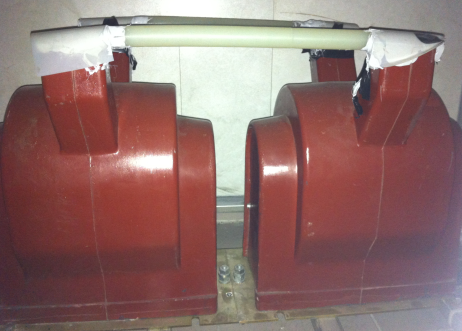 | Figure 5. System used in voltage transformer and connections |
3.3. Microcontrollers Based On-Off Switch Angle Control System (MACS)
Angle control system, the microcontroller is controlled by a power electronic circuit switch, connects the phase voltage measured and the desired phase angle a keypad entered with switch-on or switch-off function which is a system. This system firstly Figure 6. as seen in the circuit produced with the aid of the sampling point, is sent to one of input ports of the microcontroller. Sampling the form of a square wave signal at the output of the circuit is embedded in the program and not the mark of a variable defined time to start counting results.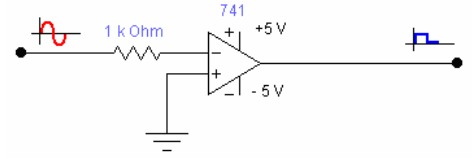 | Figure 6. Sampling circuit |
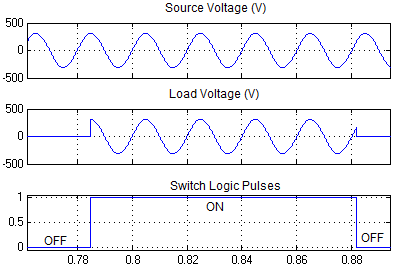
Figure 7 in terms of switching control system block diagram is shown. Figure 8 in the supply voltage to the load is connected MACS connecting key generates a shutdown signal with a delay of 90 electrical degrees seen. The same circuit breaker switch with a delay of 30 degrees to produce the trip signal is observed. Several key points of the system for measurement of electrical parameters of Figure 9 seen in current and voltage as hall-effect sensors are used.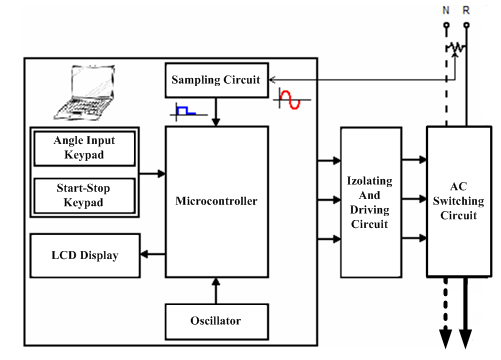 | Figure 7. Switching angle control system block diagram |
 | Figure 8. Voltage and Current Sensor Circuits |
 | Figure 9. Voltage and Current Sensor Circuits |
The sensor outputs data in the DAQ-PCI-6221 data collected from the system by the transmission device and located at certain points of the system controlled on-off switch at the desired angle to do is send the control signals.Ferrorezonans first event with this system through the computer monitoring, data recording in the user wants, then the system will react in different closing angles has been observed. All of the design of the system, the main block diagram of Figure 10 seen from. | Figure 10. All the main block diagram of the system |
4. System Simulation and Real-Time Results
4.1. System Simulink Model Results
Figure 11 at 33 kV system, the voltage time curve is observed. In closed position switch voltage of capacitor (Vca) 200 milliseconds were measured.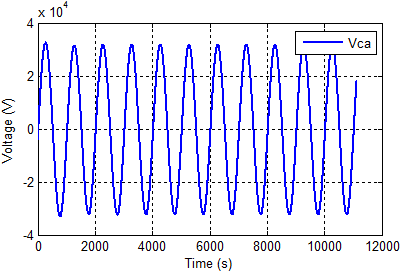 | Figure 11. Voltage of Ca capacitor (Vca) |
In Figure 12 typical ferrorezonans voltage graph is shown. Following the opening and closing of the switch to make changes in the system parameters shown 0.2 seconds.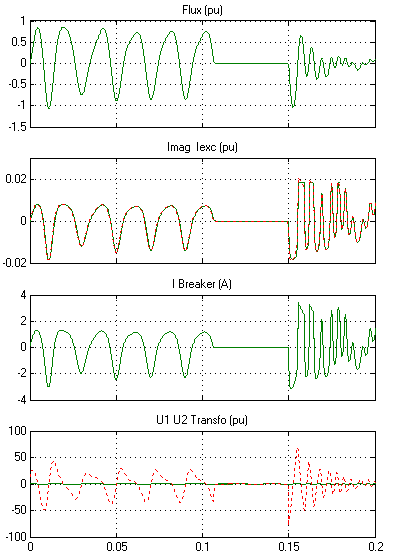 | Figure 12. Some of the electrical parameters of the transformer change |
The model of the FFT analysis for the Ca capacity is given in the chart in figure 13. As will be seen from the chart, there are regions of high frequency during starting. Here, near normal or low frequency region around 12 kV while there are 3-6 kV high frequencies in the band 25-35 kHz were observed. 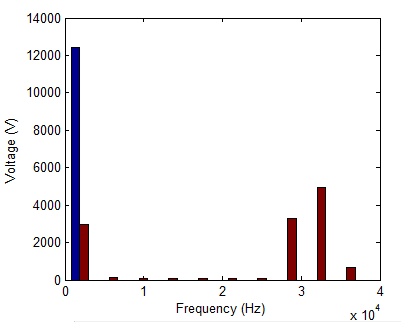 | Figure 13. Ferrorezonans case Ca capacitor FFT analysis |
Analyzing figure 14 shows a diagram of transformer input voltage (e1) is derived from. In the chart, his on-off switch regions is natural that during the high-voltage on-off voltage, then returned to the pre-condition that has been shown to return between 5-6 kV. However, the sudden closing time of rising tension will damage the components on the system, which leads indeed is a serious malfunction.In figure 15 the frequency of the voltage applied to input transformers analysis chart is shown.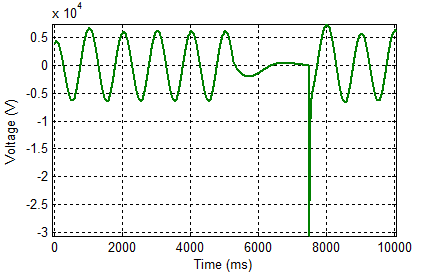 | Figure 14. Ferrorezonans case input voltage (e1) FFT analysis |
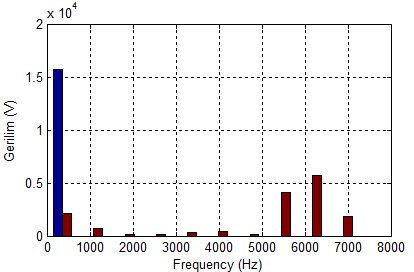 | Figure 15. Ferrorezonans case input voltage (e1) FFT analysis |
As can be seen from the chart 15-16 kV voltage level of high frequency components during the initial steady state shows the frequency at which to get. If the voltage and frequency ranges to be considered together.
4.2. Real System Model Results
In Figure 16 typical on real system ferrorezonans - voltage graph is shown. Following the opening and closing of the switch to make changes in the system parameters shown 0.2 seconds.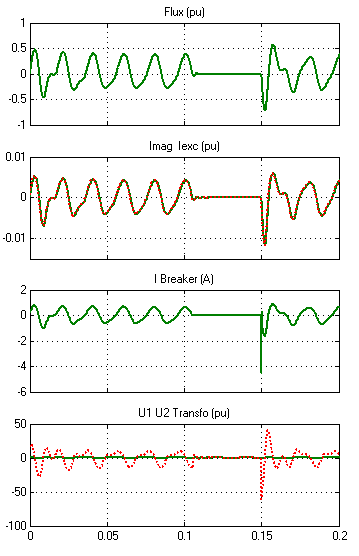 | Figure 16. Some of the electrical parameters of the transformer change |
The model of the FFT analysis for the Ca capacity is given in the chart in figure 17. As will be seen from the chart, there are regions of high frequency during starting. Here, near normal or low frequency region around 12 kV while there are 2-4 kV high frequencies in the band 27-37 kHz were observed. 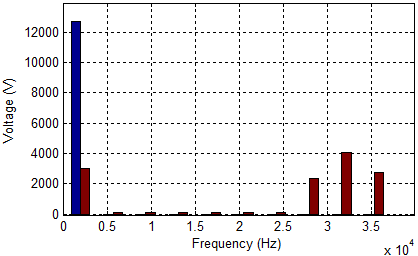 | Figure 17. Ferrorezonans case Ca capacitor FFT analysis |
Analyzing figure 18 shows a diagram of transformer input voltage (e1) is derived from. In the chart, his on-off switch regions is natural that during the high-voltage on-off voltage, then returned to the pre-condition that has been shown to return between 2,5-3,5 kV. However, the sudden closing time of rising tension will damage the components on the system, which leads indeed is a serious malfunction. 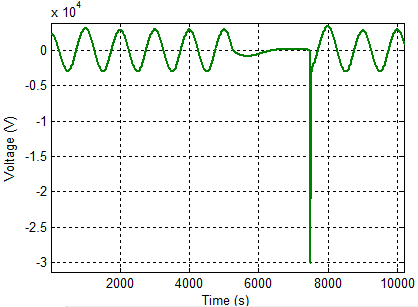 | Figure 18. Ferrorezonans case input voltage (e1) FFT analysis |
In figure 19 the frequency of the voltage applied to input transformers analysis chart is shown. As can be seen from the chart 4-6 kV voltage level of high frequency components during the initial steady state shows the frequency at which to get. If the voltage and frequency ranges to be considered together.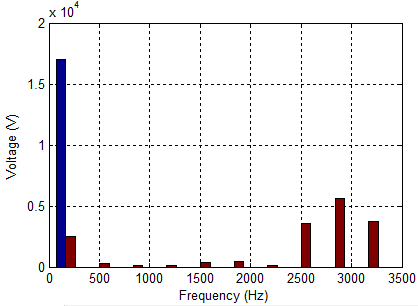 | Figure 19. Ferrorezonans case e1 voltage FFT analysis |
5. Breaker Switch Positions Effect
To understand the impact of circuit breaker positions in the real system and the simulation is connected to switches as desired measure the voltage of the phase conductor with an electrical delay closing (ON) or open (OFF) process operate. As a result of this process is affected by how ferrorezonans are described.
5.1. System Simulink Model Results
Matlab / Simulink environment prepared circuit in Figure 20 is observed. At certain points of the system designed for small electrically capable of closing and opening switches have been placed in between the keys 0 to 360 degrees making the effects of opening and closing operations are discussed below.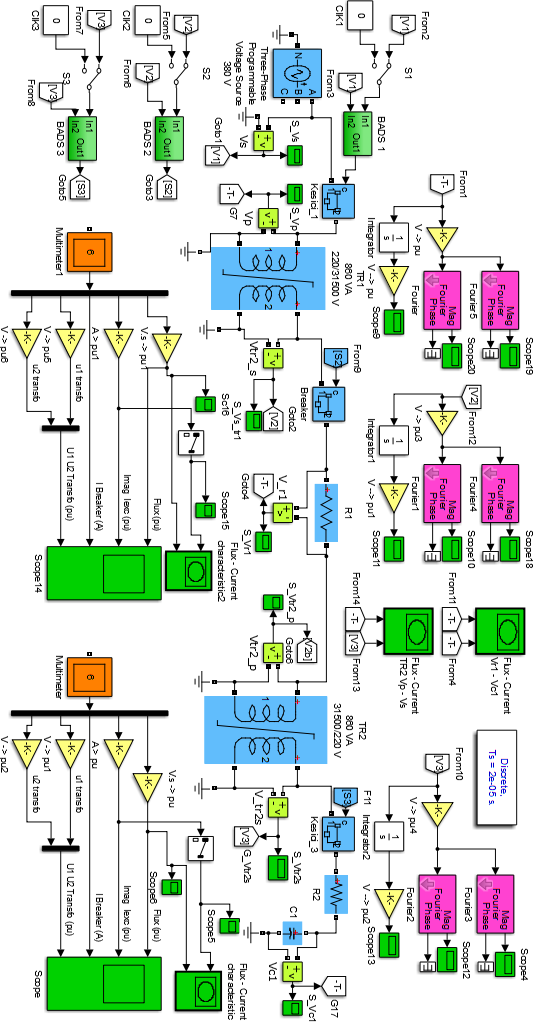 | Figure 20. HV Transformer Ferrorezonans Circuit Simulink Models |
 | Figure 21. a) Random signals from the operator, BADS1 controlled closing-opening angle signal generating block, b) BADS1 block, which produces angle-controlled signals. According to the power supply seems to be closing 30º opening 60º |
In Figure 22 TR1 transformer some parameters graph is shown. Following the opening and closing of the switch to make changes in the system parameters shown 0.2 seconds. Circuit breaker switch to the OFF position memory, sinusoidal shape of the current drawn by the load is at a certain level coincided skyrocket in cases where it is seen that all the parameters in the circuit.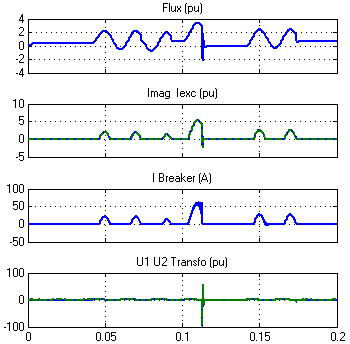 | Figure 22. Some of the electrical parameters of the TR1 transformer change |
Figure 23 Magnetic Flux and TR2 of the voltage transformer, magnetizing current, excitation current, Cutter Current, Primary and Secondary Voltage is seen as a very parameters. In a similar manner to the TR1 here breaker switch to the OFF position instantly more normal state of all parameters, which rises up to 4-5 times.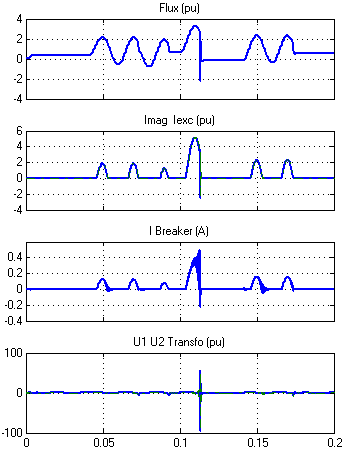 | Figure 23. Some of the electrical parameters of the TR2 transformer change |
In the conditions described above in Figure 24, step down transformers in the system in which the on-off hysteresis exchange is formed. When examined in detail here the hysteresis loop, the inner loop can be seen. This small inner loop of the harmonics in the voltage signal, the peak in the current signal can be said that the reason that the current signs.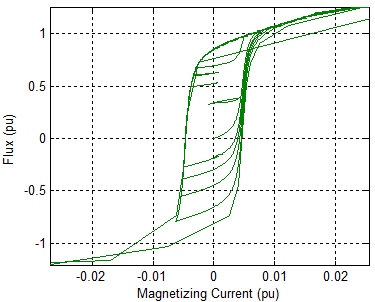 | Figure 24. TR2 voltage transformer, hysteresis loop |
5.2. The Actual System Model Results
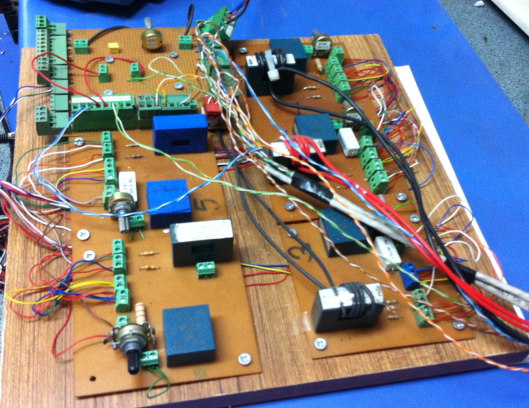
In this section simulation partition on the system design, with the circuit breaker switch 30º as in the opening angle, closing angle, and 60º a number of times with the result obtained when switching is given.Sensor circuits experimental system, is prepared, ferrorezonans circuits, IGBT switches and drive circuits symmetrical DC supply source, the measurement panel, such as segments forming system is shown in Figure 25.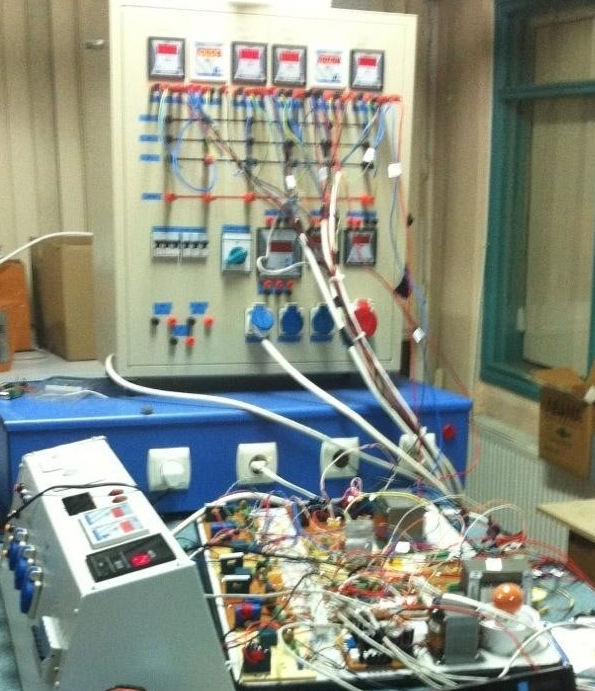 | Figure 25. Images of experimental embodiment of the system is prepared |
Figure 26 in the closing-opening signal to the electronic key with the key generated by the PWM signal is observed.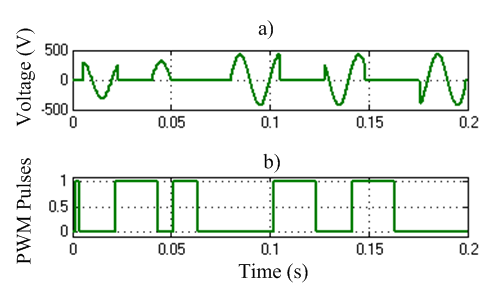 | Figure 26. a) Random signals from the operator, MACS controlled closing-opening angle signal generating block, b) MACS block, which produces angle-controlled signals. According to the power supply seems to be closing 30º opening 60º |
Similarly in Figure 27 TR1 transformer some parameters graph is shown. Following the opening and closing of the switch to make changes in the system parameters shown 0.2 seconds. Circuit breaker switch ON-OFF operation of the random in his extreme elevations in these times of unprecedented signal causes the current value of these transactions has decreased is the time to have done recently.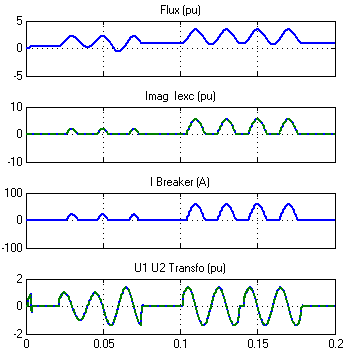 | Figure 27. Some of the electrical parameters of the TR1 transformer change |
Figure 28 and TR2 of the voltage transformer, Magnetic Flux, magnetizing current, etc very parameters. In a similar manner to the TR1 here breaker switch to the OFF position instantly more normal state of all parameters, which rises up to 3 times. | Figure 28. Some of the electrical parameters of the TR2 transformer change |
In the conditions described above in Figure 29, step down transformers in the system in which the on-off hysteresis exchange is formed. When examined in detail here the hysteresis loop, the inner loop can be seen. This small inner loop of the harmonics in the voltage signal, the peak in the current signal can be said that the reason that the current signs.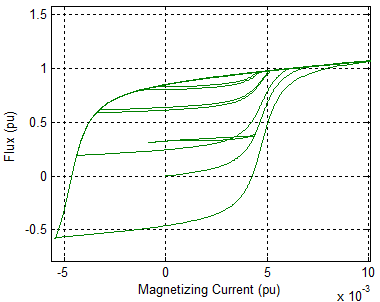 | Figure 29. TR2 voltage transformer, hysteresis loop |
6. Conclusions
Energy-carrying systems, which have devastating effects ferrorezonans event, the impact on a single-phase system was investigated. In this study, a 33kV transmission system Ferrorezonans event Matlab/Simulink modeling with the program and establishing a real comparison of models is provided.FFT analysis of harmonics that occur in the system modeling been done and the results of these analyzes also are evaluated. Whether on energy systems in the analysis consists ferrorezonans With the high frequency components have emerged.Switch opening and closing cycle is completed with the next FFT analysis in the range of 3-6 kV voltage, high-frequency component at the level of 5-7kHz who is dominant. Wherein the particular frequency contained study is shown. Very high amplitude on the frequency to 5000Hz, although there are very few seen. These frequencies are likely to be inter-harmonics. With Ferrorezonans event has occurred on the system frequency of 50Hz is in excess of the high frequency components.Simulation and genuineness of the closing-opening angle on the system control and the results were similar in terms of opening and closing of the system when it is the smallest mark to be made, it is concluded that.
References
| [1] | S. Akpinar, S.A. Nasar, Harmonic Balance Analysis of the Subharmonic Ferroresonance, Electric Machines And Power Systems, Vol.18, pp.409-428, 1990. |
| [2] | E. Barbisio, O Bottauscio, M. Chiampi, G. Crotti, D. Giordano, Parameters Affecting Ferroresonance in LCR Electric Circuits, IEEE Transactions On Magnetics, Vol:44, No:6, June, 2008. |
| [3] | K.Al-Anbarri, R. Ramanujam, , CH. S. Rao, K. Kuppusamy, Effect of Circuit Configurad On on Chaotic Ferroresonance in Power in a Power Transformer, Electric Power Components and Systems, 30 pp:1015-1031, 2002. |
| [4] | P. Ferracci, Ferroresonance Cahier Technique Schneider, Vol.190, 1998. |
| [5] | M. R. Iravani, Modelling and Analysis Guidelines for Slow Transients – Part: The Study of Ferroresonance. IEEE Transactions on Power Delivery, Vol.15, No.1, pp.255-265, 2000. |
| [6] | Y.K. Tong, NGC Experience on Ferroresonance in Power Transformers on HV Transmission Systems. IEE, Savoy Place, IEE Colloquium on Warning, Ferroresonance Can Damage Your Plant Londra, 1997. |
| [7] | T. Ta-Peng and N. Chia-Ching, Analysis of Ferroresonant Overvoltages at Maanshan Nuclear Power Station in Taiwan, IEEE Transactions On Power Delivery, Vol.21, No.2, pp.1006-1012, April 2006. |
| [8] | D.A. Jacobson, D.R. Swatek, R.W. Mazur, Mitigating Potential Transformer Ferroresonance in a 230kV Converter Station, Computer Analysis of Electric Power System Transients: Selected Readings. IEEE Press. Pp.359-365, 1997. |
| [9] | A.M. Haşimov, A. Nayir, Y.V. Dimitriyev, Uzun Enerji İletim Hatlarında Yüksek Harmonikli Ferrorezonans Aşırı Gerilimlerinden Korunma, Yıldız Teknik Üniversitesi Dergisi, Vol:2, pp.19-24, 2001. |
| [10] | R.G. Kavasseri, Analytical Prediction of Subharmonic Oscilations in a Ferroresonant Circuit, Proc. 35th North American Power Symposium, Rolla, Missouri, October 2003. |
| [11] | A.H. Nayfeh, Introduction to Perturbation Techniques. John Wiley and Sons, 1981. |
| [12] | T. Ç. Akıncı, G. Morkyani, G. Gökmen, N. Ekren, S. Şeker, Analysis Of Ferroresonance On Single Phase Line Model, 5. Uluslararası İleri Teknolojiler Sempozyumu (IATS’09), 13-15 May. 2009, Karabük, Turkey. |
| [13] | Ö. Kara, M. Bağrıyanık, Ferrorezonansin Anlaşilmasi Ve Transformatör Merkezlerinde Yapilan Kompanzasyonun Ferrorezonans Üzerindeki Etkileri. |
| [14] | A. Nayır, Research And Protection Of Energy Transmission Lines From The Ferroresonance Overvoltages, Journal of Engineering and Natural Sciences, Sigma 29, pp.138-147, 2011. |
| [15] | Türkiye Elektrik İletim A.Ş., Online available from http://www.guckalitesi.gen.tr/tr/root/index.php |
 Abstract
 Reference
 Full-Text PDF
 Full-text HTML