Adetona Z. A.1, Koledoye T. O.2, Alebiosu M. I.2
1Electrical EngineeringDepartment, Federal Polytechnic, Ilaro, P.M.B. 50, Nigeria
2Electrical/Electronic Engineering Department, Yaba College of Technology, Lagos, P.M.B. 2011, Nigeria
Correspondence to: Adetona Z. A., Electrical EngineeringDepartment, Federal Polytechnic, Ilaro, P.M.B. 50, Nigeria.
| Email: |  |
Copyright © 2012 Scientific & Academic Publishing. All Rights Reserved.
Abstract
This paper evaluates the reliability of The International Radio Consultative Committee (CCIR) curves in Nigeria for television signal broadcast planning by determining the practical broadcast coverage of seven television stations in Lagos State to identify the reach of their transmission and determine the geographical zones where frequency allocated can be re-used. The field strength meter was utilized to take electrical field strength of the transmitted signal of each station in several locations in Lagos State. The result shows that the CCIR curves are not totally reliable for television broadcast planning. For effective television broadcast planning, television broadcast zones should cover broader geographical areas for proper frequency re-use.
Keywords:
Television broadcast, Frequency re-use, CCIR curve, Field strength
Cite this paper: Adetona Z. A., Koledoye T. O., Alebiosu M. I., Television Broadcasting Transmission in Nigeria: Application of Technical Data for Re-Planning, Electrical and Electronic Engineering, Vol. 3 No. 6, 2013, pp. 173-177. doi: 10.5923/j.eee.20130306.05.
1. Introduction
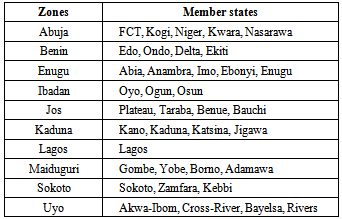
An aspect of communication involving the transmission of both vision and sound is referred to as television (TV) broadcasting. According to (Grob and Herndon, 1999), “television means to see at a distance" while the term “broadcast means to send out in all directions”. Thus TV broadcasting involves sending out vision and sound signals omni-directionally. TV broadcasting in Nigeria began in the year 1959 when the Western Nigeria Radio Vision Service was established in Ibadan by the then Nigerian Western Region headed by the first Western Region premier, Chief ObafemiAwolowo[1].Since that time, there have been many TV stations both private and government-owned, established to transmit pictures and sound for the benefit of the Nigerian populace. Presently, all these TV stations in Nigeria are grouped into ten zones. These zones are as given in Table 1. It can be observed from the table that Lagos zone comprises of TV stations in Lagos State alone. This is because in Lagos State alone, there are eighteen analog TV stations – 13 private and 5 government-owned at present. And there are other five being proposed. These do not include 7 other cable (digital) stations located in the state. Television broadcasting in Nigeria has come of age and need to be planned and executed with all possible accuracy and effectiveness. According to Egbon (1982), “television transmission service which was initiated by a Regional Government was not only the first in Nigeria, but remains today the oldest in the whole of African continent”[2],[3],[4]. Television has since its advent in Nigeria contributed to the educational development of the Nigerian citizens[5]. In view of this, re-planning for effective transmission is necessary.
2. Application of Frequency Re-use to TV Broadcasting
The demarcation of TV transmission zones and establishment of a TV station require adequate knowledge of signal transmission, terrain of transmission and frequency re-use. The incorrect allocation of frequency blocks may not only cause interference in the home country but even at VHF and UHF, between adjacent countries[5]. Also required is the knowledge of broadcast coverage areas which are defined as follows:primary coverage area which comprises of areas where the field strength of a particular station, E reduces to 2.5mV;secondary coverage area, an area where the electric field strength, E reduces to 1mV;fringe coverage which denotes any area where the signal is received and E is less than 1mV.The organization saddled with the job of demarcation of TV zones and allocation of frequency locally is the Nigerian Communication Commission (NCC). On the international scene, the International Telecommunication Union (ITU) is saddled with the same assignment. The ITU relies on the technical information received from the International Radio Consultative Committee (CCIR) an organization concerned with various radio services on a global scale[6]. According to Black (1985), “the basic main station UHF TV plan was agreed between 35 countries at a conference in Stockholm in 1961 while a similar plan in Africa was agreed at a corresponding conference in Geneva in 1963”[7]. The international agreement reached included on frequency allocation, maximum antenna height and radiated power to be allowed for the main stations.Table 1. TV Broadcast Zones in Nigeria
 |
| |
|
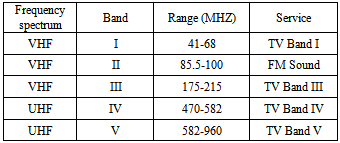
The work of allocation of frequencies to different nations is a serious business because of the alarming rate of exploration in the recent century as the development in frequency propagation has grown with advances in technology. The portion of the radio frequency spectrum often utilized for analog TV transmission is limited to the very high frequency (VHF) and the ultra-high frequency (UHF) range shown in Table 2[8]. As shown on the table, there are four bands of frequencies used for TV signal transmission in the frequency range of 41MHz to 960MHz. The four bands of frequencies can be allocated to limited number of countries. Thus, before a frequency can be used in any country, the radio spectrum regulation stipulates that an approval must be given by the ITU since the radio spectrum is a fixed commodity.In order for the ITU to meet the demands on frequency allocations from several countries in the world and in order to overcome the problems of over demanding, the organization has resorted to repeating frequency assignments to different nations. This is called frequency re-use. Simply put, frequency re-use in TV broadcasting is such that if a range of frequency (for example TV band IV on Table 2) is allocated to a country in Europe, the same band can be allocated to other countries say in Africa, America, Asia, Australia orEurope itself to be re-used for local TV signal transmission without any transmission problems occurring due to repetition of frequency by different countries. This repetition of frequency is only possible when the TV signals in one country does not radiate or overlap into neighbouring countries so as to avoid the problem of co-channel interference. To determine how far the signals transmitted from a TV station, with a transmitter of known power rating reach, the CCIR has developed transmission sets of guides otherwise called the CCIR curves. The ITU and other national telecommunication bodies all over the world rely on these curves for their TV broadcast planning.As the radio spectrum is a limited commodity on a global scale, so it is on local or national scale. Each country is restricted to a particular band of frequencies for its TV signals transmission. Thus, if there are many TV stations in a country of wide geographical area, the local TV planning body will employ the process of frequency re-use in different parts of the country. For example in Nigeria, TV bands III to V in Table 2 are often used for TV broadcasting. These bands of frequencies are allocated to the ten TV zones by the NCC. Thus, if a TV station broadcasts at say 565.5MHz UHF in Lagos State, another station in Ogun, Benue, Abia, Sokoto or any other state from another transmission zone different from Lagos can broadcast at the same frequency provided no other TV station is allocated to use that frequency within the same zone. The allocation of frequencies to different stations is carried out by the NCC in conjunction with other groups such as the National Broadcasting Commission (NBC) and the broadcasting Organization of Nigeria (BON).Table 2. Frequency allocation for TV broadcasting[6]
 |
| |
|
3. Materials and Method
Seven public and private TV stations were focused in Lagos State Nigeria. These stations along with their technical transmission data appear on Table 3. A primary factor affecting the reach of signal transmitted from any transmitter is the transmitter power[9]. As can be observed from the table, the transmitter power output of the seven TV stations varies from 5-40kW. Thus, a varied level of TV coverage is expected from the individual stations.The field strength meter was used to measure the signal strength of each of the seven TV stations at fifty different locations within Lagos State. The meter was manually tuned in to the desired frequency of the TV station of interest. It then displayed the sound and pictures of the TV station and also indicated the electric field strength value in V/m of the signal transmitted at every location. It was possible to tune the meter to a particular station since the transmission frequency of each station had previously been obtained from the regulatory authority (NBC). Each value of electric field strength measured was used to determine the coverage distance, d from the antenna of each TV station according to the relation[10]: | (1) |
Where E = electric field strength, V/m Pt = effective radiated power, W
 d = coverage distance in metersAlso, each measured value was converted to its dB equivalent using the relation:
 | (2) |
wherey = field strength in dB rel. 1µVx = field strength in voltsThe expression is normalized by dividing with 10-6 as shown because the dB power is relative to 1µV. Then the corresponding coverage distance was looked up from CCIR curves. For dB values whose corresponding values were not found on the CCIR curves, method of extrapolation was employed using the following relation:x2 = the unknown coverage distance at the specified E (dB)x3 = coverage distance of h3 at specified E (dB) rel. to 1µV | (3) |
From equation (3) the unknown coverage distance x2 can be determined as | (4) |
whereh1 = height of antenna with value below intendedh2 = height of the intended antennah3 = height of antenna above h2x1 = coverage distance of h1 at the specified E (dB)For antennas with effective radiated power (ERP) less than 1kW, the following relation was applied: | (5) |
With all values from equations (1) and (5) obtained, comparison was made using Excel radial graphs as given in Figures 1−4 for four out of the seven stations.
4. Results and Analysis
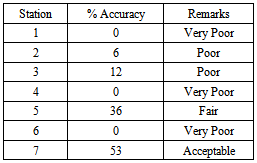
The values recorded were applied to Microsoft Excel software to produce radial curves indicating both CCIR curve and the actual curve of transmission for each of the TV stations. The two curves on the same origin represent the transmission reach of the CCIR and actual measured values with respect to the center of the graph. That is, the center represents the location of the transmitting antenna while the curves give the locus of signals.The radial curves for stations 1 (NTA 2), 3 (AIT), 7 (LTV) and 8 (Channels) are given in Figures 1, 2, 3 and 4 respectively. The figures show that the differences in the curves are substantial so that they cannot be overlooked. For a few times, the CCIR values were approximately equal to actual field measurement. Using a tolerance of ± 20%, the percentage of accuracy of the CCIR predictions were determined as in Table 4.According to the World Radio TV Handbook (1999)[11], the CCIR curves are expected to be correct for 50% of locations they are employed for. As Table 4 reveals, CCIR curvesproved acceptable in the case of only TV station number 7. More than that, for the seven TV stations, the average success rate is approximately 14%. This is below the expected success rate of 50%.
5. Conclusions and Recommendations
The radial graphs obtained showed that the signal transmitted from the TV stations in Lagos State effectively reached parts of neighbouring Ogun State. Owing to this reason viewers in many parts of Ogun State watch TV stations that are located in Lagos. To address this excessive transmission reach, it is suggested that:1. Ogun and Lagos States be put in the same transmission zone or NBC in conjunction with the NCC should re-design the TV zones in Lagos and Ogun.2. The transmitter power or antenna height of some of Lagos TV stations should be reduced3. Furthermore, as the problem of co-channel interference is inevitable in the future when new TV stations come up in neighbouring Ogun State, the NBC in conjunction with the NCC should re-design the TV zones in Lagos and Ogun.4. Finally, studies similar to the ones conducted and being reported here should be conducted in other parts of the country to ascertain fully the effectiveness of the frequency re-use and zoning arrangement throughout the country. If substantial data are available, the frequency re-use system can then be re-arranged for better transmission zoning.Table 3. Transmission data for the seven TV stations
 |
| |
|
The CCIR curves were so incorrect owing to the fact that they have been put in place for Africa for too long a time (since 1963) and have not been reviewed since then. With modern technical data such as were obtained in this study, new curves can be developedand the old ones replaced.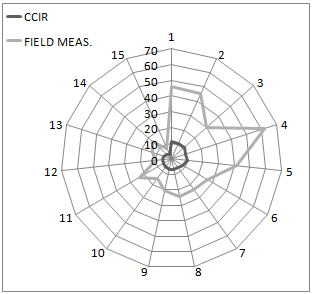 | Figure 1. Broadcast coverage of station1: CCIR compared with field measurement |
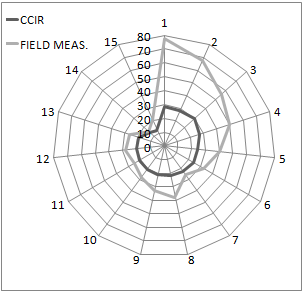 | Figure 2. Broadcast coverage of station2: CCIR compared with field measurement |
Table 4. Percentage Accuracy of CCIR curves for the seven TV stations
 |
| |
|
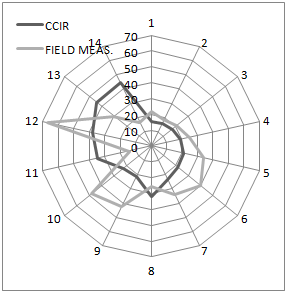 | Figure 3. Broadcast coverage of station 4:CCIR compared with field measurement |
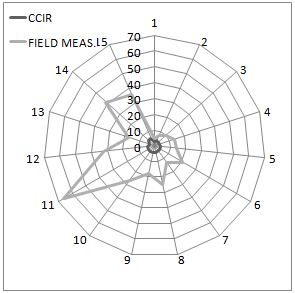 | Figure 4. Broadcast coverage of station7: CCIR compared with field measurement |
ACKNOWLEDGEMENTS
The authors of this paper wish to express their gratitude to the following individual and organisations for their contribution to the successful completion of the research work and compilation of the paper: Engr. Friday of Nigerian Broadcasting Commission (NBC) Lagos and the Management of the seven understudied TV stations.
References
| [1] | Moss, R. (1983). Video the Educational Challenge. London: Croom Helm Limited. |
| [2] | Egbon, M.I. (1982). "Origin and Development of Television Broadcasting in Nigeria'. Television Journal. Ending December 1982, pp. 4-4, 27-28. |
| [3] | Adegbokun, D. (1983). 'Nigerian Television Authority'. Television Journal 2nd Quarter. April-June, pp. 3-5. |
| [4] | Ofonagoro, W. (1984). 'Common Heritage of Shared Origins'. Television Journal 1st Quarter, January-March, pp. 16-21. |
| [5] | Umeh, C. C. (1989) The Advent and Growth of Television Broadcasting in Nigeria: Its Political and Educational Overtones, Africa Media Review Vol. 3 No. 2. |
| [6] | Davies, J. (1994) “Radio Engineer’s Pocket Book”. Newness Butterworth-Heinemann. |
| [7] | Black, R.I. (1985) “The UHF Television Network Part A: Service Planning”. In Television Engineering: Broadcast, Cable and Satellite. Part 2: Applications: R.S. Roberts ed. Pentech Press London. |
| [8] | Grob, B. and Herndon, C.E. (1999) “Basic Television and Video Systems”, 6th edition McGraw-Hill Book Co. |
| [9] | Porges, F. (1988) “The design of Electrical services” 3rd edition. Spon Press. |
| [10] | Green, D.G. (1990) “Radio Systems Technology”, John Wiley. |
| [11] | Bobbett D, G.. (ed) (1999) World RadioTV Handbook 53rd edition, Watson-Guptill Publications. |


 Pt = effective radiated power, W
 d = coverage distance in metersAlso, each measured value was converted to its dB equivalent using the relation:


 Abstract
 Reference
 Full-Text PDF
 Full-text HTML


