-
Paper Information
- Previous Paper
- Paper Submission
-
Journal Information
- About This Journal
- Editorial Board
- Current Issue
- Archive
- Author Guidelines
- Contact Us
Electrical and Electronic Engineering
p-ISSN: 2162-9455 e-ISSN: 2162-8459
2013; 3(6): 156-166
doi:10.5923/j.eee.20130306.03
Real-Time Evaluation of System Dynamics to Improve Network Performance in Akure Electric Power Distribution System in Nigeria
 Abstract
 Reference
 Full-Text PDF
 Full-text HTML
Oyetunji Samson A.
Electrical/Electronic Engineering Department, Federal University of Technology, Akure, Nigeria
Correspondence to: Oyetunji Samson A., Electrical/Electronic Engineering Department, Federal University of Technology, Akure, Nigeria.
| Email: |  |
Copyright © 2012 Scientific & Academic Publishing. All Rights Reserved.
Real-time evaluation of the dynamics of Electric Power Distribution Network was proposed and developed for Akure Electric Power Distribution System (EPDS). The diagnostic system is based on threshold trespassing algorithm using the current signatures. The algorithm is able to distinguish between overload and short circuit currents. The suitability of the algorithm was simulated in MATALAB before field deployment. The hardware consists of embedded system that reports abnormal conditions to the distribution control centre using wireless communication where analysis is carried out to establish the attribute of the disturbance for prompt restoration. The system is also capable of logging the transformer loading and reports to the control centre periodically. The effect of the system was studied by integrating it with a fault prone Feeders as defined by the performances of the Five feeders in Akure. The study was carried out to improve the delivery of power though reduction in mean-time-to repair. Fault reporting time of 2sec was achieved from the set-up with improvement in power availability from about 30% to 60%. The system shows engineering capability in improving the performance of EPDS in Nigeria.
Keywords: Current, Electric Power Distribution, Faults and Mobile Communication
Cite this paper: Oyetunji Samson A., Real-Time Evaluation of System Dynamics to Improve Network Performance in Akure Electric Power Distribution System in Nigeria, Electrical and Electronic Engineering, Vol. 3 No. 6, 2013, pp. 156-166. doi: 10.5923/j.eee.20130306.03.
Article Outline
1. Introduction
- The economic growth and development of a country depends heavily on the reliability and quality of the electric power supply[1]. The last decade in Nigeria witnessed massive investment in increasing the generation capacity and expanding the transmission lines. However, despite the important function of Electric power distribution system in the delivery of electricity, the system have generally grown in an unplanned manner resulting in high technical and commercial losses in addition to poor quality of power[2]. According to[3], the Nigerian electric power distribution system (EPDS) as a developing one is horizontally characterized by very long radial circuits, under sized distribution conductors and numerous other factors that affect reliability. The power distribution network is characterized with a number of distribution substations located over a vast geographical area which is prone to faults occasioned by wind storms, lightning, rain, insulation breakdown, overloading and short circuits. According to[4] distribution lines experience faults more often than the faults experienced by other power system facilities[4]. In Nigeria EPDS, reliance on routine patrol of the distribution network or consumer occasional reporting when interruption occurred is unreliable and time consuming. In a developing country, where the generating stations are not adequate, an improved distribution network will enhance the delivery of power. Real-time data gathering is essential for the efficient management of power distribution. This is more imperative given the extensive size of the networks which can only be effectively monitored in principle by information technology sentinels that function without pause. However, real-time data on the conditions of distribution substations are currently not available for remote diagnosis in Nigeria. The recent advances in wireless communication technology, especially the mobile phone networks[5], offers new, cost effective possibilities for monitoring otherwise impossibly complex EPDS. This research focuses on using the current signatures to detect faults in Akure EPDS.
2. Distribution System Faults
- Distribution networks of an electric power system link bulk sources of energy to customers' facilities. Distribution lines are usually operated in radial mode with loads tapped along the lines; which could be single or three-phase taps. The substation transformer steps the voltage down to 0.415 kV. It is estimated that 80% of all interruptions occur due to failures in distribution systems[6,7, 8]. A fault condition is a sudden abnormal alteration to the normal circuit arrangement[9] that results in energy being dissipated in manner other than the serving of the intended load[10]. The circuit quantities, current and voltage, will alter, and the circuit will pass through a transient state to a steady state[9]. The different types of faults that occur in a network can be classified in three major groups[9, 11]:(a) short circuit faults;(b) open circuited faults and (c) simultaneous faults.The faults have different possible origin which includes electric, climatologic and human activity or error.
2.1. Short Circuit Faults
- Short circuit is the accidental or intentional conductive connection through a relatively low resistance or impedance between two or more points of a circuit which are normally at different potentials[9, 11, 6]. Short circuit studies are conducted to determine the magnitude of the prospective currents flowing throughout the power system at various time intervals after a fault occurs. When short-circuit occurs in an installation fed by a distribution network (far from the generator), a short circuit current consisting of two components-the transient aperiodic component and steady state sinusoidal component will flow[6]. The transient which last for several periods has a peak magnitude of between 1.6 to 2.5 times higher than short-circuit current values at steady-state conditions[9]. On three-phase power systems, there are ten distinct possible shunt faults types[12]. These are classified in the following four categories[7].a) Single-phase-to-ground faults.b) Two-phase-to-ground faults.c) Phase-to-phase faults.d) Three-phase faults.Between 70% and 80% of the line faults are phase-to-ground faults while15% are double line faults with or without earth and which can often deteriorate to 3 phase fault and 5% involves all three-phases[7,13]. Broken conductor faults account for the rest.
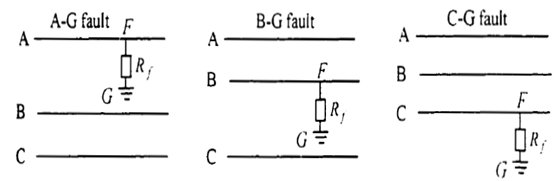 | Figure 1. Single-phase-to-ground faults experienced on three-phase lines |
2.1.1. Single-Phase-to-Ground Faults
- The following three types of single-phase-to-ground faults occurred in EPDS[7, 9] : a) Phase A-to-ground faults.b) Phase B-to-ground faults.c) Phase C-to-ground faults.This type of faults as shown in Figure 1 is not symmetrical.
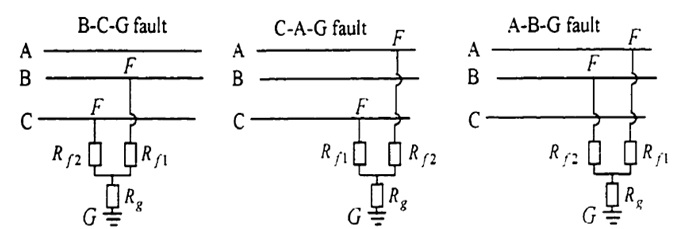
2.1.2. Two-Phase-To-Ground Faults
- The following three types of Two-phase-to-ground faults are defined. a) Phase A and phase B-to-ground faults b) Phase C and phase A-to-ground faults.c) Phase B and phase C-to-ground faults.The electrical circuit diagram are shown in Figure 2. The fault resistance is Rf while Rg is the ground resistance.
 | Figure 2. Phase-to-phase faults. (a) Types of faults. (b) Sequence network diagram |
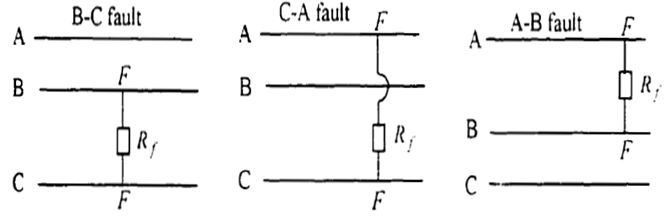
2.1.3. Phase-to-Phase Faults
- The three types of phase-to-phase faults that can be experienced on three phase lines are: a) Phase B-to-phase C faults.b) Phase C-to-phase A faults.c) Phase A-to-phase B faultsThese faults are shown in Figure 3 with a fault resistance Rf. Using symmetrical component theory; a phase-to-phase fault can be represented by the sequence network diagram shown in Figure 2.6 (b)[14] .
 | Figure 3. Phase-to-phase faults |
 | Figure 4. Three-Phase fault. (a) Types of faults. (b) Fault Sequence Network Das (1998) |
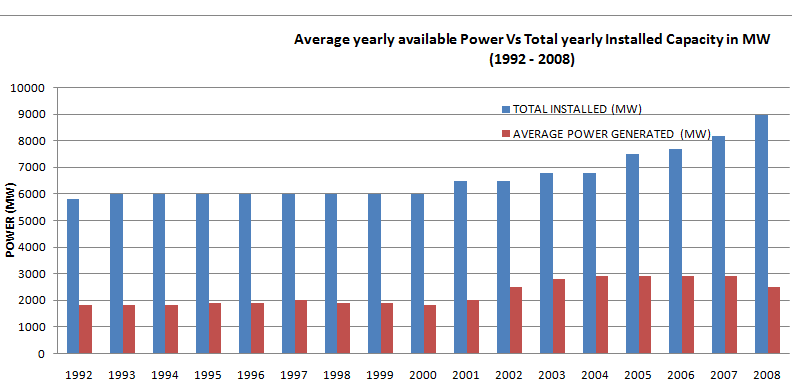 | Figure 5. Average yearly Available Power |
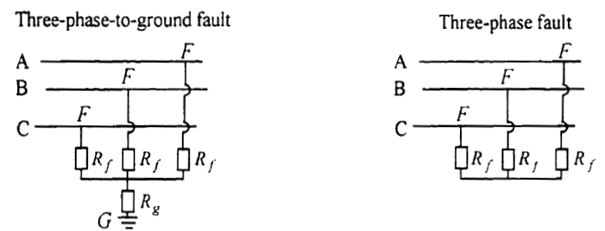
2.1.4. Three-Phase Faults
- According to[15], a 3-phase short circuit faults also known as symmetrical or balanced fault implies that all three phases of the power system are simultaneously short-circuited to each other through a direct or "bolted" connection. These faults can be with or without ground (Figure 4). The three phase faults give the highest short circuit currents and play pivotal role in short circuit calculations for the selection of protective devices[9].
3. Generation Scenario in Nigeria
- The efforts at addressing the availability of power by increasing the Installed Capacity are expressed by Figure 5 and Figure 6. This shows that daily generation was about 30% of the installed capacity. Therefore, an efficient approach by targeting the Distribution level becomes inevitable.
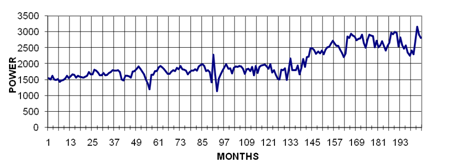 | Figure 6. Generation Scenario in Nigeria |
3.1. Delays in Fault Detection
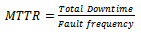
- The direct consequence of disturbance is reduction in power availability. Availability means that a system is on-line and ready for access. A variety of factors can take a system off-line, ranging from planned downtime for maintenance to catastrophic failure. The goals of high availability solutions are to minimize this downtime and/or to minimize the time needed to recover from an outage. Availability, A, of power is defined by the equation[16]:
 | (1) |
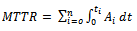 | (2) |
3.2. Network Performance Index
- The usefulness of a system is determined by its steady availability, frequency of failures. In power system, reliability, R is a function of the failure rate,
 (which measures the fault occurrence) expressed by (3)[16].
  | (3) |
 | (4) |
 | (5) |
 | (6) |
4. Fault Detection Based on Current Measurement
- A very simple and effective fault detecting principle is that of using the current magnitude as an indicator of a fault of the power system. The following steps were carried out a) The line current that was estimated during a fault contains the load components as well as the fault components. b) If one or more of the line currents exceeded the threshold defined by the transformer rating, it is assumed that a fault has occurred. c) The phasor of the zero sequence current Io from the phasors of the line currents was estimated as follows.
 d) The magnitude of the zero sequence current increases beyond its normal value when a ground fault is experienced. If the magnitude of the estimated zero sequence current is more than a threshold, it is assumed that ground fault is detected.
 4.1. Over-Current Faults Detection
- Over-currents in an electrical network may be caused by short-circuit or overload. The current per phase was monitored to detect over-current fault. The over load current is set as (4) by the Utility in Nigeria[3].
 | (7) |
 | (8) |
4.2. Short Circuit Faults Detection
- Short circuit faults are detected using the excessive flow of current typical of such faults. The fault current is important when compared to the load current in a short circuit fault. Three cases are considered.Case A: For a three phase, all the phases experienced high current magnitude.
 | (9) |
 | (10) |
 | (11) |
 | (12) |
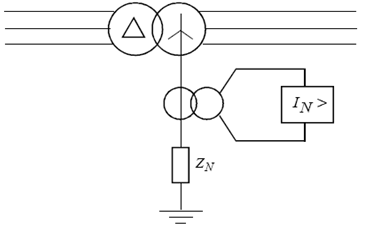 | Figure 7. Phase to earth fault monitoring arrangement |
 | (13) |
4.3. Real-Life Short Circuit Simulation of EPDS
- The model has been created with a toolbox of Matlab/Simulink called Sim Power Systems. To be able to simulate a fault in any point of any line, it is necessary to model every line with two blocks, the first will have the distance equal to the distance from the beginning of the line to the fault and the second will have a distance equal to the total length of the line minus the fault distance. Loads were connected at the nodes to replicate a real-life environment. Usually electric lines are modeled with the serial impedance and the parallel admittance. As the lines are short, the parallel are omitted. All the necessary parameters to build the model of the line are known: topology (as shown in Figure 3.39), section lengths, section unitary impedances, transformer nominal powers. Faults were simulated at different locations on the 0.415kV overhead lines. The parameters of the line were adjusted at constant intervals. The simulated faults are:a) 3-phase short circuit fault;b) 3- phase short circuit fault with ground;c) 2-phase short circuit fault;d) 2-phase short circuit fault with ground ande) Single phase short circuit fault
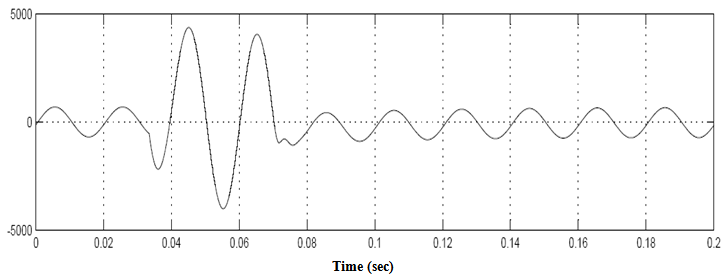
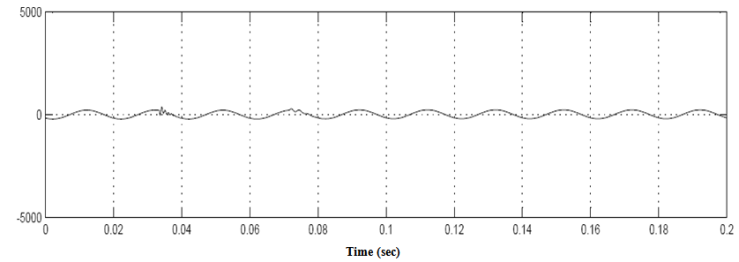
4.4. Results of Faults Simulation
- The waveforms for the various categories of are shown in Figure 8 to Figure 3.51.
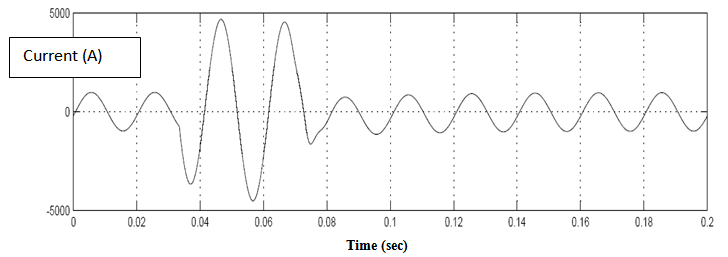 | Figure 8. Three phase short circuit red-phase |
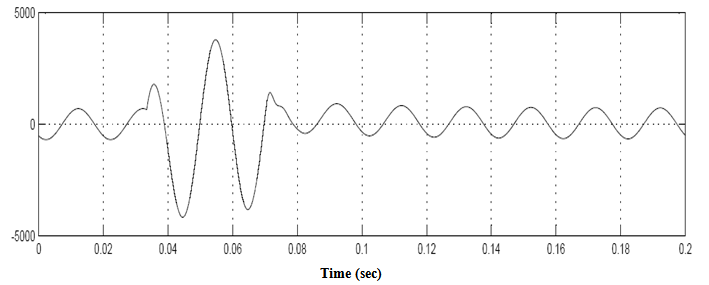
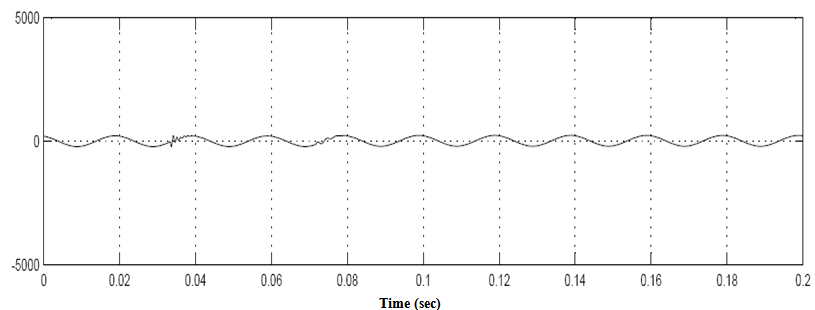
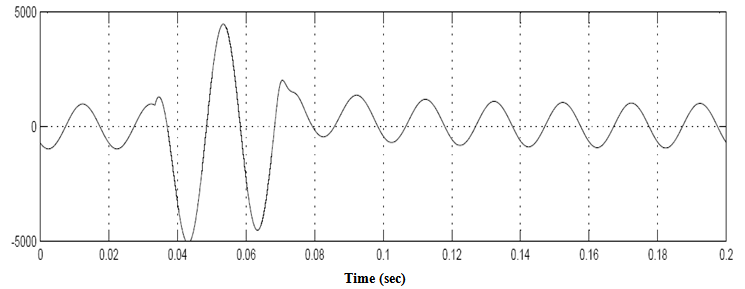 | Figure 9. Three phase short circuit for yellow phase |
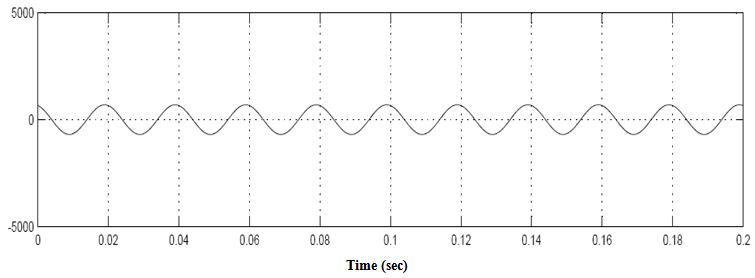
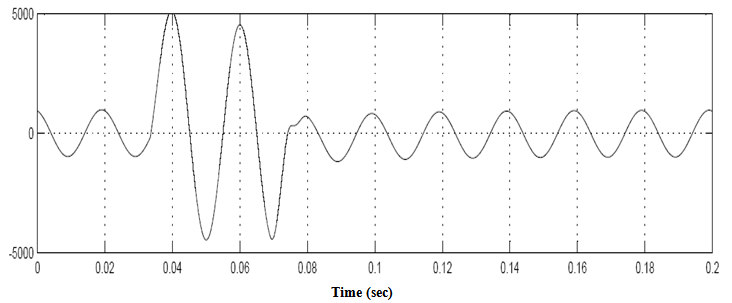 | Figure 10. Three phase short circuit for blue Phase |
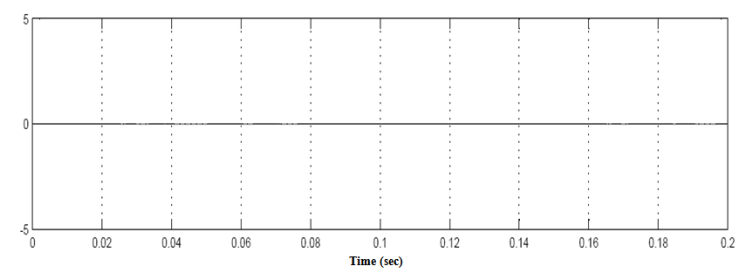
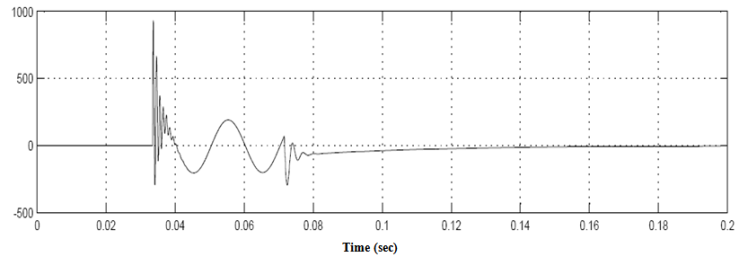
 | Figure 11. Three phase short circuit for neutral phase |
 | Figure 12. Two phase short circuit for red phase |
 | Figure 13. Two phase short circuit for yellow phase |
 | Figure 14. The Unaffected phase- blue phase |
 | Figure 15. neutral current |
 | Figure 16. Single phase short circuit for red phase |
 | Figure 17. Unaffected phase - yellow phase |
 | Figure 18. Unaffected blue Phase |
 | Figure 19. Effect of Single phase short circuit on the neutral |
5. Implementation of Real-time Data Gathering
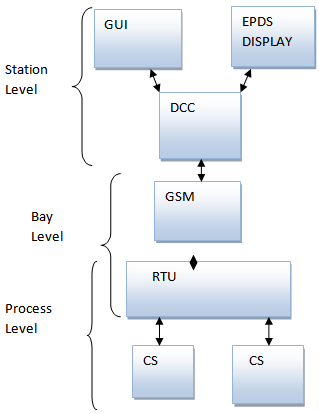
- The system encompasses the development of software driven hardware positioned at the remotely located sub-station to monitor the state of the network in real-time. It analyzes the results and initiates communication with the Distribution Control Center (DCC) whenever abnormal conditions occur. Additionally, it generates a restoration code whenever corrective measures initiated are successful. At the DCC, the acquired information is analysed and diagnose to determine the status of the network. According to[19] remote measurements can be obtained in three different ways-Cyclic polling, Polling on demand, and Threshold trespassing.
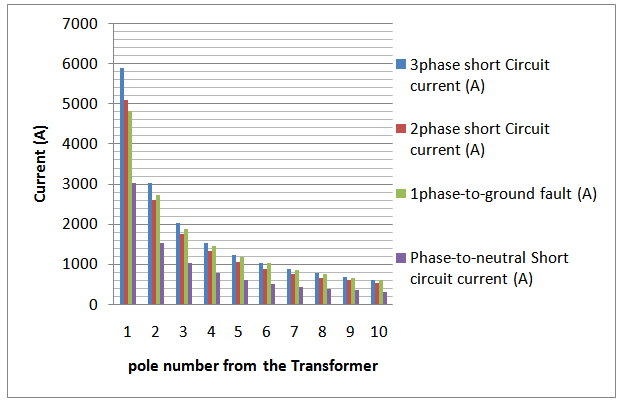 | Figure 20. Comparison of Current Short Circuit Types |
 | Figure 21. Conceptual real-time current-monitoring |
5.1. Process Level- Current Measuring Unit
- For current measurement, the following devices are commonly employed: shunt resistor; Current transformer and Rogowski coil[22]. In this work, Rogowski coil which is a toroidal winding on a non-magnetic core (generally air-cored), placed around the conductor to be measured, was used to measure phase current. Rogowski coil compared with current transformer there is no saturation, low insertion loss and reduced size. In addition, Rogoskil coils are not affected by stray capacitance[14]. However, external circuitries which include integrator and filters are required for processing.
5.2. Bay Level-Remote Terminal Unit (RTU)
- The RTU that resides in the Bay was developed around PIC18f4550 embedded system. The signals from the Rogowski coil were bandlimited using fourth order Salen key Butterworth low pass filter and integrated before feeding the signals into Analogue to Digital Converter (ADC). The sets of data are saved on external memory card for future processing. In addition, the firmware acts on the data for decision making which includes establishing communication between the bay level and the station level. The RTU block diagram is shown in Fig. 23. The RTU utilizes the current signatures to determine the state of the network using the flowchart in Fig.24.
5.3. Communication Media
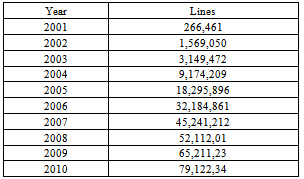
- According to[20] and[21] several techniques are available, as shown Figure 2 to establish communication between the Bay and Station levels. a) Hard-wiredb) Public Switched Telephone Network (PSTN)c) Mobile radio d) Conventional or low-powered radio e) Power Line Carrier Communication (PLCC)Hard-wired communication is generally not a viable option, as the infrastructures are not available in Nigeria. In Nigeria, the GSM growth (Table 1)[5] shows that it is a veritable platform for communication links.
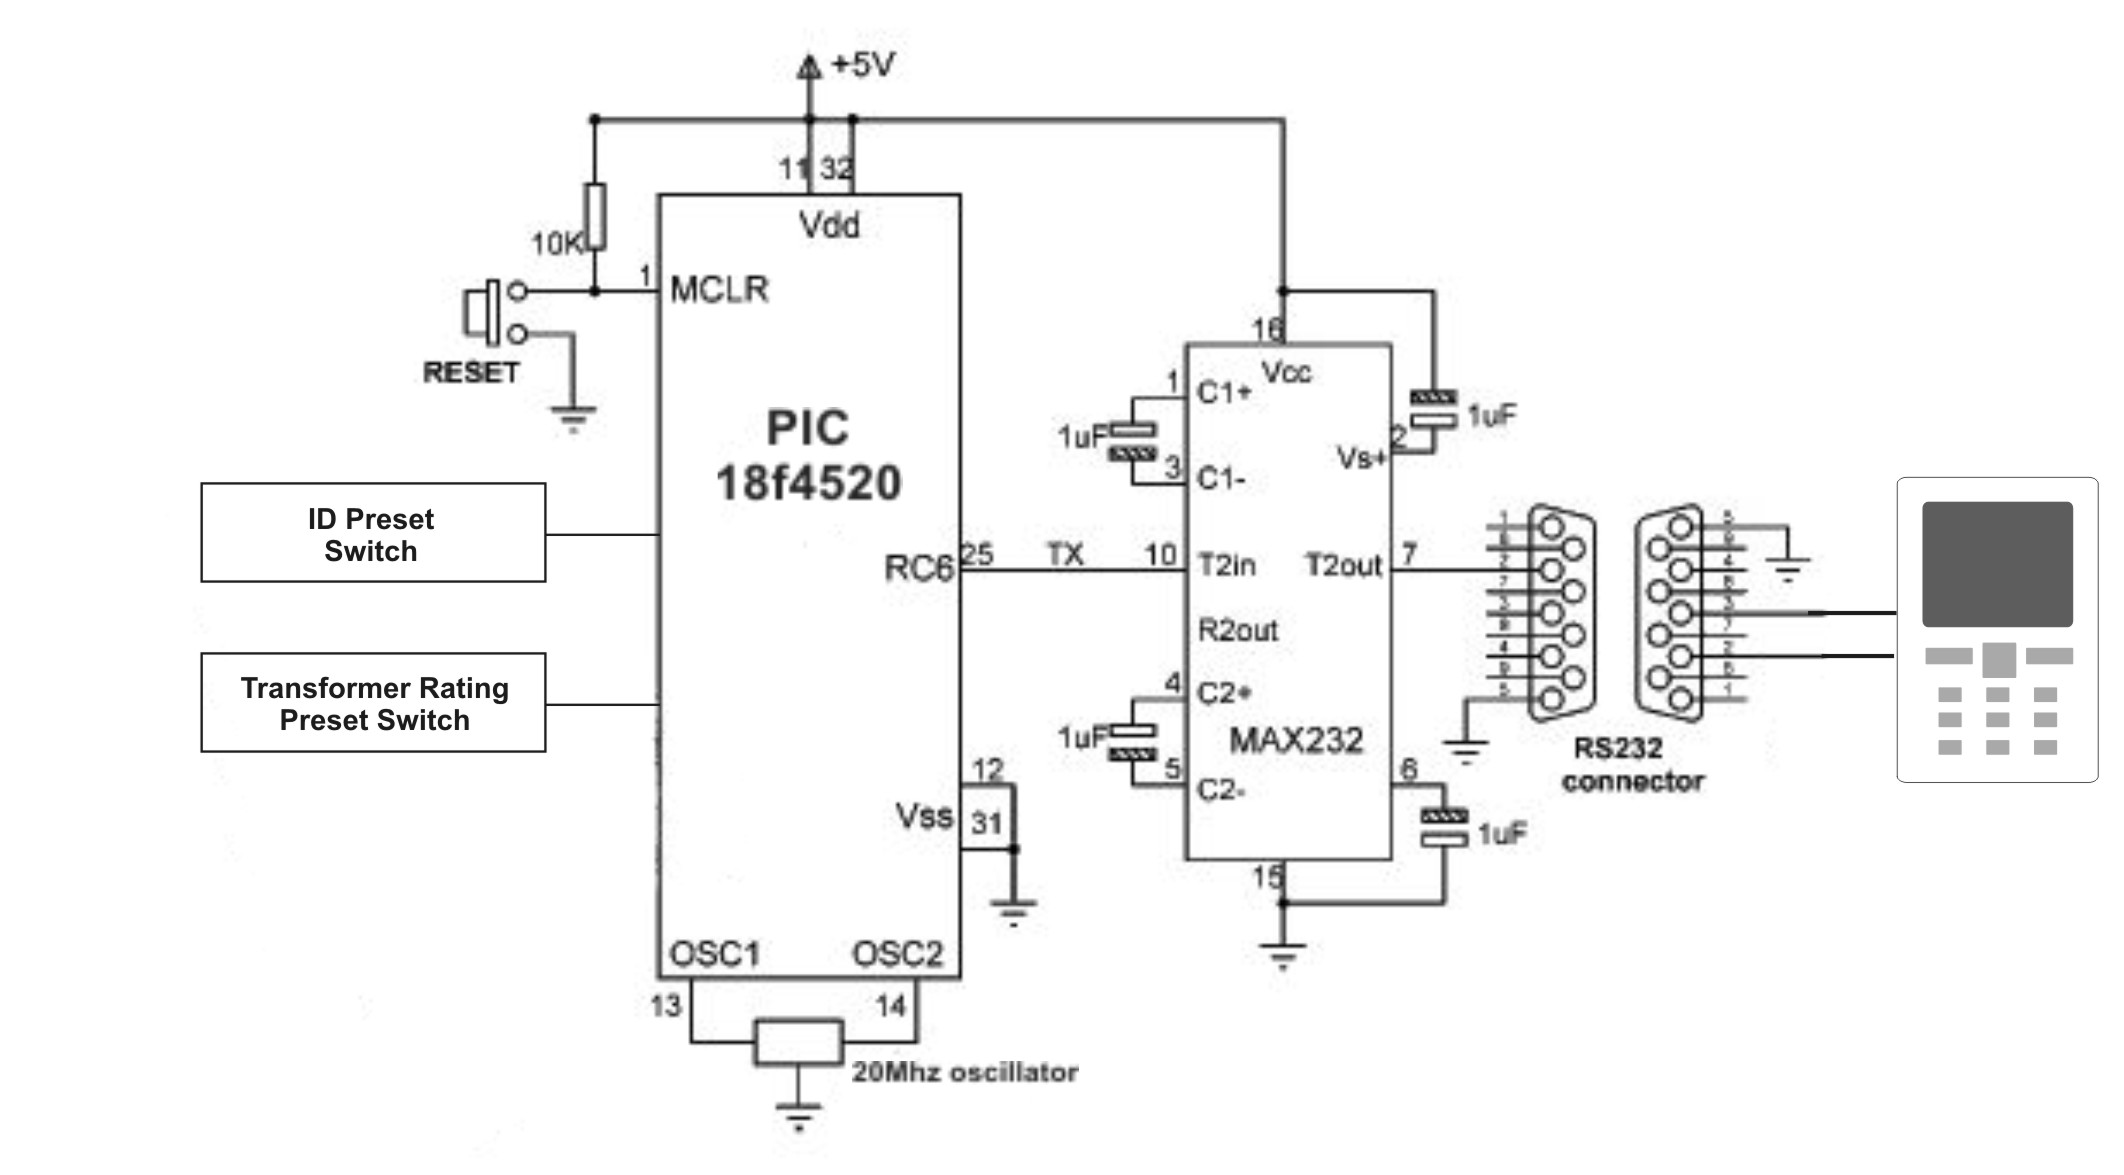 | Figure 22. RTU block diagram |
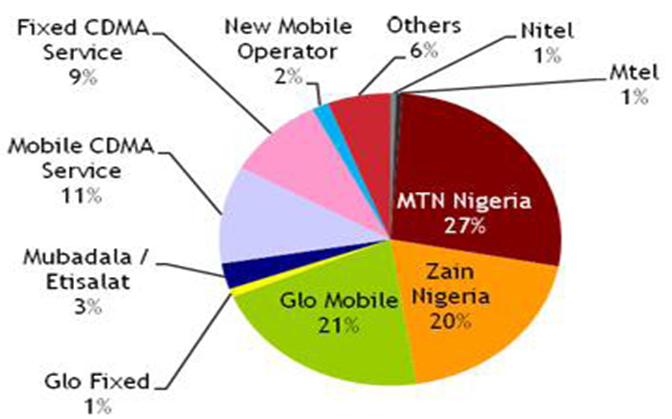 | Figure 23. Telecommunication providers’ distribution in Nigeria[5] |
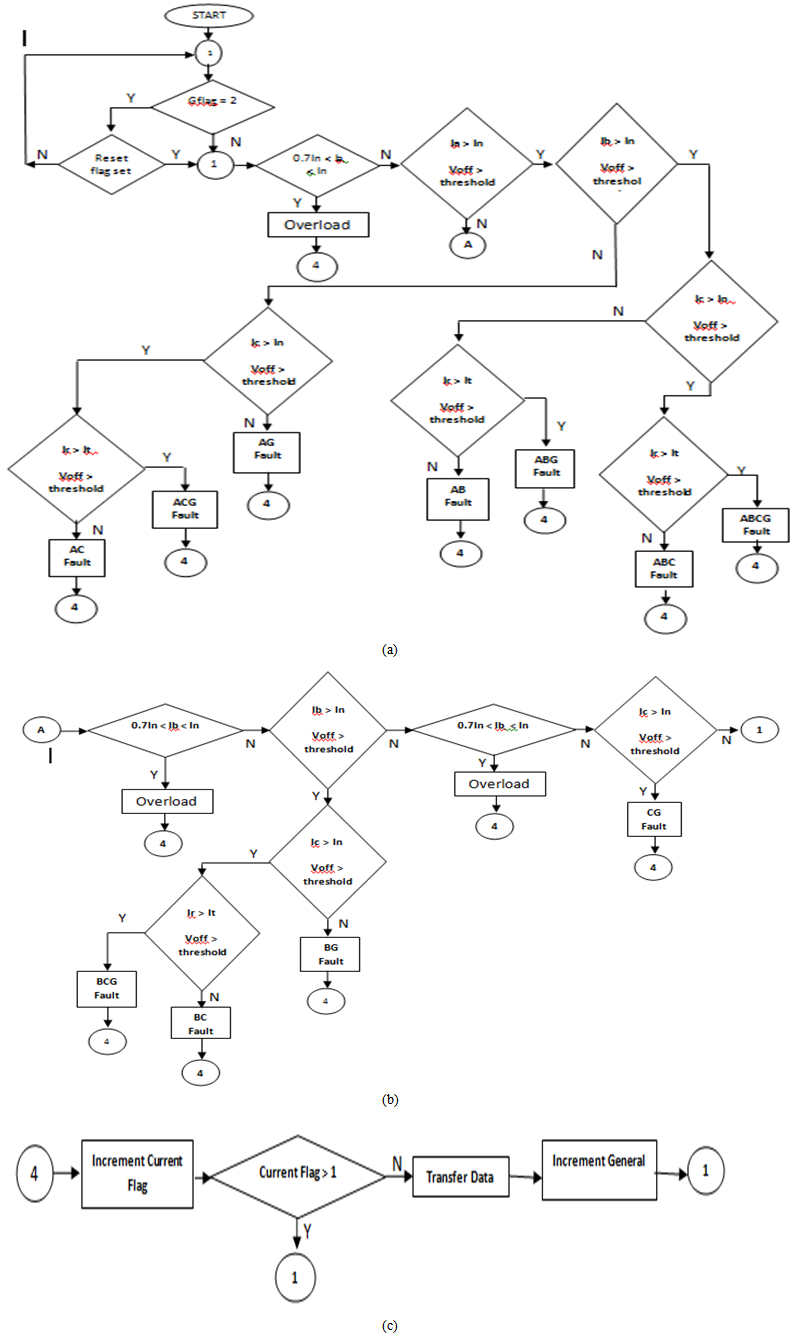 | Figure 24. Flowchart for Real-Time Current Measurement |
|
6. Field Implementation
- Akure EPDS consists of 15MvA 33/11 kV injection stations which are described in Table 2.
|

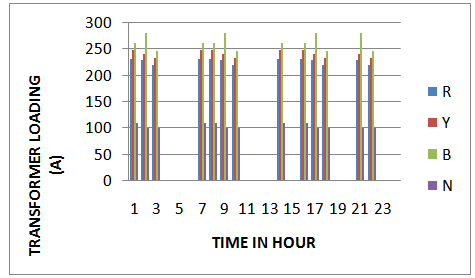
6.1. Loading of Substation Transformer
- The developed system was installed at a substation and a typical daily record was shown in Fig. 25 that indicates overloading of the substation transformer. The real-time provides platform to monitor the loading of the substation transformer. It also records information about the period of interruptions.
 | Figure 25. Short circuits Window |
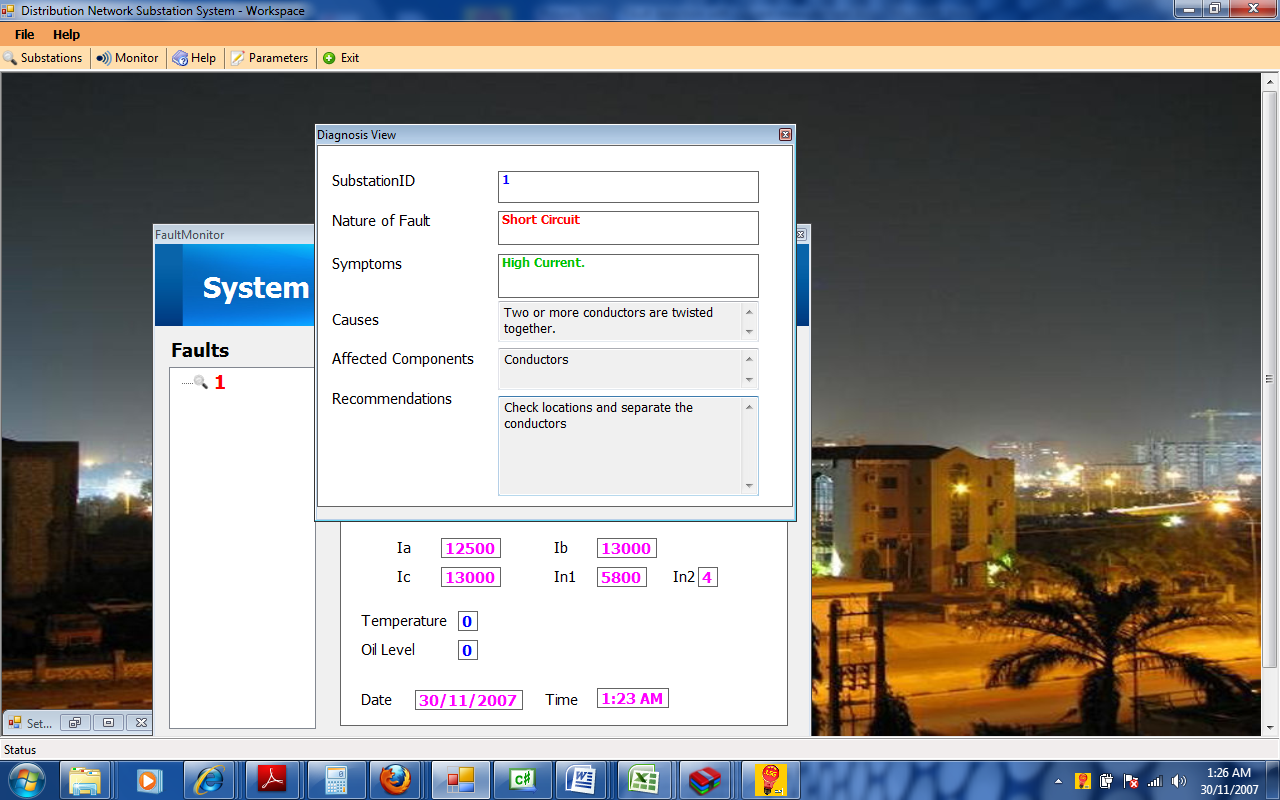
6.2. Short Circuit Detection
- The system also detects and reports short circuit faults as indicated by the window in Fig 26
 | Figure 26. Load Current Log for Abaoyo Substation |
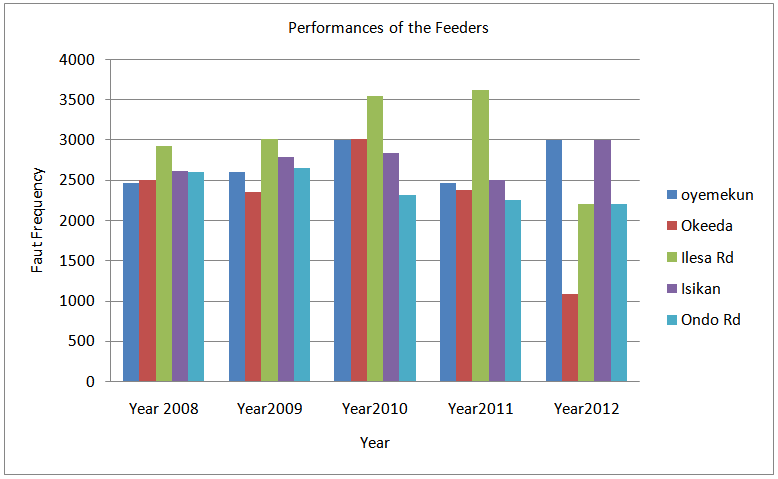
6.3. Analysis of the Network
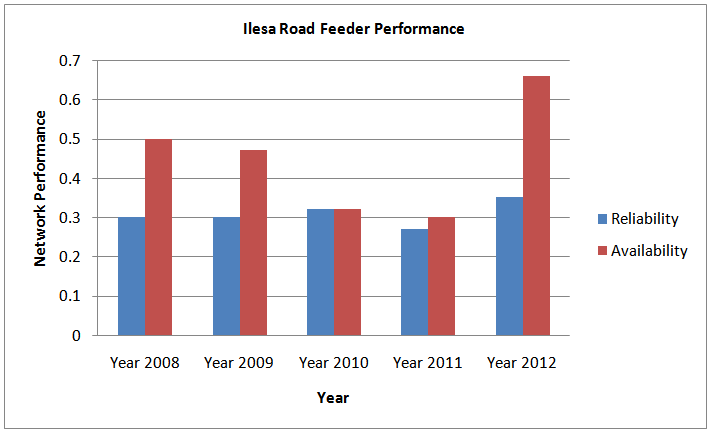
- Analysis of the Network reliability was carried out for all the feeders over a period of five years as shown in Fig 27. The effect of real-time faults detection and diagnosis on the performance of the Network was evaluated and presented in Fig 28.
 | Figure 27. Performance of the Feeders Over Five Years |
 | Figure 28. Performance of the Network |
7. Result Discussion
- (a) An effective fault detecting principle is that of using magnitude as an indicator of a fault of the power system which shows that if one or more of the line currents exceeded the threshold, it is assumed that a fault has occurred. (b) The magnitude of the zero sequence current increases beyond its normal value when a ground fault is experienced which indicates that one or two phases are short circuited to ground
8. Conclusions
- The system uses current signatures to develop threshold trespassing algorithm to evaluate the dynamics of the Network. Integration of real time diagnostic system to the EPDS improves the power availability as a result of reduction in the system downtime. The reduction in Ilesha road Feeder down time in 2012 when compared to 2011, shows the contribution of real-time diagnosis in power delivery. This was reflected in the significant improvement on the feeder performance with increase in availability to 66%.