-
Paper Information
- Next Paper
- Previous Paper
- Paper Submission
-
Journal Information
- About This Journal
- Editorial Board
- Current Issue
- Archive
- Author Guidelines
- Contact Us
Electrical and Electronic Engineering
p-ISSN: 2162-9455 e-ISSN: 2162-8459
2013; 3(4): 109-117
doi:10.5923/j.eee.20130304.02
Image Authentication by Analyzing and Classifying Texture with Linear Regression model based on Wavelet Transform
 Abstract
 Reference
 Full-Text PDF
 Full-text HTML
Minal Birewar, P. V. Thakre
SSBT’s College of Engineering & Technology, Bambhori, Jalgaon
Correspondence to: Minal Birewar, SSBT’s College of Engineering & Technology, Bambhori, Jalgaon.
| Email: |  |
Copyright © 2012 Scientific & Academic Publishing. All Rights Reserved.
Wavelet based preprocessing is a very successful method which is gaining importance in day to day life. It is becoming popular because of its easy acquisition and reliability. This paper proposes an image Authentication system by texture analysis with linear regression model based on Wavelet transform. Texture is an important feature used extremely in various image processing problems.This paper has been motivated from the fact that there exists a distinctive correlation between texture. The linear regression model has been used for analyzing the correlation. In contrast, PSWT (pyramid structure wavelet transform), TSWT (tree structure wavelet Transform) and Gabor Transform do not provide such kind of correlation. Images have been analyzed by calculating their energy up to the least possible value. Experimental results shows the value of images which has been used for the authentication purpose.
Keywords: Linear Regression, Texture Analysis, Wavelet Transform
Cite this paper: Minal Birewar, P. V. Thakre, Image Authentication by Analyzing and Classifying Texture with Linear Regression model based on Wavelet Transform, Electrical and Electronic Engineering, Vol. 3 No. 4, 2013, pp. 109-117. doi: 10.5923/j.eee.20130304.02.
Article Outline
1. Introduction
- We are allowed to communicate, share and learn information globally due to worldwide networking. Efficient research algorithms need to be developed as Digital library and multimedia are progressively increasing. For authentication of an image used in crime investigation, Journalism, Hospitals etc. many methods have been proposed, but did not succeed due to their disadvantage of lack of data available for authenticating an image. So, this method is proposed which can overcome this problem with good efficiency and reliability.Texture is a feature which is used to partition images into regions of interest and to classify those regions. It provides information in the spatial arrangement of colors or intensities in an image. It is characterized by the spatial distribution of intensity levels in a neighborhood. It cannot be defined for a point. The specific image properties like coarseness and presence of edges are extracted from texture feature. It is the distribution of crystallographic orientations of a sample. If the orientation is fully random then the sample is said to have no texture but if the orientation is not random then sample is said to have weak, moderate or strong texture.Most of the research has been done on texture classification during last three decades[2]-[5]. In 1980’s Gray level co-occurrence matrix (GLCM)[6] , second order statistic method[7], Gauss –Markov random field[8] and local linear transform[9]were used which were restricted to analysis of spatial relation between neighborhood pixels in a small image region. As a result their performance is best for the class of microtextures[10]. As human visual system is less sensitive to smaller details so keeping this thing in mind, Researchers begin to develop multiresolution analysis methods such as wavelet transform and Gabor transform as they could achieve reasonably good performance. So, they are still applied for texture analysis and classification. In this paper, it is found that there exists a distinctive correlation between some sample texture images, belonging to the same kind of texture, at different frequency regions obtained by 2D wavelet packet transform. Experimentally it is demonstrated that this correlation varies from texture to texture. A new texture analysis method, in which the simple linear regression model is employed into analyzing this rate in comparison with the multiresolution methods including PSWT, TSWT, the Gabor transform, and some recently proposed methods.This paper is organized as follows. A brief review of 2-D wavelet transform and application of correlation between different frequency regions to texture analysis has been described in section II. Section III describes the classification algorithm alongwith correlation. Several multiresolution techniques such as GLCM and Gabor transform, TSWT, Gabor transform and this method is compared. The algorithm has been implemented using MATLAB 7.1 software. With the help of this program and its output various images have been correlated. Finally, experimental results have been shown in section IV.
2. Texture Analysis with Linear Regression Model
2.1. 2-D Wavelet Packet Transform
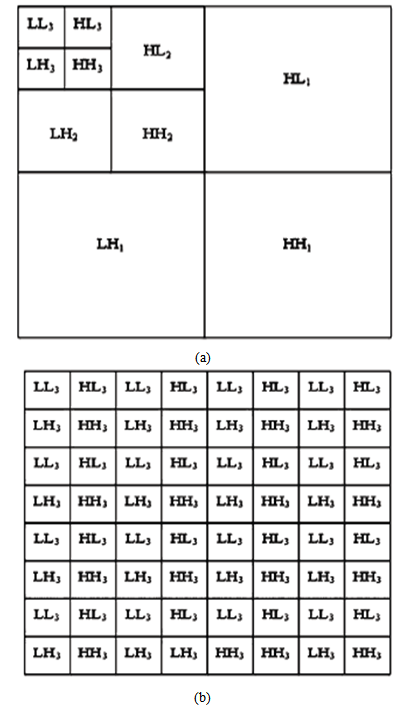 | Figure 1. (a) Three level 2-D PSWT decomposition (b) Three level 2-D wavelet packet decomposition |
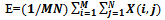 Where X(i,j) is the pixel value of the subimage.
 2.2. Analysis of Correlation between Frequency Channels
- The wavlet packet transform decorrelates the image using orthogonal bases. It can also be viewed as an approximation of Karhunan-Loeve Transform (KLT). In this paper, the correlation does not mean linear correlation between different frequency region of a texture but instead, indicates the spatial correlation between the sample texture images belonging to the same kind of texture, obtained by 2-D wavelet transform. The most common approach is to calculate all frequency regions, energy values of every image with energy function and finally characterize the texture depending on the statistics of energy values. The images are decomposed to obtain the same frequency region by 2-D wavelet transform. The 2-D wavelet transform has been proven as a powerful multiresolution analysis tool for analysis, classification and segmentation. The 2-D PSWT performs decomposition in low frequency regions. It is not suitable for the images whose dominant frequency information is located in the middle and high frequency regions. The 2-D TSWT performs decomposition in low and high frequency regions but it ignores the correlation between different frequency regions. In this paper, correlation is elaborated and preprocessing algorithm is presented that determines the frequency channel pairs that have significant correlation. The detail is described below:First the original image is decomposed into four parts. The original image is symbolized as LL,LH,HL,HH frequency regions. Second energy is calculated from these subimages and the tree forms four branches again. Third, decomposition is repeated until least size of the subimage is obtained. Practically, least size of the subimage depends on the requirement but it should not be less than 16x16 as per consideration in robustness.
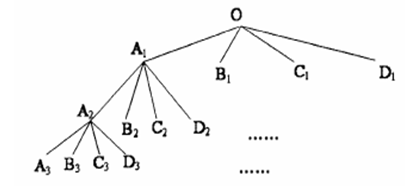 | Figure 2. Tree Representation |
 Where n:- number of decomposition levelsThe channel energy matrix is formed by using ‘j’ number of channel energy vectors of length ‘k’. These channel energy vectors are obtained by decomposing ‘j’ number of samples using 2-D wavelet transform. The channel energy matrix is denoted by ;
  with j rows and k columns.The covariance matrix is given by;
 with k rows and k columns.The covariance matrix is obtained by channel energy matrix.The correlation finds similarities between two images.Preprocessing Algorithm[Input]: All samples of a given texture[output]: Channel pair list and channel energy matrixInput is all ‘j’ number of samples of a texture. The 2-D wavelet transform decomposes these samples until least size of 16x16 is obtained. This process gives ‘k’ number of frequency channels. Energy value is calculated for these frequency channels and these values forms the channel energy vector ‘v’ of length ‘k’. The ‘j’ number of channel energy vector of ‘j’ sample of a single texture gives channel energy matrix of size jxk. If the correlation coefficient ρ ≥ T then channel pairs are selected and are arranged in descending order. The channel pair list and channel energy matrix are the output of this process.
2.3. Linear Regression Model
- In this subsection, Linear regression model is employed to analyze the correlation. If a set of random data
 ,
, 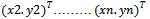 for two numerical variables X and Y, where X is a cause of Y.In this analysis the distribution of random data appears like a straight line in X,Y space when x and y are linearly related. This seizes a relationship between two variables. This line function can be given as ;y = ax + bHere, the linear regression model is used to extract the texture feature from correlation in the frequency channel pairs.The parameters ‘a’ and ‘b’ can be calculated by the formula;
 When regression takes high correlation date to obtain
  , there exists residual between y and
  which exhibits a normal distribution curve. The normal distribution parameters are mean (μ) and standard deviation (σ) which is given by;
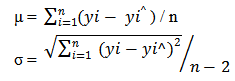 PSWT takes into account the low frequency information. TSWT takes into account low and high frequency information. Gabor transform considers filter masks with predetermined frequency Unlike PSWT and TSWT, this method takes into account all frequency channels and analyses the correlation between them with the help of simple linear regression model.
3. Texture Classification
3.1. Learning Algorithm
- [Input]: All samples of all texture[Output]: Feature list of all texturesWhen we obtain samples from the same texture, get the channel pair list and channel energy matrix from the preprocessing phase. With the help of channel pair list and channel energy matrix M, the parameters a, b, μ, σ are calculated from the given expressions. Consider the parameters a, b, μ, σ, two frequency channels and correlation coefficient ρ. Put all such parameters into the list as ρ descends and then insert the list into database. The parameters μ and σ are used to get the threshold
 In order to determine whether this image satisfies the correlation.
 3.2. Classification Algorithm
- [Input]: An unknown texture image and database consisting of feature list.[Output]: Texture index to which this unknown texture image is assigned.The unknown texture image is decomposed into number of sub images using 2-D wavelet packet Transform and the features are extracted. This Feature list and the unknown texture image is given as input. The parameters a, b, μ, σ are taken out from the channel pair of a texture from its feature list. The features are compared with the channel pair feature list and then two identical frequency channels are selected. One energy of two channels is considered as xi and used in the linear regression equation or line equation and the residue is calculated by |yi^ - yi|. Whereas the other energy is calculated as yi. If the residual value is between
 then the given texture is considered otherwise it is neglected.
4. Experimental Result
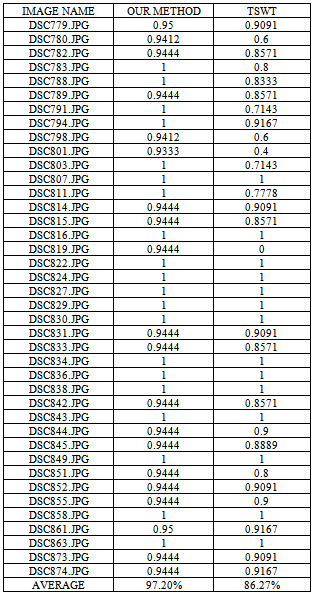
- In this section , performance is verified. 40 textures has been used. Every original image is of size 640 x 640 pixels with 256 gray levels. 81 sample images of size 128 with an overlap 32 pixels between vertically and horizontally adjacent images are extracted from each original color image and used in the experiments and mean of every image is removed before processing.The features in the classification algorithm of TSWT can be constructed by considering energy of third scale frequency regions and their controllable parameters like decomposition constant and comparison constant. In comparison with TSWT, this method defines different average Retrieval rate as Threshold is considered in one dimension. Each image can be decomposed into number of sub images depending on the number of decomposition levels until least size of subimage is obtained. The subimage decomposition depends on the requirement but it should not be less than 16x16 as per consideration in robustness.
|

5. Conclusions
- In this paper, a modified approach has been shown for authenticating an image by texture analysis and classification based on wavelet transform. Although TSWT can also be used for classification purpose but as this method considers the Threshold comparison it overtakes that method. Again, TSWT do not consider the correlation between different frequency channels but as it keeps frequent information and uses energy criterion it can also undergo decomposition. This method considers correlation of different frequency regions and this unique characteristics helps this method to go beyond TSWT. Thus, this method has been proven as a useful and highly demanding method because of its accuracy and reliability as it considers the correlation. As explained earlier, this method considers threshold comparison rather than distance measurement methods. In crime investigation, police seeking to confirm the face of suspected criminal among faces in the database of renowned criminals. In the commerce department before trademark is finally approved for use there is need to find out if such or similar ones ever existed. In the hospital some ailments require the medical practitioner to search and review similar X-rays or scanned images of a patient before proffering solution. With the help of this method, the target can be achieved with accuracy. In this way, this method is very easy and fast to examine the change of different frequent channels for texture image.
ACKNOWLEDGMENTS
- The author would like to thank the editor and the anonymous reviewers for their contributing comments, as well as Prof.P.V.Thakre, Associate Professor, Department of Electronics & Telecommunication Engineering, Shrama sadhna Bombay Trust’s college of Engineering & Technology, Bambhori , Jalgaon. I would also like to thank my husband and my family for supporting me.