-
Paper Information
- Next Paper
- Previous Paper
- Paper Submission
-
Journal Information
- About This Journal
- Editorial Board
- Current Issue
- Archive
- Author Guidelines
- Contact Us
Electrical and Electronic Engineering
p-ISSN: 2162-9455 e-ISSN: 2162-8459
2013; 3(2): 33-42
doi:10.5923/j.eee.20130302.02
ECO Based Solution for Generation Expansion Planning in Deregulated Power Systems
 Abstract
 Reference
 Full-Text PDF
 Full-text HTML
H. Shayeghi, H. Esmaeli
Technical Engineering Department, University of Mohaghegh Ardabili, Ardabil, Iran
Correspondence to: H. Shayeghi, Technical Engineering Department, University of Mohaghegh Ardabili, Ardabil, Iran.
| Email: |  |
Copyright © 2012 Scientific & Academic Publishing. All Rights Reserved.
This paper presents an Election Campaign Optimization (ECO) algorithm for the solution of Generation Expansion Planning (GEP) problem in a competitive electricity market. GEP is one of the important decision-making activities in electric utilities and plays a fundamental role in the deregulated environment for electricity trading. It is highly constrained non-linear dynamic optimization problem that can only be fully solved by complete enumeration and is computationally impossible for a real world GEP problem. The utility has to take both independent power producers participation and environment impact (CO2 emission) with satisfying all electrical and energy market constraints simultaneously. The proposed ECO based method has a strong ability to find most optimistic results and is robust for solution problem featuring non-linearity, non-differentiability and high-dimensionality. The proposed solution method is compared with the particle swarm optimization algorithm to demonstrate its effectiveness considering different purchase prices for IPPs and CO2 emission limits. Analysis indicates that the proposed method is an effective and economical tool to solve competitive GEP problem that is easy to implement. Results can offer utilities for determining the optimal expansion planning.
Keywords: GEP, Deregulated Power Systems, Energy Market, ECO Algorithm
Cite this paper: H. Shayeghi, H. Esmaeli, ECO Based Solution for Generation Expansion Planning in Deregulated Power Systems, Electrical and Electronic Engineering, Vol. 3 No. 2, 2013, pp. 33-42. doi: 10.5923/j.eee.20130302.02.
Article Outline
1. Introduction
- Generation expansion planning (GEP) has historically addressed the problem of identifying the most adequate technology, expansion size, sitting, and timing for the construction of new plant capacity considering economic criteria while ensuring that the installed capacity adequately met the expected demand growth. However, the development of market mechanisms in the electricity sector altered the traditional GEP assumptions, models, and solution approaches[1].Deregulating the power market creates more competition and more trading mechanism for market players. It moves from the cost-based operation to bid-operation[2, 3]. In a competitive electricity market, all utilities including Independent Power Producers (IPPs) want to maximize their profit while meeting the load demand within a suitable reliability criterion. In order to achieve the objective, utilities will carefully perform the generation expansion planning to determine the minimal-cost capacity addition plan. From the viewpoint of economic efficiency, they will have more selections either constructing new generating plants or purchasing electricity from other utilities or IPPs. Thus, generation expansion planning of the utilities is an important decision-making activity in a competitive market.Historically, resource planners have focused on what resources should be chosen rather than the dual solution what prices should be charged. Prices and their effects on loads can be included in resource integration models by adding two types of constraints: a revenue requirements equation and a demand curve[4]. The first constraint relates the utility’s price to its resource costs. Under the assumption of cost-based regulation of private utilities, wherein utilities are allowed to recover all costs prudently incurred, such a constraint would specify that the revenue received by the utility should cover its costs. The second constraint relates loads to prices. The more intense competition becomes, the more elastic that curve will be. These two constraints are generally non-linear. As a result, the models become more difficult to solve. On the other hand, the greater uncertainties in load growth, fuel markets and government regulations have made the problem even more complex. The criteria are to minimize the total cost under operation constraints for different type generators. It is important that WHAT generating units should he constructed or WHEN generating units should come on line over a planning horizon for themselves profits.Recently, the heuristic methods have been used to solve the GEP problem, such as simulated annealing (SA)[5], simple genetic algorithm[6, 7]. Also the genetic algorithm (GA) and improved genetic algorithm (IGA)[8] were used to solve this problem. Although, GA seems to be a good method to solve optimization problems, when applied to problems consisting of more number of local optima, the solution from GA are just near global optimum areas. Also, it takes long simulation time to obtain the solution. Moreover, when the number of parameter is more, optimization problem is complex and coding chromosomes with more genes for increasing algorithm accuracy is caused the GA convergent speed will become very slow, so that convergent accuracy may be influenced by the slow convergent speed. To overcome these drawbacks, the PSO algorithm has been proposed[9]. Using of new algorithms to solve the GEP problem is a good way that is used in recent years. The Non-dominated Strong Genetic Algorithm version II (NSGA-II) is one of these new methods that are used for solving GEP problem. NSGA-II is used in[10] to solve constrained single objective optimization problem, the Transmission Constrained Generation Expansion Planning (TC-GEP) problem. One step ahead NSGA-II used to solve a multi-objective GEP problem[11].The proposed model provides for decision maker choice from among the different trade-off solutions. Two different problem formulations are considered. In one formulation, the first objective is to minimize cost; the second objective is to minimize sum of normalized constraint violations. In the other formulation, the first objective is to minimize investment cost; the second objective is to minimize outage cost (or maximize reliability). In this paper, an election campaign optimization (ECO) algorithm is proposed for the solution of GEP in order to minimize the cost subjected to the operation constraints and CO2 emission limits for a test system including a utility and three IPPs, have been used in[12]. ECO is a new heuristic optimization algorithm which acts by simulating the behavior that the election candidates pursue the highest support from voters in election campaigns. In ECO the whole space of searching is assumed to be assembly of voters, and the current solutions are imagined to be the candidates of election. The candidates can influence the voters round them, the effect from candidates to voters will decrease gradually with the increase of distances between the candidates and the voters. The higher prestige a candidate comports, the larger investigated range he has. In order to obtain an exact and global investigated, local investigated voters are generated in the probability determined by a normal-distribution function that the mean is the location coordinates of candidates, and global investigated voters is generated in the probability determined by a uniform distribution function[13]. This feature is caused that it has been had a flexible and well-balanced mechanism to enhance the global and local exploration abilities and found to be robust in solving multi objective problems featuring non-linearity, non-differentiability and high dimensionality. The proposed method is compared with a PSO based technique[9] to illustrate its robust performance considering different purchase prices for IPPs and CO2 emission limits. Analysis reveals that the GEP problem cost is reduced by the proposed ECO algorithm and is superior to the PSO based technique.
2. Problem Formulation
- When the structure of power system is changed and the concept of electricity market and competition are introduced, the GEP planning shifts from vertically integrated monopoly utilities to decentralized competitive generators. In this study, the purchasing agency model[14] is used for formulation of the GEP problem in deregulated environment. The integrated utility no longer owns all the generation capacity. IPPs are connected to the network and sell their output to the utility that acts as a purchasing agency. Generating technologies consist of nuclear, coal, gas and oil fired plants. There are three types of generators depending on generation characteristics: the base-type, middle-type and peak-type. The scheduling order for generations to satisfy the load profile is generally nuclear, coal, oil and Liquid Nature Gas (LNG) or gas generations, respectively. IPPs want to sell as much electricity as possible for various load profiles. The utilities need to minimize the total cost under operational constraints for all types of generations. It is important to determine what type of generating units to be constructed and when the unit to be on line over a planning horizon to maximize profits. Besides minimizing the cost, environmental issues are an important issue. Fossil-fired plants produce atmospheric emissions with various fuels at various cost bases, such as coal, gas and oil.The cost of generation expansion can be formulated as a linear function that includes the variable costs and fixed costs of all technologies. When IPPs provide the electricity for utility, the transaction price and volume will be traded in the competitive market. If an IPP provides a relatively low transaction price under the similar characteristic of power generation, they will replace the generation of utility. Thus, the objective is to minimize the cost, which consists of generation expansion cost and purchasing electricity from lPPs while satisfying the load balance and operational constraints. The objective function can he formulated as:
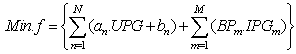 | (1) |
2.1. Power Balance Constraints
- The constraint states that the generated power from all the plants must be equal to the sum of the power demand and the reserve power.
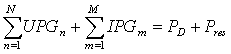 | (2) |
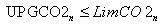
2.2. Generation Limits Constraints
- The capacity of new plant is limited by upper and lower limits.
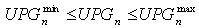 | (3) |
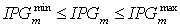 | (4) |
2.3. Emission CO2 Constraints
- The emission of each plant should not exceed the pre-specified value and the total emission of all plants is also over the pre-specified value.
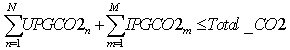 | (5) |
 | (6) |
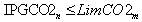 | (7) |
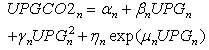 | (8) |
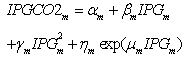 | (9) |
2.4. Bargain Condition
- In this paper, we assume that only the purchase price is higher than the average generation cost, that is:
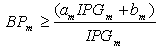 | (10) |
3. ECO Algorithm
- Election is one of the most important political activities in human society. Sample surveys are employed widely in campaign to forecast the election results. Campaign is important behaviour in election. Election candidates always pursue the maximum support from voters by means of various election actions.Election campaign is a process that candidates seek maximum support from voters by a series of campaign, and optimization is to find the best in numerous feasible solutions; they are similar to some degree. It can be imagined that there is an optimization mechanism in the election process that can be simulated to establish a new optimization algorithm. ECO is a new heuristic optimization algorithm which acts by simulating the behaviour that the election candidates pursue the highest support in campaign all along[16]. In ECO, the whole searching space is imagined to be assembly of voters, and the current solutions are imagined to be the election candidates. The candidates can influence the voters round them, the effects from candidates to voters will decrease gradually with the increase of distances between the candidates and the voters. The higher prestige a candidate comports, the larger investigated range he has. The support from the different voters are discrepant obviously, voters have to allot their support proportionally according to the effects imposed by the candidates. Sampling investigate to voters is done to investigate the support of candidates. In ECO algorithm, solution space is assumed as an assembly of all voters, current feasible solutions are imagined as candidates. The function value of a candidate is defined as the prestige of the candidate. The prestige of a voter has the same definition.A few candidates are generated between the higher and lower bounds which are denoted as Ci their location coordinate are xCi. The search mechanism of ECO algorithm is described within a computing cycle as follows[17]:
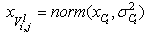
3.1. Compute the Prestige of Candidates
- The function value of a current solution, namely a candidate, is the prestige of the current candidate.
 | (11) |
3.2. Compute the Effect Ranges of Candidates
- The higher prestige a candidate is, the larger cover range the candidate has. Thus, it can be given by:
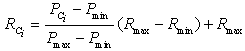 | (12) |
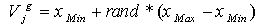
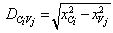
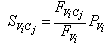
3.3. The Mean Square Deviation of Local Sample Survey
- The higher prestige a candidate is, the smaller the mean square deviation the candidate has, so that the ECO is able to converge to local best solution rapidly and steadily. The local sample-survey mean square deviation of candidate Ci is computed as follows:
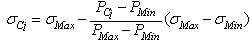 | (13) |
 | (14) |
 | (15) |
 | (16) |
 | (17) |
 | (18) |
 | (19) |
 | (20) |
 | (21) |
 | (22) |
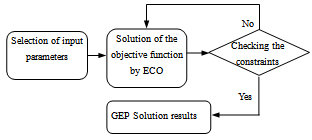
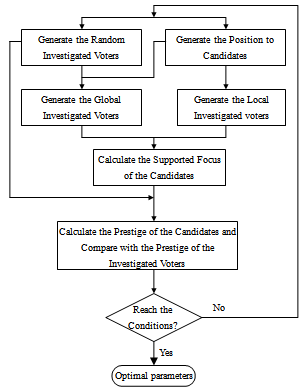 | Figure 1. Flowchart of ECO algorithm |
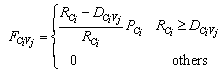
4. ECO Based Solution for GEP
- In the proposed method, we must minimize the cost, which consists of generation expansion cost along with purchasing electricity from IPPs while satisfying the load balance and operational constraints. To acquire an optimal combination, this paper employs ECO[12] to improve optimization synthesis and find the global optimum value of fitness function. In this study, the ECO module works offline. ECO is a population based evolutionary search algorithms characterized as conceptually simple, easy to impalement and computationally efficient. As it is reported in[12], this optimization technique can be used to solve many of the same kinds of problems as PSO and GA, and does not suffer from some of GAs difficulties. It has also been found to be robust in solving problem featuring nonlinearity, non-differentiability and high-dimensionality. ECO is the search method to improve the speed of convergence and find the global optimum value of fitness function.Noted that choice of the properly fitness function is very important in synthesis procedure. Because different fitness functions promote different ECO behaviors. For our optimization problem, the fitness function is introduced as follows:
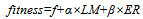 | (23) |
 | (24) |
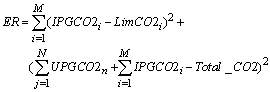 | (25) |
 | Figure 2. Steps of main solution algorithm for GEP |
5. Simulation Results
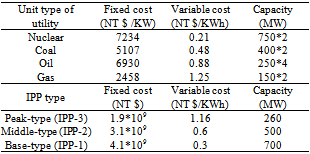
- The proposed algorithm is applied to a test system shown in Fig. 3 with a utility and 3 IPPs and Table 1 shows system details. Table 1 shows the fixed cost, variable cost and capacities of the plant types for future additions, respectively. The peak demand at a target year is assumed to 4100 MW and load-duration curve shown in Fig. 4. The emission model of the generation units according to Eqs. (8) and (9) is shown in Fig. 5.
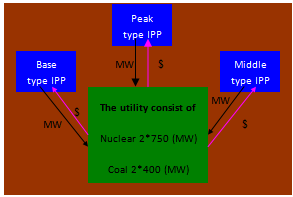 | Figure 3. Restructured power system scheme |
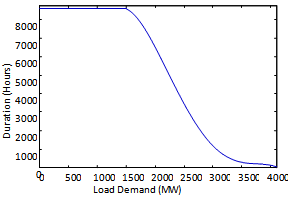 | Figure 4. Load duration curve |
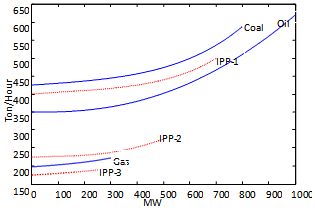 | Figure 5. The emission model of the generation unit |
|
|
5.1. First Condition
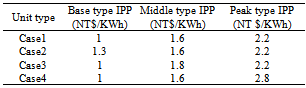
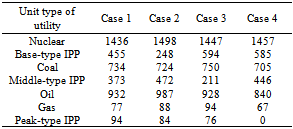
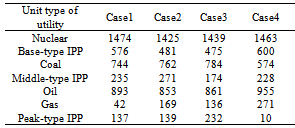
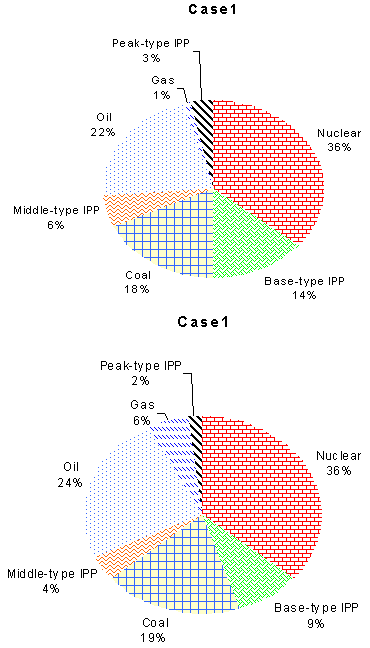
- In this condition, the limits of base-type IPP, middle-type IPP and peak-type IPP are 440, 260 and 175 ton/h, respectively. This paper supposed four purchase prices for the different types as shown in Table 3. The total CO2 emission of all plants is also limited to 3000 ton/h. Table 4 and Fig. 7 show the simulation results under different purchase prices for each IPP. It can be seen that, when the transaction price of IPPs is raised in various periods, the purchasing electricity of the utility will reduce for minimizing total GEP cost. That is, if the transaction price of IPPs is lower, the competitive ability of IPPs is strong enough to sell more electricity to the utility.
|
|
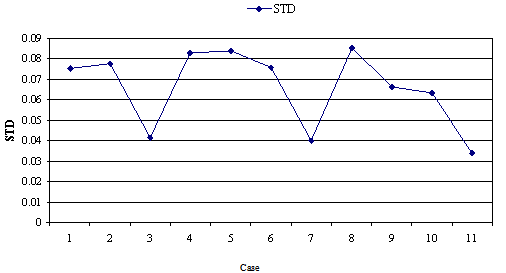 | Figure 6. Standard deviation of the best solution to each problem |
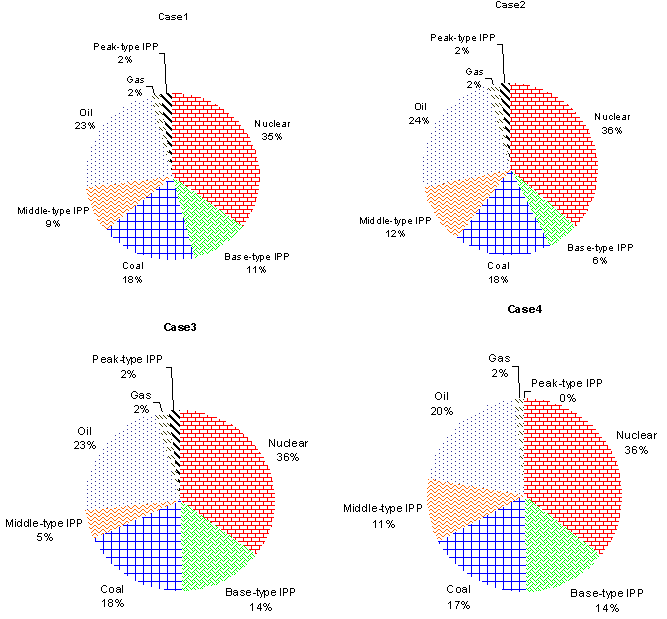 | Figure 7. Optimal generation combination in 1st condition |
 | Figure 8. Optimal generation combination in second condition |
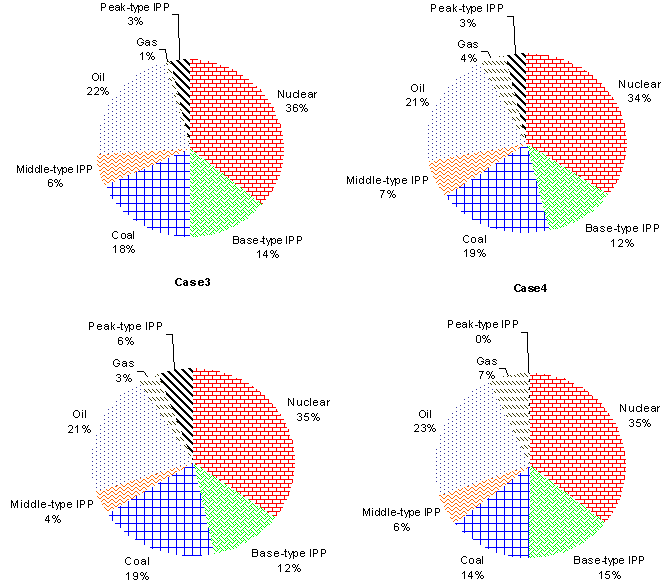
5.2. Second Condition
- In this condition all characteristics of GEP problem are same as the first condition except the limit of total CO2 emission that is selected 2300 ton/h. Table 5 and Fig. 8 show the simulation results under different purchase prices for IPPs. It can be seen that if the emission limit is seriously required in the market, the gas unit of the utility must be introduced for satisfying the emission constraints.Fig. 9 shows the total GEP cost using the proposed method under different purchase prices for IPPs. It can be seen that due to the transaction price of IPPs expensive; the generators of the utility are then produced more electricity to reduce total cost under various emission limits. Also, as shown in Fig. 9, when is transaction price of the peak-type IPPs is raised, the total cost is not increased, conversely, is reduced. On the other hand, the total cost will be reduced if the peak-type IPPs are introduced for the utility and therefore case 4 is a better strategy for the mixed generation planning.
 | Figure 9. The total cost of the utility (billion NT$) |
|
 | Figure 10. (a) Percentage of generation under emission limit of IPPs and (b) percentage of generation under serious emission limit of IPPs |
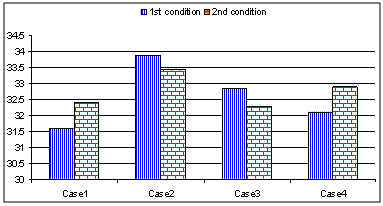
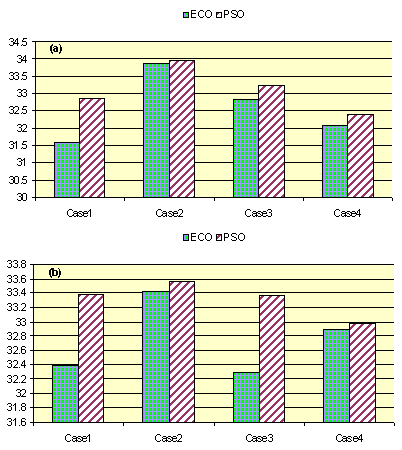 | Figure 11. The total cost of the utility (a) 1st condition (b) 2nd condition |
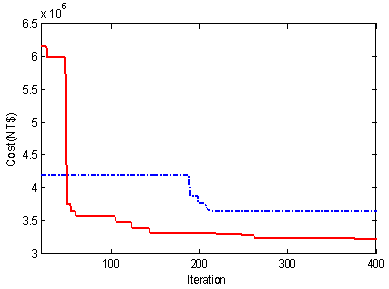 | Figure 12. The comparison of ECO and PSO methods |
6. Conclusions
- In this paper, a new approach based on the ECO technique is proposed for minimizing generation expansion planning cost in the competitive market environments. The proposed method has been applied on a test system with one utility including three IPPs under different purchase prices for IPPs and CO2 emission limits in comparison with the PSO based technique to illustrate its robust performance. Simulation results show that it can be guaranteed a good solution quality and a better performance. Also, the GEP cost is significantly improved by the proposed ECO based algorithm than the PSO based technique. Thus, the proposed method can be used as a practical planning tool for solution of the GEP problem of a real world power system in competitive environment.