-
Paper Information
- Next Paper
- Previous Paper
- Paper Submission
-
Journal Information
- About This Journal
- Editorial Board
- Current Issue
- Archive
- Author Guidelines
- Contact Us
Electrical and Electronic Engineering
p-ISSN: 2162-9455 e-ISSN: 2162-8459
2012; 2(6): 383-388
doi: 10.5923/j.eee.20120206.07
Magnetic Anisotropy in Silicon Iron Alloys
 Abstract
 Reference
 Full-Text PDF
 Full-Text HTML
Veronica Paltanea, Gheorghe Paltanea, Horia Gavrila
Department of Electrical Engineering, POLITEHNICA University from Bucharest, Bucharest, Romania
Correspondence to: Gheorghe Paltanea, Department of Electrical Engineering, POLITEHNICA University from Bucharest, Bucharest, Romania.
| Email: |  |
Copyright © 2012 Scientific & Academic Publishing. All Rights Reserved.
In this article it is presented a study of the magnetic anisotropy of non-oriented and grain oriented Fe-Si strips with the surface area of 280 x 30 mm2. The measurements were performed with a unidirectional single strip tester on Fe-Si strips cut at 0, 15, 30, 45, 60, 75, 90 with the rolling direction. For the representation of the magnetic field strength at constant magnetic flux density it was used a software program that interpolated the experimental results. It was determined the hard and the easy axis of the samples and the influence of the frequency on the anisotropy of the materials.The loss behaviour of these alloys was studied as a function of frequency in the range of 5 Hz to 200 Hz at a given magnetic polarization (Jp) of 1 T and using the concept of loss separation for the data analysis it was given a correlation between the different types of losses and the anisotropy axis.
Keywords: Magnetic Anisotropy, Silicon Iron Strips, Magnetic Domains, Rolling Direction
Cite this paper: Veronica Paltanea, Gheorghe Paltanea, Horia Gavrila, "Magnetic Anisotropy in Silicon Iron Alloys", Electrical and Electronic Engineering, Vol. 2 No. 6, 2012, pp. 383-388. doi: 10.5923/j.eee.20120206.07.
Article Outline
1. Introduction
- Grain oriented (GO) and non-oriented (NO) laminations owe their continuing importance as a unique subject of basic research studies and industrial applications to their excellent crystallographic properties[1]. While in many cases physical modelling has been limited to the properties related to the rolling direction, the use of computational methods in magnetic cores call for the knowledge of magnetization curve and hysteresis loops on different axis from the rolling direction[2, 3]. For evaluating and controlling the quality of magnetic materials, magnetic properties, such as B(H) curves and core losses, are measured under one-dimensional (1D) alternating and/or two-dimensional (2D) rotating magnetic fluxes, according to the application requirement.The standard magnetic measurements using either the Epstein frame or the single strip tester are limited to the rolling direction measurements for the GO Fe-Si materials. For the NO ones, standard measurements give an average of the magnetic behaviour in the rolling and the transverse directions. The hysteresis in the rolling direction BL(HL) in the case of Fe-Si GO strips and an average one in the case of Fe-Si NO stripswere obtained.The total error of any magnetic measurement depends on the exciting field error, the error of the magnetic to electric variables conversion and the error of integral electric values measurement[4- 6].Thin anisotropic electrical strips (Fe-Si GO) are manufactured by cold rolling of low carbon steel containing about 3.5 wt% Si. The crystallites of Fe-Si GO laminations have their[001] easy axis closed to the rolling direction and their (110) plane nearly parallel to the laminations surface. This is so-called Goss texture which can lead to coercivefieldsas low as 4-10 A/m and a maximum relativepermeabilityaround 5104. GO laminations are subdivided in two classes: conventional grain oriented (CGO) and high permeability (HGO)[7, 8]. In this article it was used CGO materials which have the following preparation steps: first the composition is melted, vacuum degassed and casted in slabs; theslabs are reheated at 1300-1350 C and hot rolled to the thickness of 2 mm, annealed at 900-1100 C and rapid cooled; after that it is done a two-stage cold rolling to the final gauge; in the end it is done a decarburizing anneal in wet H2 atmosphere at 800-850 C, followed by cooling and an 48 hours box annealing at 1200 C[8]. They are produced in a variety of sizes, ranging between 0.05 and 0.20 mm thickness and between 25 and 120 mm in width. Anisotropic strips exhibit relatively low magnetic losses (being a function of thickness, magnetic induction, resistivity and frequency) and large magnetic induction in their easiest direction of magnetization. These strips are manufactured in small amounts for a typical use in wound or stacked magnetic cores working at high frequencies or at impulse conditions [7].The non-oriented Fe-Si alloys (Fe-Si NO) have an approximately isotropic grain texture, but they present a slightly anisotropy with the easy axis parallel with rolling directions and hard axis perpendicular of the rolling directions[6]. They are available in a variety of grades, the higher ones being associated with higher Si content. The Si concentration can vary between 1 and 3.7 wt% which increased the alloy resistivity without impairing the mechanical properties. Lower grade laminations up to 2 wt% Si are produced in the semi-processed state with thickness between 0.5 and 0.65 mm. The preparation stages of the Fe-Si NO strips include a cold rolled to intermediate gauge,annealed at 750-900 ℃ to reduce to the final gauge of 0.35-0.65 mm. The strips are then subjected to a recrystallization and decarburization anneal at 830-900 ℃ and a final grain-growth anneal at 850-1100 ℃[8].Such thin electrical strips display beneficial magnetic properties both at high frequencies and at impulse work conditions. Some applications imply the characterization of Fe-Si grain-oriented and non-oriented laminations along a direction different from rolling direction. This serves to emulate, for instance, the working conditions in certain parts of electrical machine cores[5]. In materials such as Fe-Si strips magnetization is determined by the motion of 180 and 90 walls until the net force on all walls is zero[8].In order to measure the magnetic characteristics of the electrical steel strips with a double C-yoke single strip tester, the samples were properly prepared and placed in a magnetic field, created by a coil system. The measuring system consists of a primary coil that generates a magnetic field, which causes the magnetic flux in the tested strip. The magnetic field generator is a solenoid of rectangular cross section, dimensioned to ensure the generation of a magnetic field, intense enough to bring the sample into a desired state of magnetization, in which are measured the energy losses. An important requirement is that the solenoid must ensure a high uniformity of the magnetic field, applied along the sample in the measurement area.The magnetic field strength is determined by the number of windings and the length of the coil. The number of turns and the length are determined by measuring the geometry of the apparatus. The magnetic field strength is calculated from the electrical current, picked from a shunt of known value, connected in series with the magnetizing coil. The magnetic flux density is determined by measuring the voltage, induced in the secondary coil of the measuring system.The measurement of the magnetic properties is made with a sinusoidal magnetic flux density in accordance with DIN 50462 standards. The secondary voltage must also be sinusoidal.
2. The Influence of the Frequency on the Anisotropy of Silicon Iron Strips
- The influence of frequency on the anisotropy of Fe-Si GO and NO strips was studied. Measurements at three frequencies f = 5, 50, 100 Hz were made and a comparison between the polar diagrams at a constant value of magnetic flux density B was represented.The variation of magnetic field for Fe-Si GO strips at f = 5, 50 Hz at low(B = 0.5 T), medium (B = 1.02 T) and high (B = 1.5 T) magnetic flux densities as a function of the cutting angleis represented in Figures 1, 2 and 3.
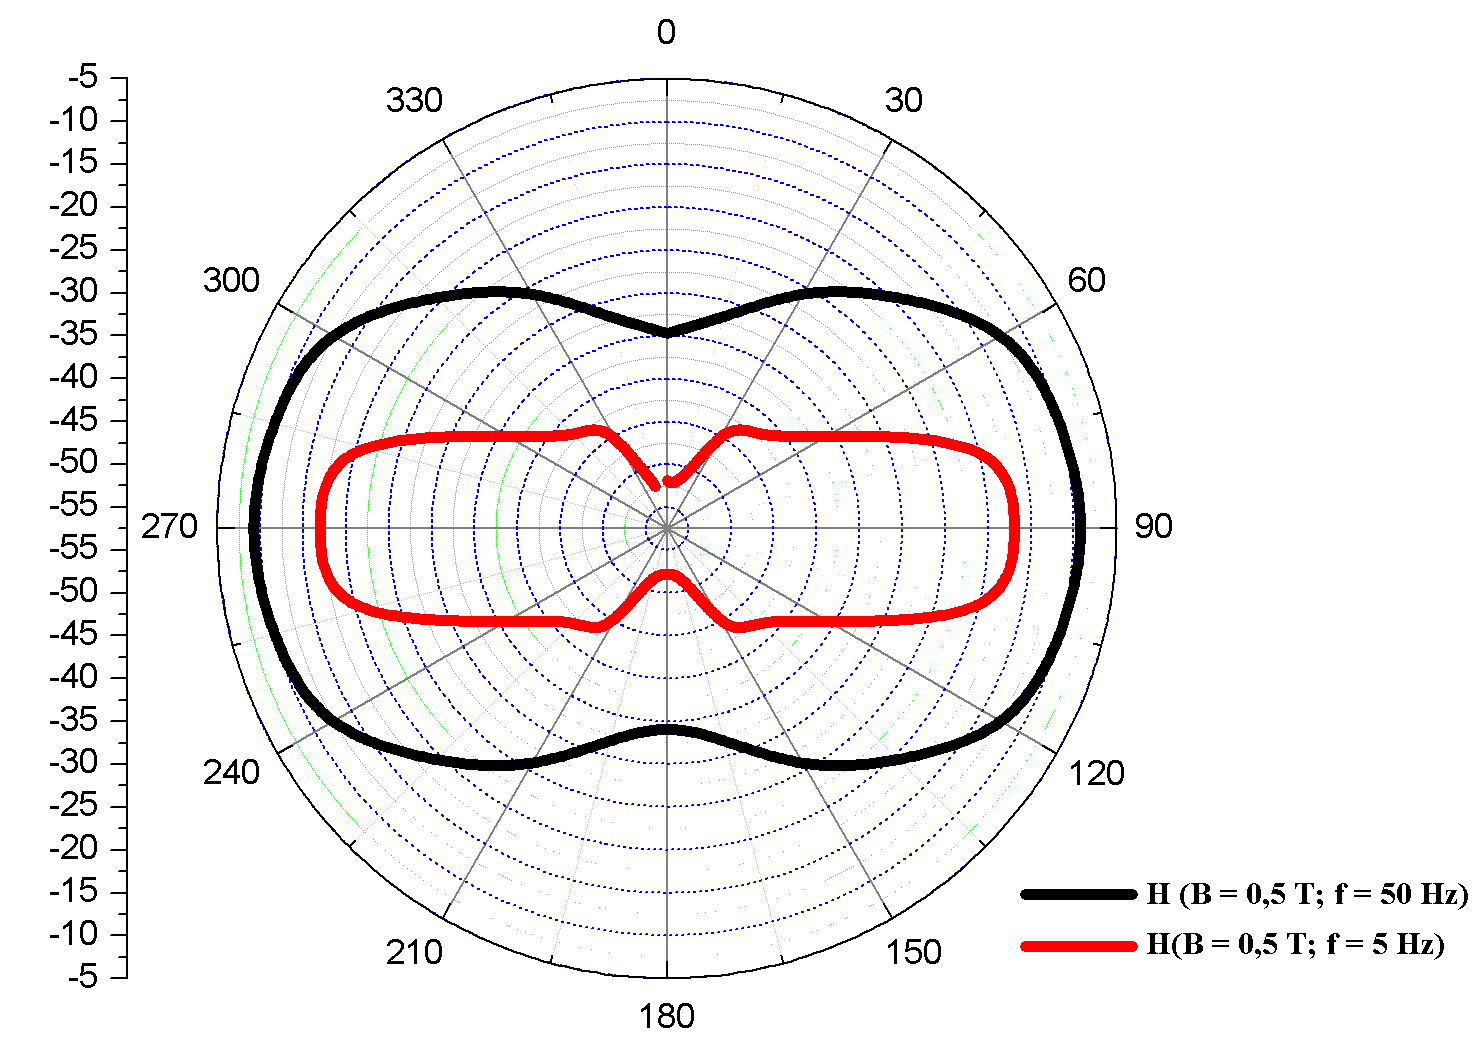 | Figure 1. Comparison between polar diagrams of the magnetic field in the case of Fe-Si GO strips at B = 0.5 T and frequencies f = 5, 50 Hz |
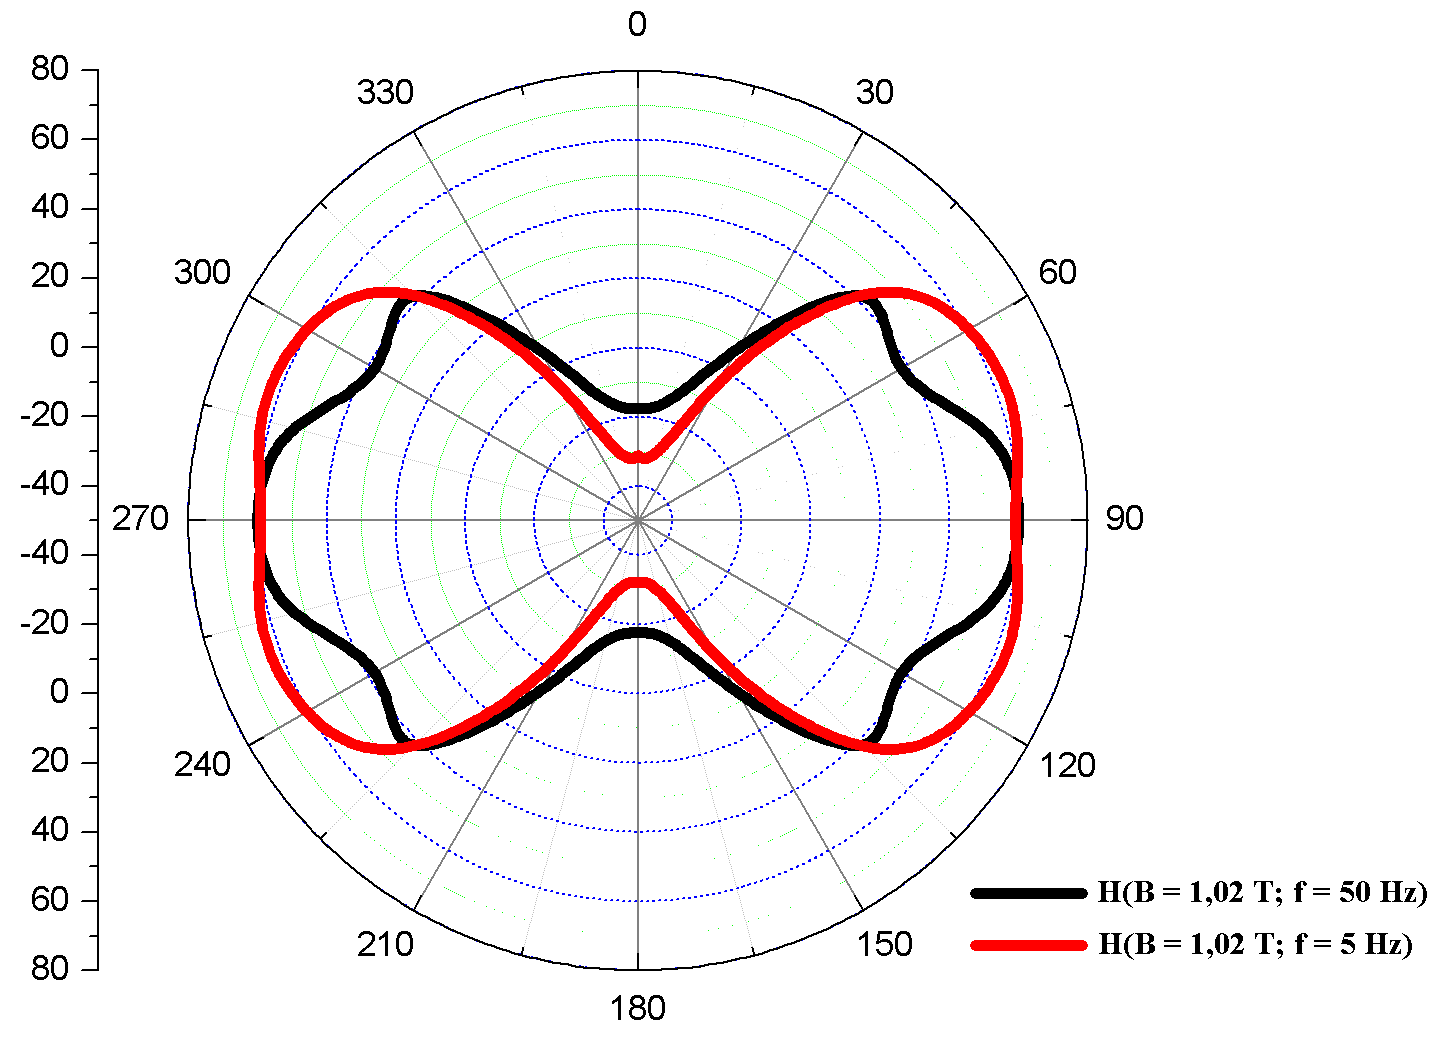 | Figure 2. Comparison between polar diagrams of the magnetic field in the case of Fe-Si GO strips at B = 1.02 T and frequencies f = 5, 50 Hz |
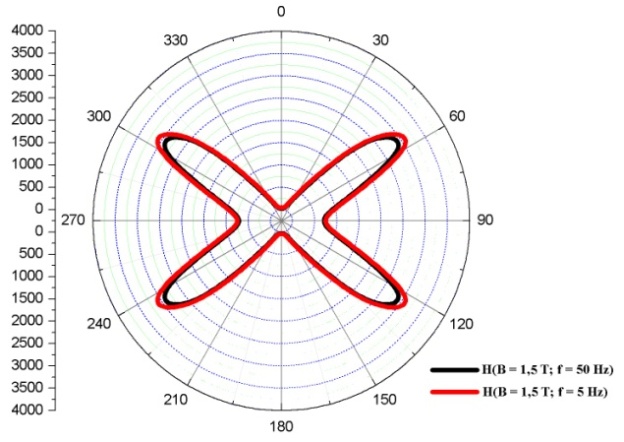 | Figure 3. Comparison between polar diagrams of the magnetic field in the case of Fe-Si GO strips at B = 1.5 T and frequencies f = 5, 50 Hz |
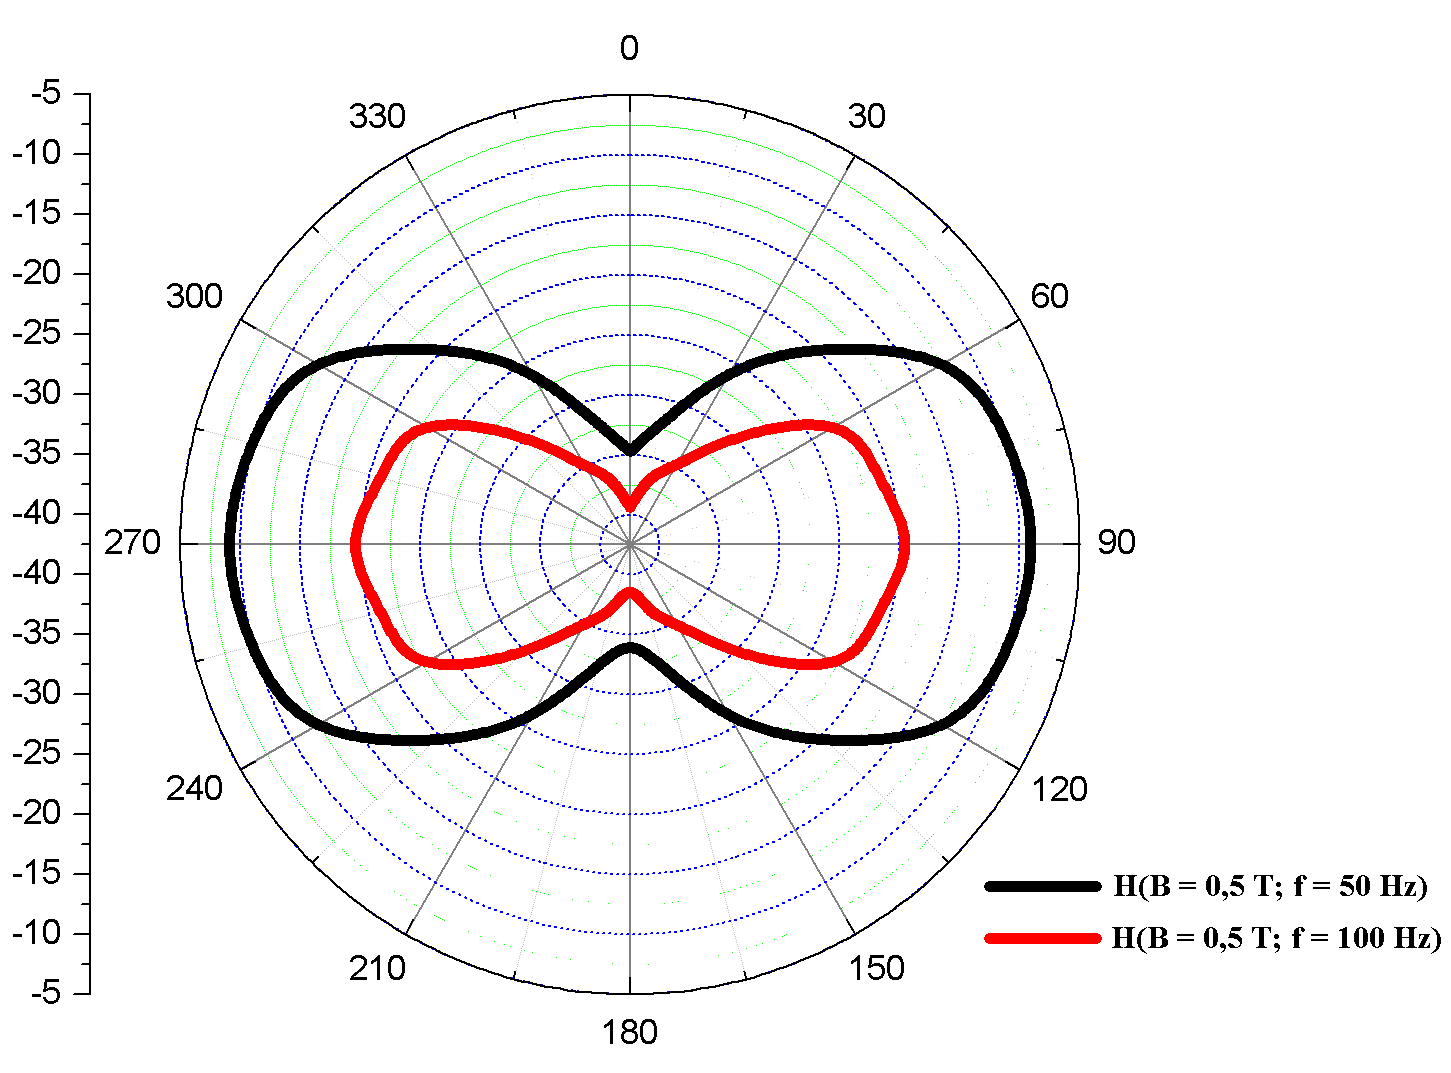 | Figure 4. Comparison between polar diagrams of the magnetic field in the case of Fe-Si GO strips at B = 0.5 T and frequencies f = 50, 100 Hz |
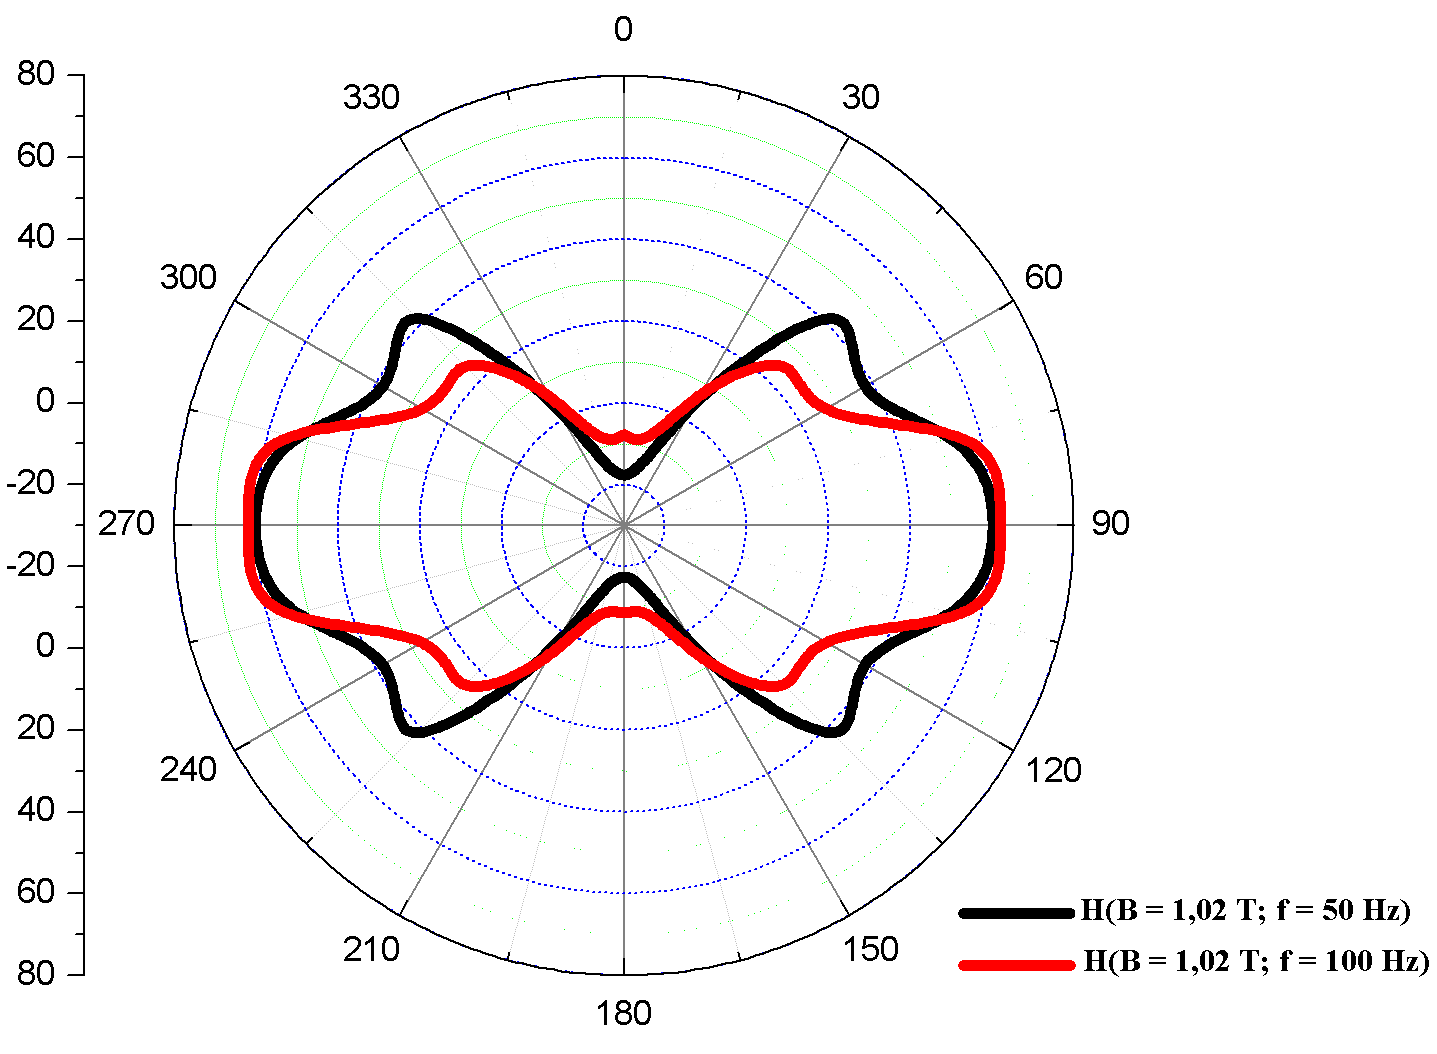 | Figure 5. Comparison between polar diagrams of the magnetic field in the case of Fe-Si GO strips at B = 1.02 T and frequencies f = 50, 100 Hz |
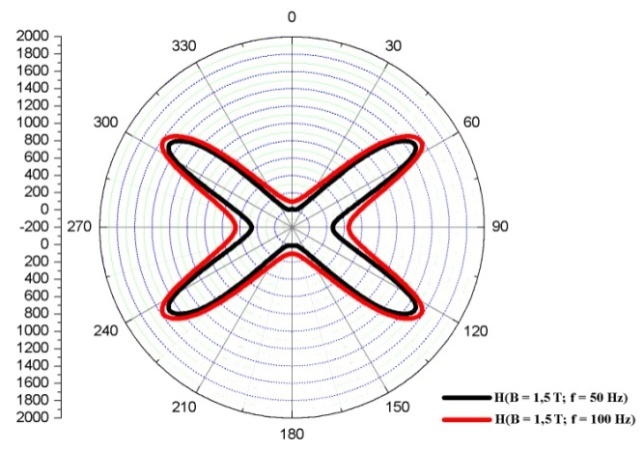 | Figure 6. Comparison between polar diagrams of the magnetic field in the case of Fe-Si GO strips at B = 1.5 T and frequencies f = 50, 100 Hz |
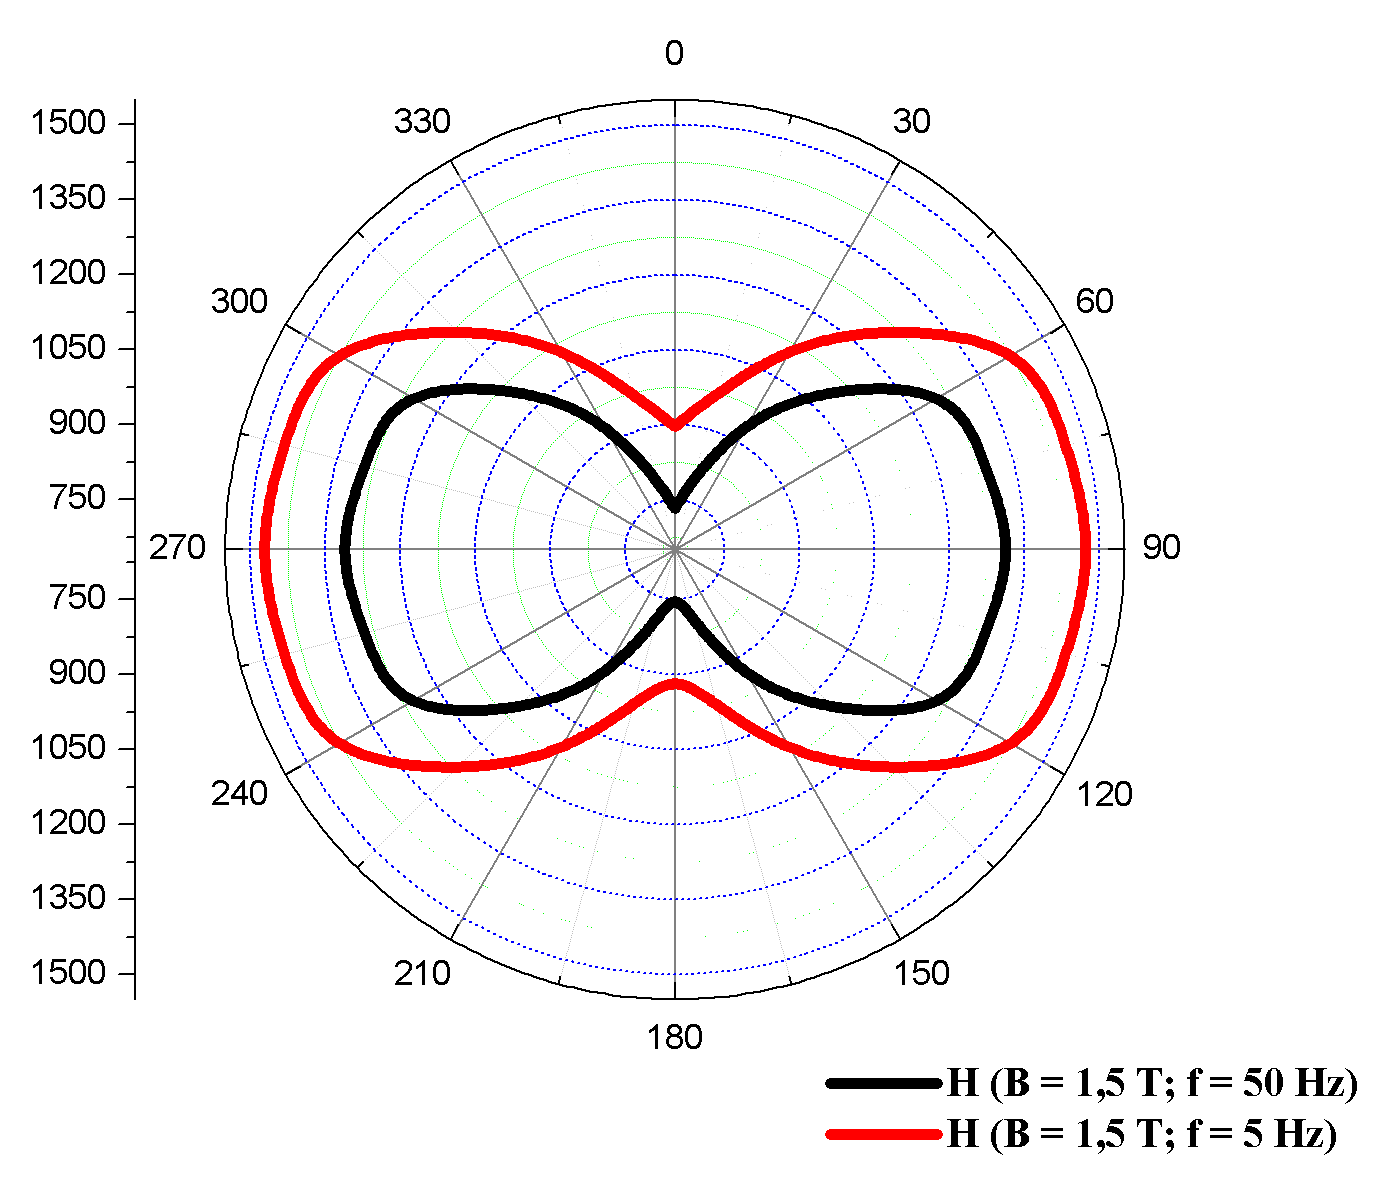 | Figure 7. Comparison between polar diagrams of the magnetic field in the case of Fe-Si NO strips at B = 1.5 T and frequencies f = 5, 50 Hz |
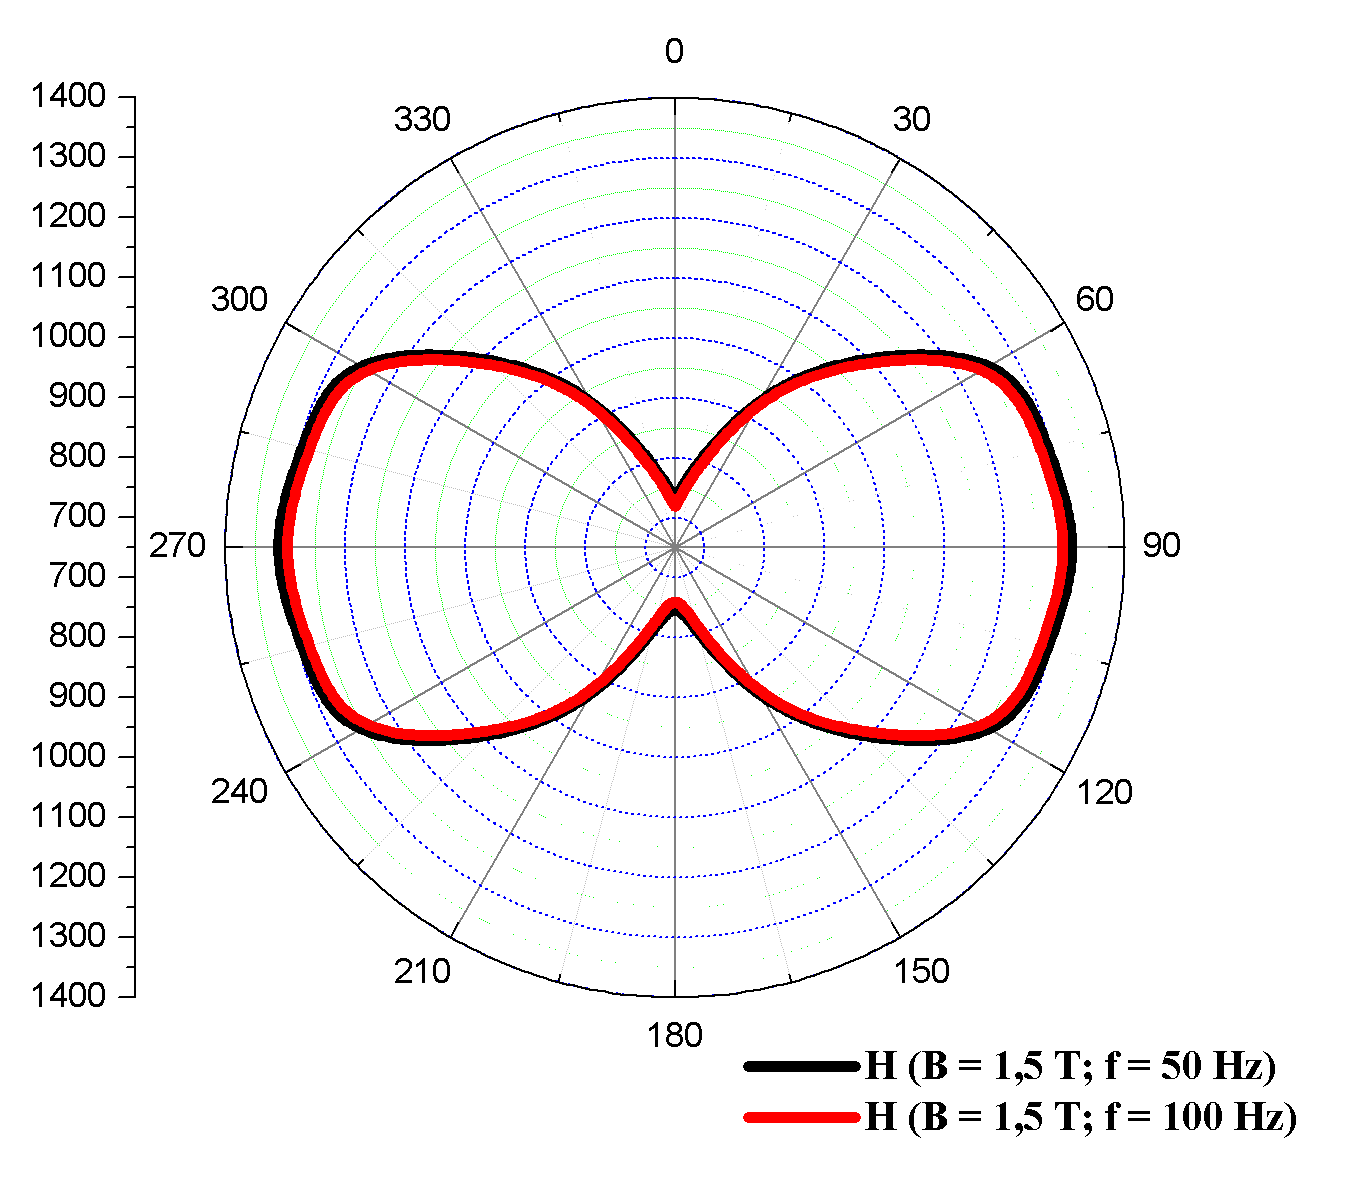 | Figure 8. Comparison between polar diagrams of the magnetic field in the case of Fe-Si NO strips at B = 1.5 T and frequencies f = 50, 100 Hz |
 | Figure 9. Magnetic domain structures in a Fe-Si GO strips in demagnetized state |
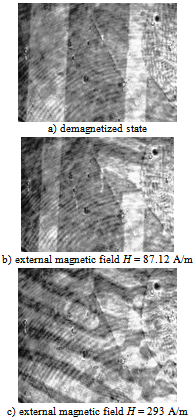 | Figure 10. Dynamic magnetic domain observation in a Fe-Si GO strip cut at 60 with the rolling direction. In demagnetized state can be observed a reduce magnetic domain area, which tends to increase when an external magnetic field it is applied |
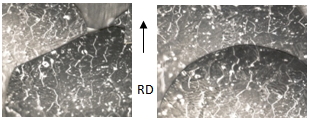 | Figure 11. Magnetic domain structures in a Fe-Si NO strips cut at 0 with the rolling direction in demagnetized state |
3. Anisotropy Influence on Specific Energy Losses
- The total energy losses required for a magnetization cycle can be decomposed into the sum of hysteresis (Wh), classical (Wcl) and excess loss (Wexc) components. This separation allowstreating individually loss mechanisms that occur on different space-time scales once at a time, as if they were independent of each other.The hysteresis loss is generated by fine-scale instabilities and can be analysed viathe coercivity mechanisms. In the case of eddy loss (classical loss) generated by eddy currents, the sample geometry is important. The material is treated like a homogenous medium.The direct consequence of the magnetic domain structure is the excess losses which are very difficult to determine, as result of the great variety of domain structures.The total energy losses in case of GO and NO strips are presented in Figures 12 and 13. One can notice that the anisotropy axis are direct related to the specific energy losses, with the lowest values at the rolling direction (GO and NO strips) and the highest values at 60° in case of GO strips, respectively at 90° in case of NO strips.
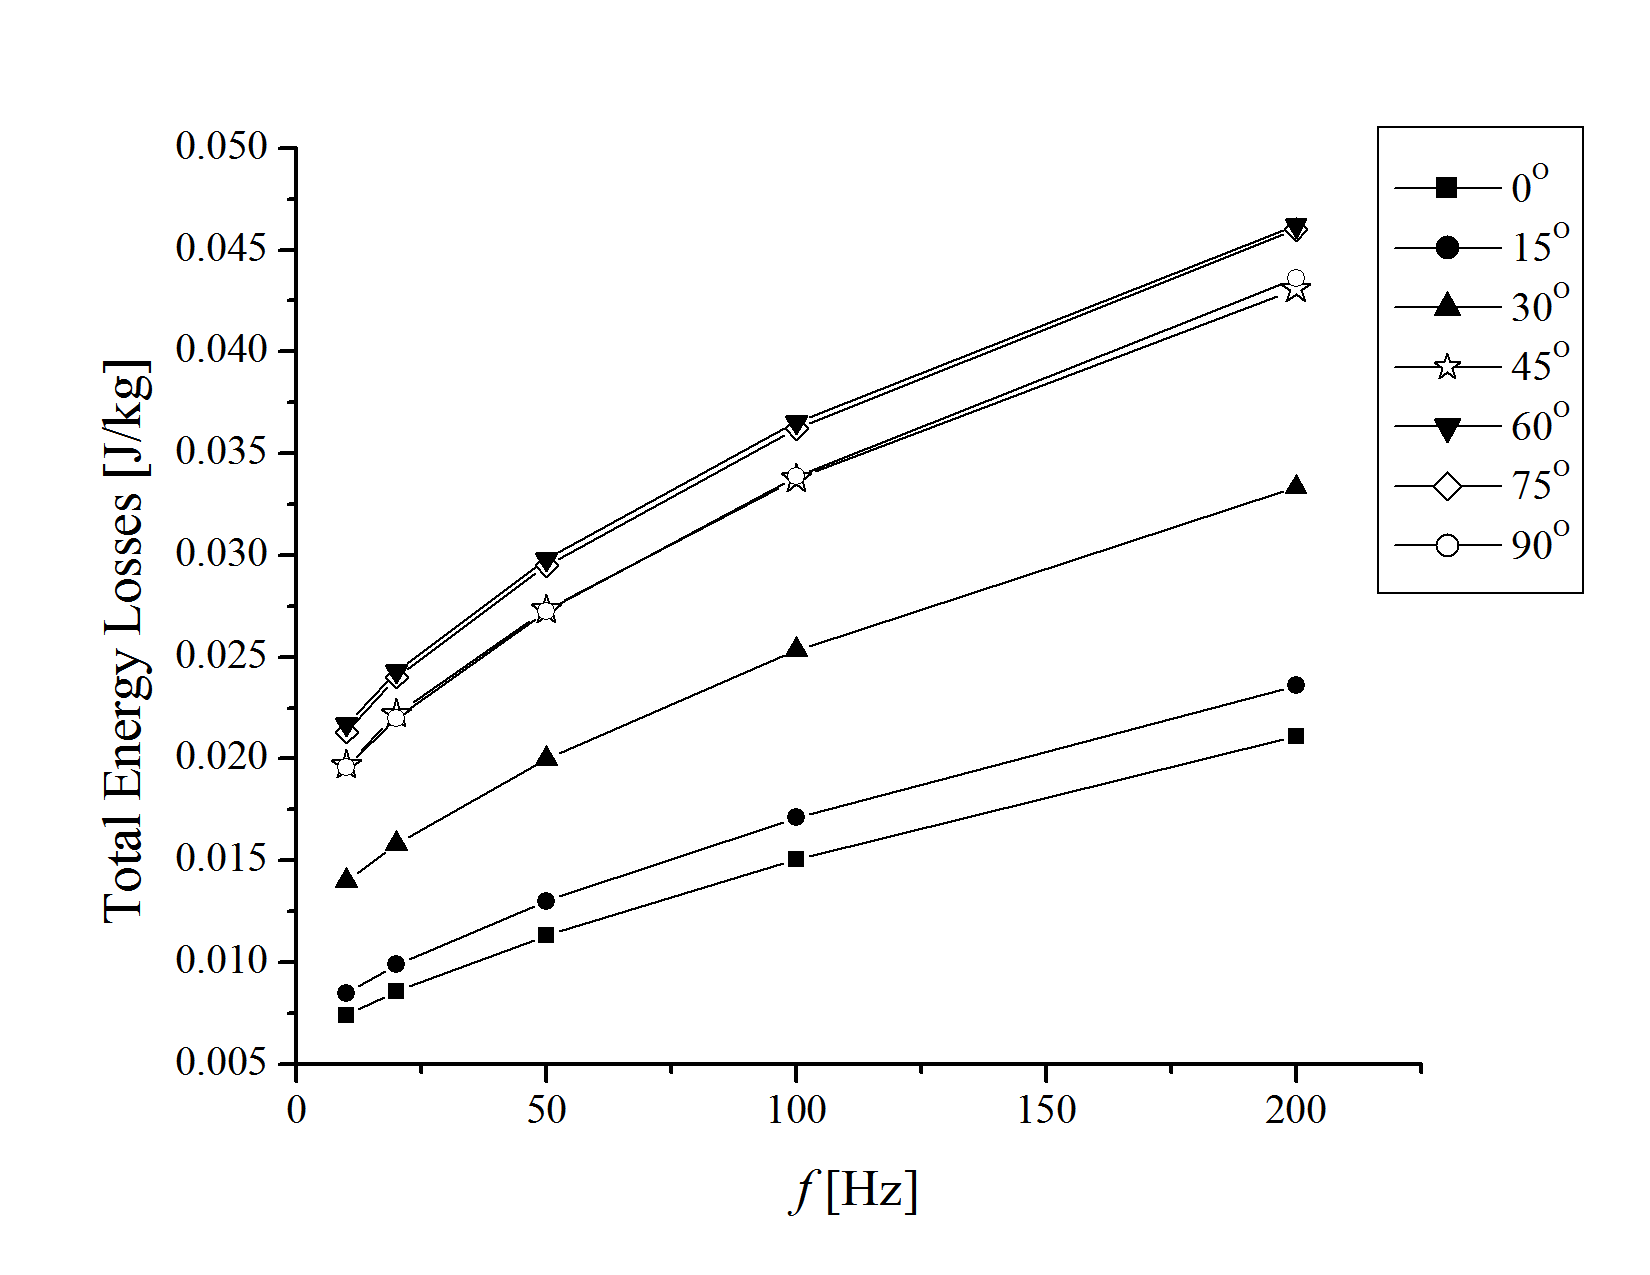 | Figure 12. Specific energy losses in case of Fe-Si GO strips cut at different angles with the rolling direction at Jp = 1 T |
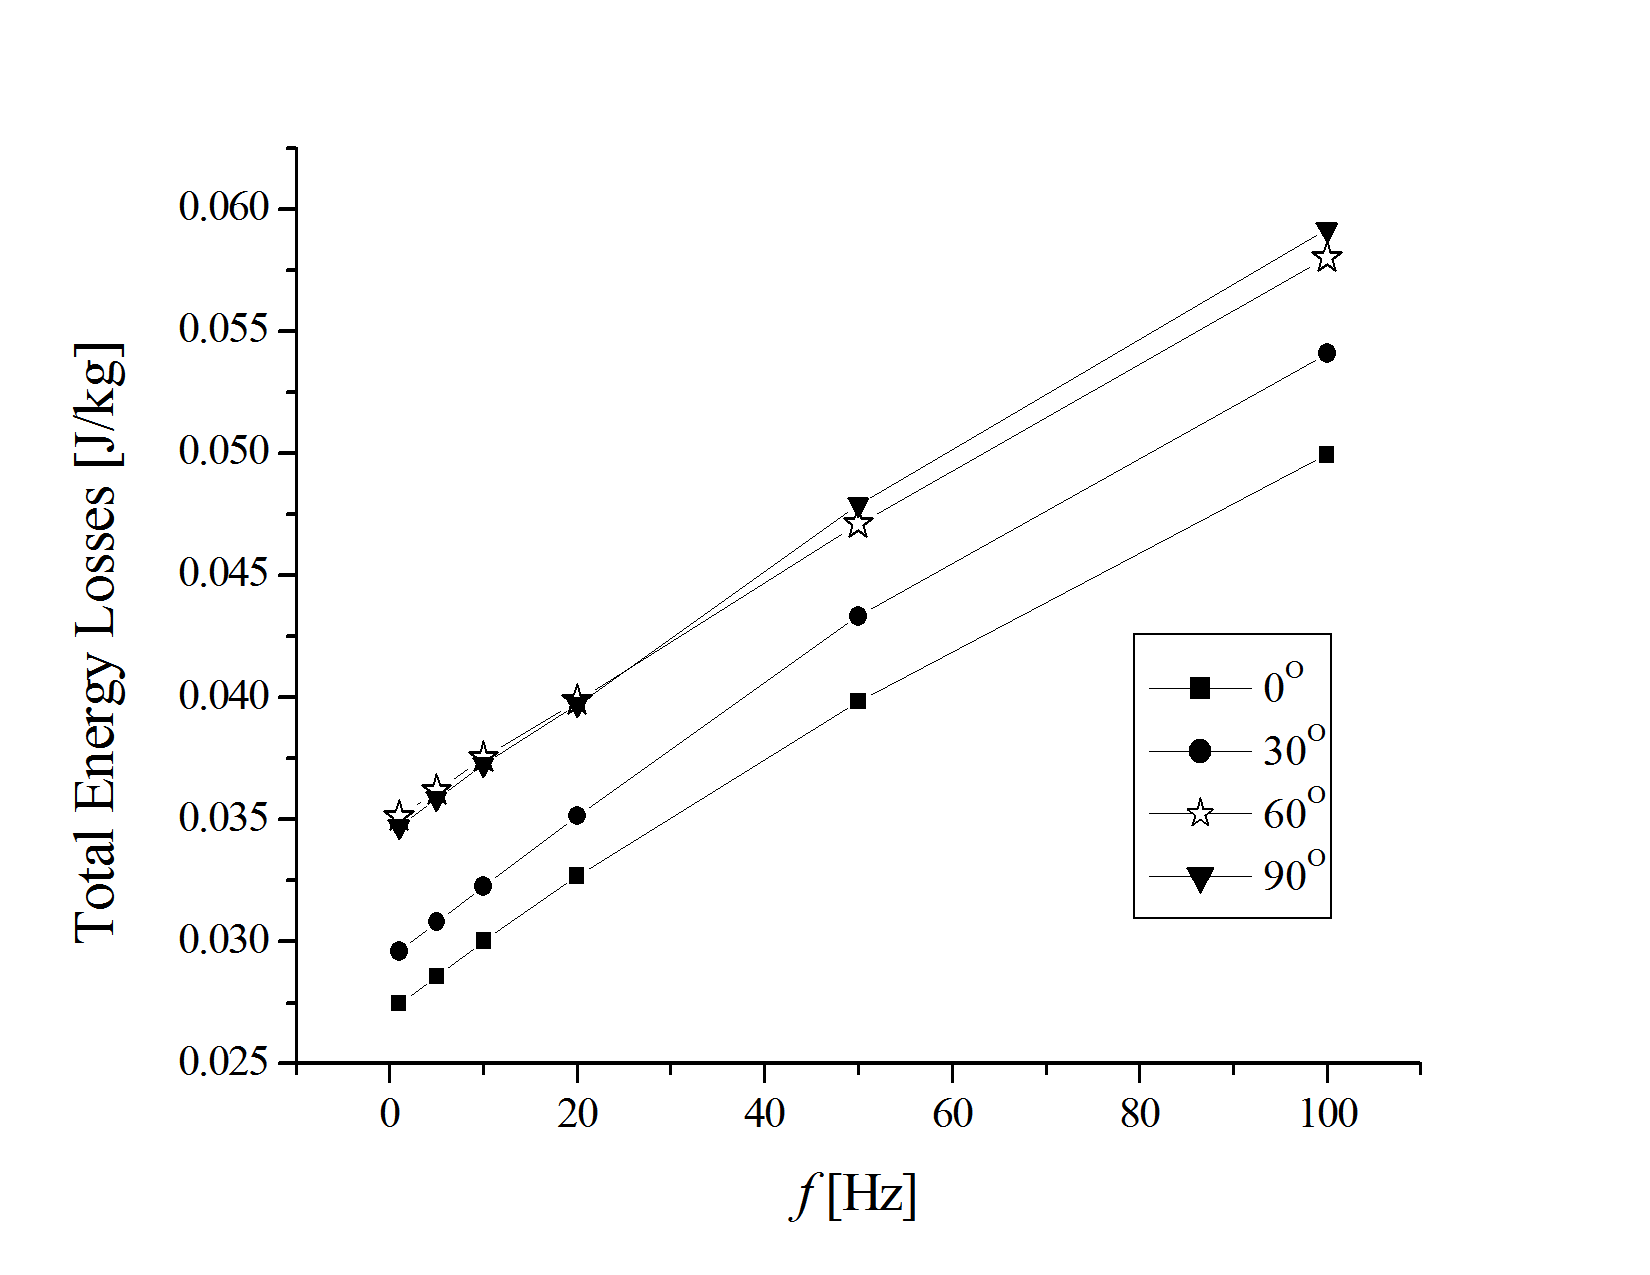 | Figure 13. Specific energy losses in case of Fe-Si NO strips cut at different angles with the rolling direction at Jp = 1 T |
 | (1) |
 | Figure 14. Variation of the excess energy losses versus frequency in the case of Fe-Si GO strips at Jp = 1 T |
 | Figure 15. Variation of the excess energy losses versus frequency in the case of Fe-Si NO strips at Jp = 1 T |
 | Figure 16. Variation of the hysteresis energy losses versus angle in the case of Fe-Si GO and NO strips at Jp = 1 T |
4. Conclusions
- The experiments, presented in the paper, reflect the macroscopic anisotropy of the material, which is deliberately strong for the Fe-Si GO strips and must not be neglected in the case of Fe-Si NO strips. It was observed, in the case of Fe-Si GO strips that, in the domain of low induction, the hard axis is placed at 90°and not at 60°, because not all the grains are oriented in the lamination direction and in the range of high induction the hard axis is placed at 60°and the easy axis at 0°. In the case of small magnetic fields the probable reason for the change of the hard axis from 60°to 90° can be associated with the magnetic domain structure of the material[10].The rolling and the transverse directions are the only ones, for which properties can be definedindependent of the specific sampleshape[15, 16]. For a generic direction the measuring conditions (i.e.sample geometry) must be specified. Single strips are expected to display intermediate behaviours.At the magnetic flux density B = 1.5 T in the case of Fe-Si GO strips is obtained a polar diagram,independent of applied frequency (Figure 3 and 6). In the case of Fe-Si NO stripsthe polar diagrams are different atlow frequencies (Figure 7) and identically at high frequencies (Figure 8).
ACKNOWLEDGEMENTS
- This work was supported by a grant of the Romanian National Authority for Scientific Research,CNDI–UEFISCDI, project number PN-II-PT-PCCA- -2011-3.2-0373.