-
Paper Information
- Next Paper
- Previous Paper
- Paper Submission
-
Journal Information
- About This Journal
- Editorial Board
- Current Issue
- Archive
- Author Guidelines
- Contact Us
Electrical and Electronic Engineering
p-ISSN: 2162-9455 e-ISSN: 2162-8459
2012; 2(4): 217-225
doi: 10.5923/j.eee.20120204.07
Artificial Intelligence Approaches to Advance Signal Processing and Simulation Methods for Efficient Power Supplies
 Abstract
 Reference
 Full-Text PDF
 Full-Text HTML
Paresh J. Shah 1, Rakesh Saxena 2, M P S Chawla 2
1E & TC Engineering, SSBT’s COET, Jalgaon, Maharashtra, India
2Electrical Engineering, SGSITS, Indore, Madhya Pradesh, India
Correspondence to: Paresh J. Shah , E & TC Engineering, SSBT’s COET, Jalgaon, Maharashtra, India.
| Email: |  |
Copyright © 2012 Scientific & Academic Publishing. All Rights Reserved.
This paper gives a different signal processing techniques, which are widely used for improving efficiency of power supplies. There are several numbers of power quality problems in power supplies, such as voltage sag, high harmonic currents, voltage swells, power-quality disturbances, a wide spectrum of harmonic components etc. This paper suggests different artificial intelligence approaches to advance signal processing techniques for improving the power quality. Today electronics systems are often composed of mixed analog and digital components. In order to simulate the entire system, many types of software should work together and co-simulation is necessary for power drivers. In this paper, the modeling of a power supply system using matlab/simulink, VHDL, FPGA module for PWM generator is presented. The power supplies are consisting of different power converters which are modeled and simulated in simulink environment. This design approach presents all the advantages of software and features.
Keywords: Adaptive Prony Method (APM), Discrete Fourier Transform (DFT), Time-Frequency Distributions (Tfds), Transform Domain Adaptive Filters (TDAF), Wavelet Packet Transforms (WPT), Power Factor Correction (PFC), Fast Fourier Transform (FFT)
Article Outline
1. Introduction
- Nowadays, the quality of voltage waveforms is an issue of the utmost importance for power utilities, electric energy consumers and also for the manufactures of electric and electronic equipment. There are several problems and techniques for power quality improvement as being discussed by different researchers. Author[1] has discussed the adaptive Prony method which has used to calculate PQ indices based on a time–frequency analysis of waveforms. Paper[2] gives a novel real-time digital signal processing technique for power quality disturbance detection. This technique inspired on the Divide and Conquer principle and on the innovation concept. The Divide and Conquer principle applied in splitting the monitored disturbance event into stationary and non-stationary components, allowing localized individual signal analysis. Author[13] have discussed, the length of decomposition results of traditional wavelet packet transform (WPT) decrease by half, in the next level for down sampling, then the length of sequences in the last become very short and inconvenient for further analysis of these sequences.Simulink enables the user to model, simulate and analyse the most significant signals. A sim power systems library is use to create a model, to simulate the effective system behaviour. Obviously all system components, digital once included, must be described by using mathematical equations and libraries blocks. This paper describes a method used to simulate power driver circuits using the simulink toolbox within matlab software, the digital control is described in very high speed integrated circuit hardware description language (VHDL) by using active-HDL, field-programmable gate array (FPGA) -based real-time simulator etc.
2. Advanced Signal Processing Methods
- A power quality problem can be described as any variation in the power supplies, such as voltage sags and swells, interruptions, transients, harmonics, notches, and fluctuations etc. This section of the paper deals with some of the artificial intelligence approaches which handle such types of problems with merits. From the time-domain point of view, PQ disturbances can be classified into “continuous” and “discrete” disturbances. Continuous disturbances can be present in every waveform cycle, while discrete disturbances appear as isolated and independent events[7]. With reference to continuous disturbances, most PQ indices have been developed for periodic signals. Unfortunately, the widespread use of power drivers and other nonlinear loads cause waveforms characterized by spectral components that are significantly time varying in amplitude and/or in frequency[1].
2.1. Adaptive Prony Method
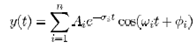
- Voltage waveforms with discrete PQ disturbances are characterized by spectral components with variations localized in short time intervals. The signals characterized by the aforementioned continuous and discrete disturbances can be non-stationary and should be analyzed using time frequency representations. The representation of signals in the time-frequency domain has been of interest in the signal processing field. A classical time frequency representation was the short-time Fourier transform (STFT), which was a simple extension of the FFT, where the FFT repeatedly applied to a windowed version of the time domain signal[8]. Other methods to analyze non-stationary signals, consider time-frequency distributions (TFDs). The basic objective of TFDs was to provide simultaneous time and frequency information on the energy content of the signal. All TFDs can be obtained from the “Cohen’s class,” a generalized formulation for the time frequency frame. Different types of TFDs with special properties have been proposed for the improvement of the time-frequency resolution; some examples are the spectrogram, Wigner-Ville distribution, Choi Williams’s distribution, and reduced interference distribution (RID. In paper[9] the authors utilize a TFD analysis based on the reduced interference distribution to provide a unified definition of new PQ indices used for the characterization of non stationary waveforms in power systems. The new indices first require the separation of the analyzed waveform into two parts: the fundamental component and the disturbance waveform. The estimation of the fundamental component obtained using a curve fitting algorithm that assumes a fundamental frequency exactly equal to the power system frequency, while the disturbance waveform, calculated as a difference with the original waveform. Different types of TFDs are generalized through an equation that defines the “Cohen’s class.” The Cohen’s class of the waveform x (t) defined as
 | (1) |
 is the kernel of the time-frequency distribution, and z(t) is the complex analytic signal of the waveform x (t) given by
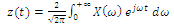 | (2) |
 is the Fourier transform of x (t).IDE (t) is defined as follows:
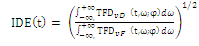 | (3) |
2.2. The Divide and Conquer Principle
- Power quality issues have emerged, after the worldwide energy market deregulation, as an exponentially demanding attention research field for electric utilities and end users. Among the many possible motivations of the researchers, the authors of[10] have highlighted the increasing use of electronic devices, nonlinear loads and microprocessor-based solutions in commercial centres and industrial plants. In addition, the electrical energy market has observed a growth in the number of independent power producers (IPP’s) with poorly controlled synchronization, an increase in competition, a somehow related reluctance to exchange information, besides new system interconnections and customers necessities. Several powerful tools have been recently developed to account for the proliferation of PQ disturbances resulted from aforementioned problems. In this context, the main monitored PQ disturbances include transients, long and short time voltage variations, flickers, interruptions, waveform distortions, unbalances, faults, etc[10].A recursive continuous wavelet transform algorithm has been chosen over the wide range of time-frequency computation tools from a qualitative study of new signal processing tools used for electrical disturbance analysis. This recursive continuous wavelet transform use the Chaari complex mother wavelet given in (4)
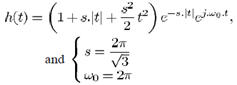 | (4) |
2.3. ANN-based Techniques for Estimating Faults
- Fault location estimation has a desirable feature in power supplies and protection schemes. In most cases, the error in estimating the fault location using these techniques generally varies from 1% to 6%. Prony method is used to fit a time signal, represented by a series of equally spaced samples, into a linear model. The Prony model is the summation of damped sinusoidal components. Each component has its own frequency, amplitude, damping, and phase shift as described by the formula (5)
 | (5) |
 Angular frequency of ith frequency componentФi: Phase shift of ith frequency component.The Prony problem is formulated by knowing the value of the signal in the form of a series of time samples. The problem is solved to estimate the value of the parameters of Prony model such that the squared errors of the fitting are minimized. The increased complexity in regulated power supplies and modern power systems, especially post restructuring, has imposed challenges on system operators either at the utility level or the independent system operator’s level. The economical and environmental aspects forced the system operation to utilize tight margins. Wide area stability and protection has become a major concern. A scheme was presented to locate faults on transmission lines using the wavelet transform. The wavelet was used to estimate the time taken by the wave to travel between the fault and the local end. Using the traveling time and propagation speed, the fault location was estimated. Another tool that has been used in signal processing applications and the protection field was Prony method. Prony can consider a powerful tool to analyze a signal and extract its modal information. This method can also be used to analyze time independent signals and damped signals. The fact that Prony can handle damped signals and estimate the damping coefficient makes it suitable for applications based on power system transients. Prony calculates the modal information such as frequency, amplitude, damping, and phase shift. These can be used to reconstruct the original signal or to make inferences about system conditions.The author[4] extends the use of Prony to the application of fault location. The fact that Prony can be used for system stability and protection applications makes it a good candidate for the modern concept of wide area protection and emergency control. These methods are equally applicable to various power supplies.
2.4. Wavelet Transform Technique
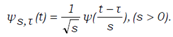
- A power quality problem can be described as any variation in the power supplies. To analyse these electric power system disturbances, data often available as a form of a sampled time function that represented by a time series of amplitudes. When dealing with such data, the Discrete Fourier Transform (DFT) based approach was most often used. The implementation of the DFT by various algorithms has been constructed as the basis of modern spectral and harmonic analysis. The DFT yields frequency coefficients of a signal, which represents the projection of orthogonal sine and cosine basic functions.The wavelet analysis procedure adopts a wavelet prototype function, the analysing wavelet or the mother wavelet. Temporal analysis is performed by shifting a contracted, high-frequency versions of the mother wavelet, while frequency analysis is performed with dilated, low- frequency versions of the same wavelet. Any signal can be represented in terms of a wavelet expansion or series (similar to Fourier series) using coefficients in a linear combination of the wavelet functions at different scales. The selection of the mother wavelet is not a trivial issue. Different mother wavelets exist with various characteristics. Success of a given wavelet basis in a particular application does not mean that this set is efficient for other applications[6].Let ψ (t) represents the mother wavelet as a function of time, and then the daughter wavelets are generated from the mother wavelet by means of scaling and translation as shown in eq. (6):
 | (6) |
3. Measurement & Detection Techniques
- There are several no. of power quality problems in the power supplies. To analyse these problems, several measurement & detection techniques can be used. This section of the paper deals with some of the techniques as state below.
3.1. Classification of Power Quality Disturbances and Neural Networks
- The creation of highly sensitive computerized equipment places increasingly more stringent demands on the quality of electric power supplied to the customer. Not only must the power be supplied without interruption, but also the voltage and current waveforms must maintain nearly sinusoidal shape, constant frequency, and amplitude at all times to ensure continuous equipment operation. Low power quality can cause serious problems for the affected loads, such as short lifetime, malfunctions, instabilities, interruption, and etc. The key reason for our increasingly keen interests in power quality lies in the great economic value directly associated with those disturbances[5]. Poor power quality, normally characterized by the presence of disturbances such as harmonics distortion, capacitor switching, high impedance faults, transformer inrush currents, lightning pulses, and motor starting transients. In order to improve the quality of service, electrical utilities must provide real-time monitoring systems that are able to identify the signatures of different events and make proper decisions for switching and maintenance. Existing methods for detection and classification of power system disturbances are laborious since they are primary based on visual inspection of waveforms[17]. Recent advances in signal processing and pattern recognition have led to the development of several new classification approaches, which are based on discrete wavelet transform, multi resolution signal decomposition, polynomial approximation, and bi-spectra analysis[17].
3.2. Advanced Spectrum Estimation Methods
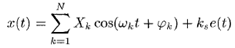
- Modern frequency power converters generate a wide spectrum of harmonic components, which deteriorate the quality of the delivered energy, increase the energy losses, as well as decrease the reliability of a power system. In some cases, large converter systems generate not only characteristic harmonics typical for the ideal converter operation, but also considerable amount of non-characteristic harmonics and inter-harmonics which may strongly deteriorate the quality of the power supply voltage. Inter-harmonics are defined as non-integer harmonics of the main fundamental under consideration[3]. The estimation of the components was very important for control and protection tasks. The design of harmonics filters relies on the measurement of distortions in both current and voltage waveforms using equation (7).Let us assume the waveform of the voltage or current as the sum of harmonics of unknown
 | (7) |
 and φk are the unknown amplitude, angular frequency and phase of the kth harmonic and N is the number of these harmonics. The variable e(t) represents the additive Gaussian noise with unity variance and k, is the gain factor.Inter-harmonics are considered more damaging than characteristic harmonics components of the distorted signals. Their emission was specified lower than those are for the harmonics. There are many different approaches for measuring harmonics, including fast Fourier transform (FFT), application of adaptive filters, artificial neural networks, singular value decomposition (SVD), higher order spectra, etc.[15,16]. Most of them operate adequately only in the narrow range of frequencies and at moderate noise levels. The linear methods of system spectrum estimation (Blackman–Tukey), based on the Fourier transform, suffer from the major problem of resolution. Because of some invalid assumptions (zero data or repetitive data outside the duration of observation) made in these methods, the estimated spectrum can be a smeared version of the true spectrum. These methods usually assume that only harmonics are present and the periodicity intervals are fixed, while periodicity intervals in the presence of inter-harmonics are variable and very long. It was very important to develop better tools of inter-harmonic estimation to avoid possible damages due to its influence.
4. Modeling and Simulation Results
- Due to the rapid changes in power industry, the need to develop new power systems arises. Schematic simulation tools are usually used for power electronic converters simulation. However these simulation models of converters have been developed[18]. The transient simulation of power electronic circuits is of considerable interest to the designer. The switching nature of the devices used permits development of specialized algorithms which allow a considerable reduction in simulation time compared to general purpose simulation algorithms[19]. The development of such systems needs powerful simulators specific for each level of abstraction[20]. The control algorithm is often described at a functional level using hardware description language, as VHDL or Verilog. Application specific integrated circuits (ASICs) or FPGAs standard-cells can be generated by VHDL code, using sophisticated simulation, synthesis and verification tools. Simulink behavior models of DC - DC switching converter circuits used pulse-width modulation (PWM) control ICs[21]. The principle developed is used to model a switched mode power supplies (SMPS) using buck converter[22,23]. The tasks, models and mixed-signal simulation tools are support design of digitally controlled SMPS where the digital controller is implemented in a dedicated FPGA or ASIC. Mixed-signal simulation models of a digitally controlled switching converter based on matlab/simulink and HDL/Spice simulation tools[24].The converters typically involves converting 120 or 240 volt AC supplied by a utility company to a well-regulated lower voltage DC for electronic devices. Low voltage, low power DC power supply units are commonly integrated with the devices they supply, such as computers and household electronics. For this conversion some power electronics converters are used such as switched-mode power supply, linear regulator, rectifier and inverters etc. Here some models and results of the power electronics converters are discussed to improve the power quality of the power supplies.
4.1. Single-Phase PWM Inverter
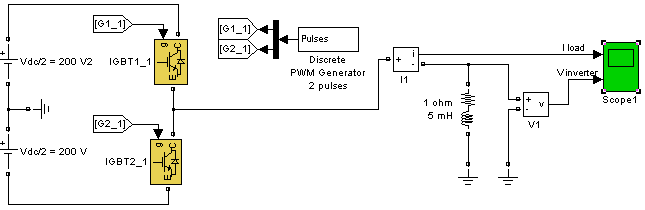 | Figure 1. MATLAB module for half-bridge inverter |
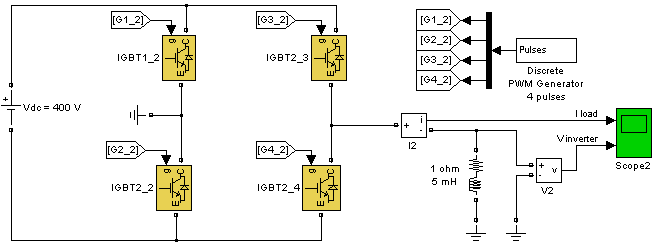 | Figure 2. MATLAB module for full-bridge inverter |
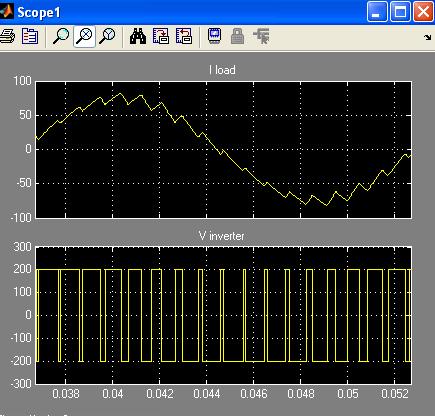 | Figure 3. waveform in half-bridge inverter |
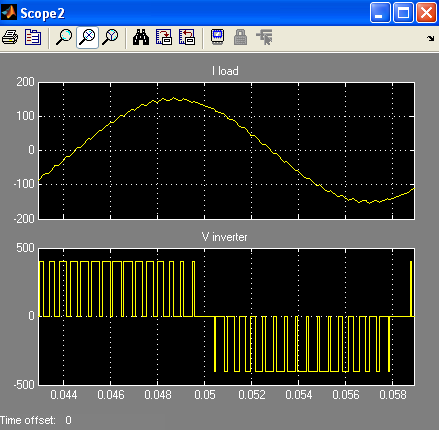 | Figure 4. waveform in full-bridge inverter |
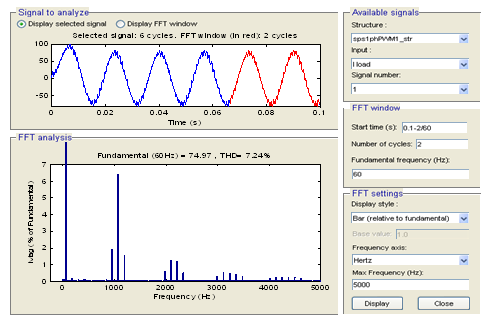 | Figure 5. FFT analysis for half-bridge inverter |
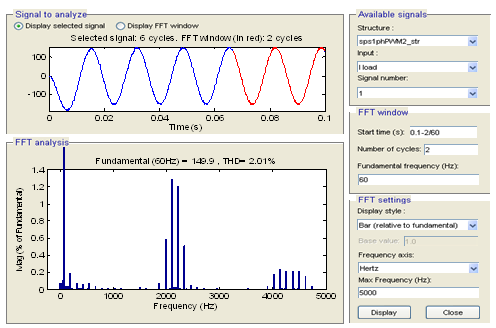 | Figure 6. FFT analysis for full-bridge inverter |
 | (8) |
 , - angular velocity,
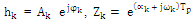
  - initial phase.The discrete-time function may be concisely expressed in the form
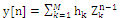 | (9) |
 .FFT analysis on the signal "I load" gives the THD of load current is 7.24% for the half-bridge inverter as compared to only 2.01% for the full-bridge inverter as shown in fig. 5 and 6.There are several industrial applications which may allow a harmonic content of 5% of its fundamental component of input voltage when inverters are used. Actually, the inverter output voltage may have harmonic content much higher than 5% of its fundamental component. In order to bring this harmonic content much reasonable limit of 5% and the frequency harmonics method can be reduced by a low-size filter. For the attenuation of low-frequency harmonics, however, the size of filter components increases. This makes the filter circuit costly, bulky and weightily and in addition, the transient response of the system becomes sluggish. This shows that the lower order harmonics from the inverter output voltage should be reduced by some means other than the filter. Subsequent to this, high frequency component from this voltage can easily be attenuated by a low-size, low-cost filter.
4.2. MATLAB Module for PWM Generator
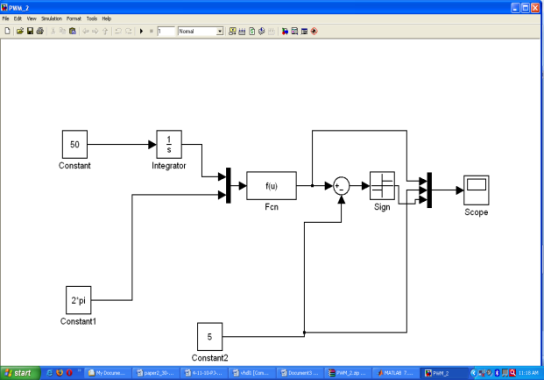 | Figure 7. MATLAB module for PWM generator |
 | Figure 8. MATLAB module |
4.3. FPGA Based System
- The basic VHDL module is an introduction to the VHSIC hardware description language and its fundamental concepts. VHDL is a language specifically developed to describe digital electronic hardware and its attributes. VHDL is a flexible language and can be applied to many different design situations. This language has several key advantages, including technology independence and a standard language for communication. The module describes many of the advantages of using VHDL and a short history of the language. This section of the paper deals with VHDL codes and FPGA module for PWM generator.ARCHITECTURE Behavioral of PWM_tech issignal PWM_Count: STD_LOGIC_VECTOR (N-1 downto 0) := (others=>'0');signal Sigma: STD_LOGIC_VECTOR ( N downto 0) := (others=>'0');signal Delta: STD_LOGIC_VECTOR ( N downto 0) := (others=>'0');signal Scaled_clk: STD_LOGIC;beginprocess( Clk, Scale)variable Scalex: integer;constant Scale100msek: integer := 1; --5000;constant Scale500msek: integer := 0; --25000;variable Count: integer range 0 to 50000001 := 0;begin if Scale='1' thenScalex := Scale100msek; else Scalex := Scale500msek;end if; if rising_edge(Clk)thenif Count>=Scalex thenScaled_clk <= '1';Count := 0;elseScaled_clk <= '0';Count := Count+1;end if;end if;end process;PWM_Generator: process( Clk, PWM_Count, PCM)beginif rising_edge(Clk) thenif Scaled_Clk='1' thenif PWM_Count
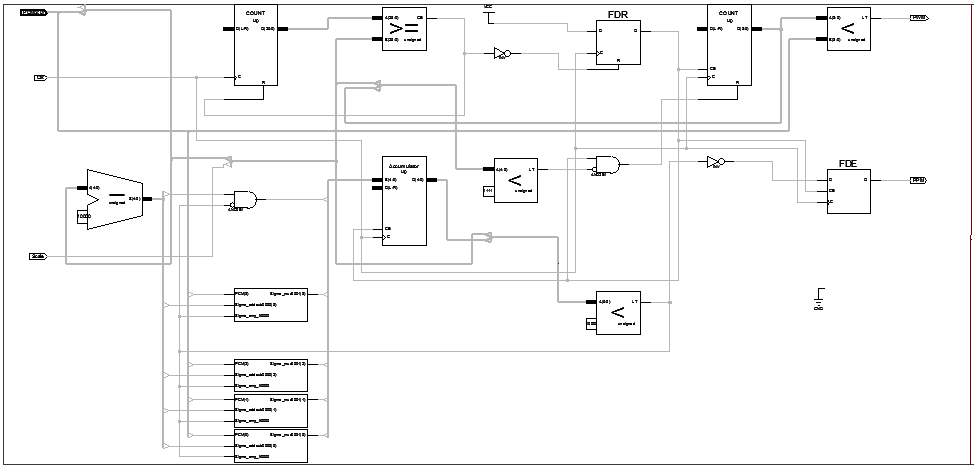 | Figure 9. FPGA Module for PWM generator |
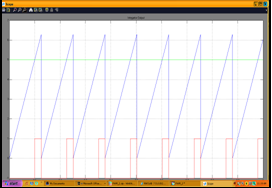
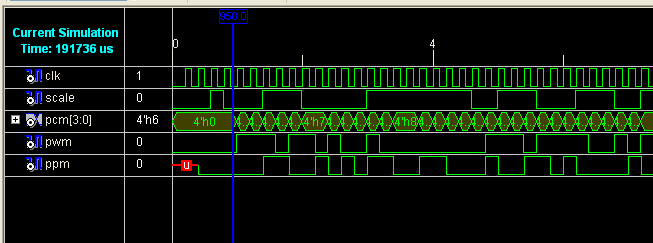 | Figure 10. Simulation result for PWM generator |
5. Conclusions
- A comprehensive of signal processing techniques for power quality improvement has been discussed in this paper. These techniques may be considered as better alternatives to power quality improvement, because of reduced size of the overall power supplies, higher efficiency, and lower cost and enhanced reliability. As being used to supply sensitive loads, such as computers, communication equipment and industry control process, medical instruments, measurement and evaluation is also done. Also modeling technique has been developed for conventional power supplies using simulink. Models were derived for the compensation network and other parts of controller. Long-duration simulations can be carried out to obtain the transient response of the system. Also FPGA module for PWM generator is presented with its advantages. Thus simulink requires less CPU run time and memory space. VHDL programming is also used to model PWM generator. This modeling technique could easily be extended to other power electronics applications.