-
Paper Information
- Next Paper
- Paper Submission
-
Journal Information
- About This Journal
- Editorial Board
- Current Issue
- Archive
- Author Guidelines
- Contact Us
Electrical and Electronic Engineering
p-ISSN: 2162-9455 e-ISSN: 2162-8459
2012; 2(4): 170-176
doi: 10.5923/j.eee.20120204.01
Comparative Study on Conductivity Using Polarization and Depolarization Current (PDC) Test
N. A. M. Jamail 1, 2, M. A. M. Piah 2, N. A. Muhamad 2
1Faculty of Electrical Engineering University of Tun Hussein Onn Malaysia (UTHM), Malaysia
2Faculty of Electrical Engineering, Universiti Teknologi Malaysia (UTM), Malaysia
Correspondence to: N. A. M. Jamail , Faculty of Electrical Engineering University of Tun Hussein Onn Malaysia (UTHM), Malaysia.
| Email: |  |
Copyright © 2012 Scientific & Academic Publishing. All Rights Reserved.
Polarization and Depolarization Current (PDC) testing is a non-destructive dielectric testing method to determine the conductivity of insulations. It is one of the dielectric diagnostic techniques based on time domain measurement. PDC measurement technique has gained immense popularity due to its ability to assess the condition of HV insulation. PDC measurement can provide information about the conductivity within the initial periods (seconds) after a DC step voltage application. This paper present the review and comparison results from several published papers on application of PDC method in finding the conductivity of the various types of insulators. The scope of the review covered solid and liquid insulations types. In this paper, for solid insulation the studied was focused on cables insulations, electric machine stator insulation and paper insulator in power transformer insulation. For liquid insulation, the review and comparison was done on the biodegradable and mineral transformer oils. MATLAB software was used to simulate the conductivity level of the several types of HV insulation material. The conductivity level of insulation was found dependent on difference between the polarization and depolarization current values of the insulation material. The review results show that the PDC technique successfully give indication on level of conductivity of the HV insulation materials.
Keywords: Polarization and Depolarization Current, Conductivity, HV Insulations Material
Article Outline
1. Introduction
- Recently more attention has been directed to assessment of condition of electrical apparatus such as transformer, cable and rotating machine as they are the important units in power system. Indeed, these equipments insulation system should be monitored frequently to prolong their life time and can help to reduce the maintenance cost. Several new techniques for monitoring HV equipment through it insulation have been developed in recent years.Out of these techniques, Polarization and Depolarization Current (PDC) measurement with the time domain polarization based technique are widely accepted by many utilities due to the advancement in hardware and software interpretation schemes[1]. Also this technique is very useful to estimate conductivity and moisture contents of the insulations. Conduction of a dielectric is often determined by the presence of impurities or contaminants and moisture content inside the insulator. It also can be determined by the ageing process of the insulations PDC measurement will use DC source up to 2000 Vdc as the input source and this measurement can be classified as DC testing. DC testing is
- probably the most commonly used maintenance and diagnostic tests periodically conducted on machine stator insulation systems with the commercial availability of more sophisticated equipment to continuously monitor both charge and discharge current during a step voltage test, also known as polarization/depolarization current (PDC) test[2, 3]. PDC test had been applied to many electrical apparatus to monitor the condition such as machine stator, transformer and power cables.Researcher[4] has applied the Polarization /Depolarization Current (PDC) analyzer for the insulation assessment of power cables since 2002. He found that the most advantage of this technique is its easy identification between “conduction” and “polarization” phenomena in a dielectric. Its ability in measuring current as low as 10 -12 A (pA) allows the high voltage insulation to be tested non-stressfully at low voltage and remaining charges stored in any cable insulation continuously without any voltage application. Researches[5-7] had applied PDC technique for XLPE insulation that subjected to wet ageing. They had used apparent conductivity which is based on difference between polarization and depolarization currents and degree of nonlinearity factor which is the ratio of apparent conductivity at different voltage as the parameter to determine the condition of the cables.Research also have been conducted by[8] on PDC analysis for power transformer not only on insulation between windings but as well as for insulation systems of winding-to-ground which can sometimes reveal trouble in transformer accessories such as on-load tap changer (OLTC)This researcher was focused on water and contaminant in a new OLTC, moisture and surface humidity and free water in a refurbished transformer. This technique also has already been applied as a quality assurance tool for the assessment of refurbishment efficiency of power transformers by researcher[9]and moisture assessment of transformer bushings by researchers[10]. Estimation of water content and conductivity in power transformer focused on paper insulation also had been done using PDC measurement by researcher[11, 12]. Moisture and ageing strongly influence the dielectric properties of oil insulation system of power transformer. PDC analysis is normally used to determine the water content in the oil-paper insulation barrier and the conductivity.Researches[13-15] had been done to investigate the moisture content and conductivity of the oil insulation focused on transformer oil. There was research had been carried out to find the dielectric responsive function and maximum conductivities of biodegradable and mineral transformer oils for comparative analysis by researcher[16]. Each of oil insulation with different moisture levels (dried, normal, or wet) was tested.A lot of research had been done on application of PDC technique in assessing the conductivity of the insulation of the electrical equipment. This study did reviewed and done comparative analysis on defined the conductivity of several types of HV insulation using PDC technique.
2. PDC Concept and Theory
2.1. Insulation Conductivity Concept
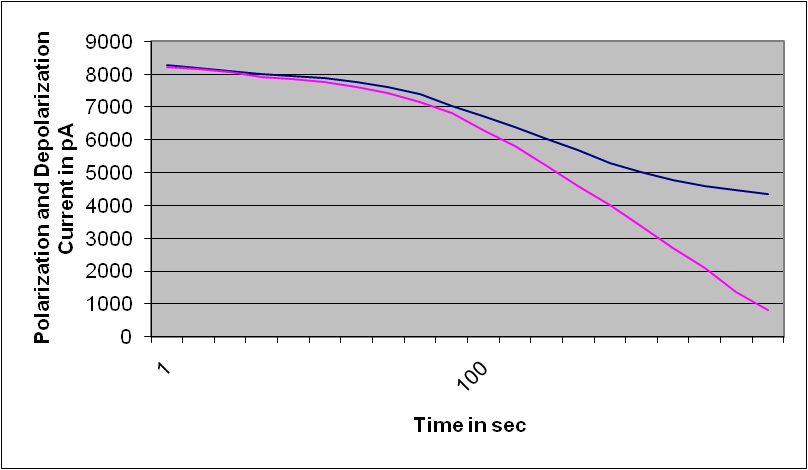
- Examine the PDC curves, parameter such as conductivity and moisture content in the insulation can be estimated. Figure 1 shows example of PDC curve in dB plot. The figure shows the oil conductivity, oil properties, geometry, ageing and water content influence on the PDC-Curves[17]. Based on the figure the conductivity of the insulation can be measured from the front tail of the PDC curve. Value of conductivity affects the polarization current mainly in a time range t<100s. Higher conductivity leads to a higher current value.
 | Figure 1. Oil conductivity, oil properties, geometry, ageing and water content influence on the PDC-Curves[17] |
 | (1) |
 | (2) |
 | (3) |
 , equation (2) and equation (3) can be combined to express the dc conductivity of the composite dielectric as[1, 14, 16, 18, 19]:
 | (4) |
 | Figure 2. Characteristic of Polarization and Depolarization Currents[14, 15, 18, 20] |
3. PDC Measurement Technique
3.1. Basic Principle[14, 15, 18, 20]
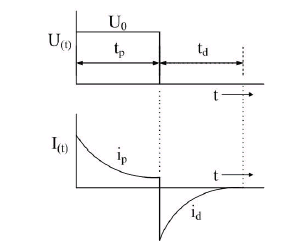
- When a totally discharged insulation is exposed to a fixed DC voltage, a resultant current will be produced from activation of the polarisation species with different time constants and due to the conductivity of the insulation. This resultant current is known as charging or polarisation current. When all polarized species are oriented themselves in the direction of the field, the current achieved a steady state and is primarily due to DC conduction. If the voltage is now taken off, the polarized species tend to relax resulting in depolarisation current. The PDC phenomena have been shown schematically in Figure 2[14, 15, 18, 20].
3.2. PDC Measurement for Solid Insulation
- The polarization currents measurement is performed by applying a dc voltage step on the dielectric materials and depolarization current is measured by removing the dc voltage source incorporating with a switch which turn on to short circuit at the under tested objects. The dc voltage applied was 1000V for about 10,000 seconds for polarization and depolarization time.Figure 3 shows example of the PDC measurement setup that have been developed and used by researcher at University of Queensland, Australia. This system comprises of an Electrometer (Keithley 6571A), four high voltage relays, a power control interface for relay controlling and a laptop computer with GPIB Card. The control software was developed in the LabVIEW environment which enables the operator to record voltage and currents automatically during PDC measurements.
 | Figure 3. Schematic diagram of PDC measurement setup[1] |
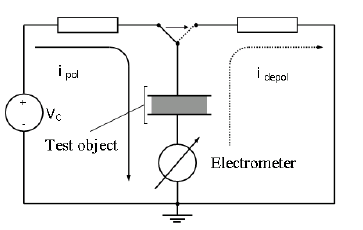 | Figure 4. Principle of test arrangement for PDC measurement with isolated shield[4, 8] |
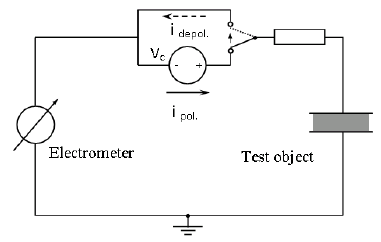 | Figure 5. Principle of test arrangement for PDC measurement with grounded shield[4, 8] |
3.3. PDC Measurement for Liquid Insulation
- PDC measurement on sample transformer insulation oil had been done by researcher[16]. Special test cell was designed for holding and prevent the liquid from moisture ingress from surrounding environment.
4. Measurement Results and Analysis
4.1. Transformer Insulations Results[12, 14, 21]
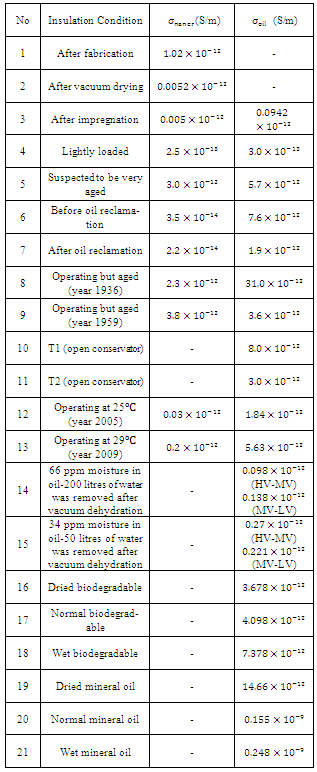
- Result for conductivity level of the transformer insulations materials based on calculation extracted from measured PDC data from paper by researcher[1, 9, 12, 14, 16, 21] using equation (4) is shown in Table 1:Observation from above table show that PDC after drying and impregnation are lower than those measured after machining cause by the decreasing of the conductivity value of paper and oil after the vacuum drying. Vacuum dehydration can cause a good quality of insulations. This is due to the removal of moisture from the insulation. Results No 12 and 13 were operated at 25℃ and 29℃ respectively. It shows that after 4 years operating, the conductivity of solid and oil insulation increased due to both ageing and temperature differences from 25℃ and 29℃. Results No 16 until No 21 refer to PDC test on biodegradable oil and mineral oil. Test results show that mineral oil has higher conductivity compared to biodegradable oil in dried, wet and normal conditions.
|
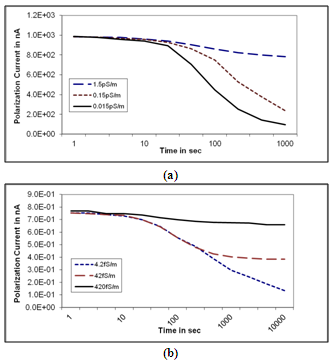 | Figure 6. Variation of polarization currents with paper conductivity (a)  =1.5pS/m; =1.5pS/m;  =0.15 pS/m; =0.15 pS/m;  =0.015pS/m and (b) =0.015pS/m and (b)  =4.2fS/m; =4.2fS/m;  =042fS/m; =042fS/m;  =420fS/m [14, 19] =420fS/m [14, 19] |
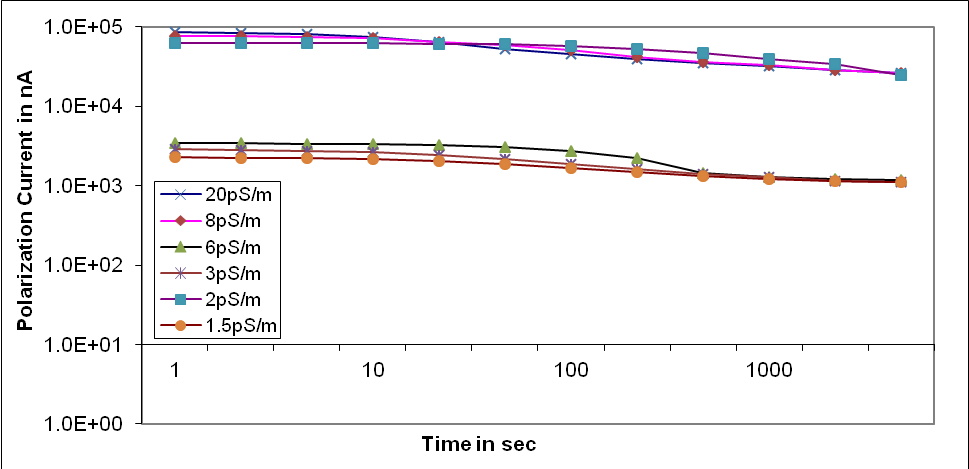 | Figure 7. Variation of polarization currents with different oil conductivity[17,22] |
4.2. Machine Insulation Results
- The analysis for PDC measurement for machine insulation was done based on result in paper published by researchers [6].Figure 8 and Figure 9 show that polarization and depolarization current for polyester-mica coil is higher than epoxy-mica bar in both conditions. Its conductivity increases sharply after moisture absorption which caused a significant change in the dielectric response of the insulation system resulting into the occurrence of an interfacial polarization peak within the time frame of observation.The result was complied and shown in Figure 8 and Figure 9. Higher solid insulation moisture or conductivity tends to increase the magnitude of the polarization and depolarization currents at longer time.
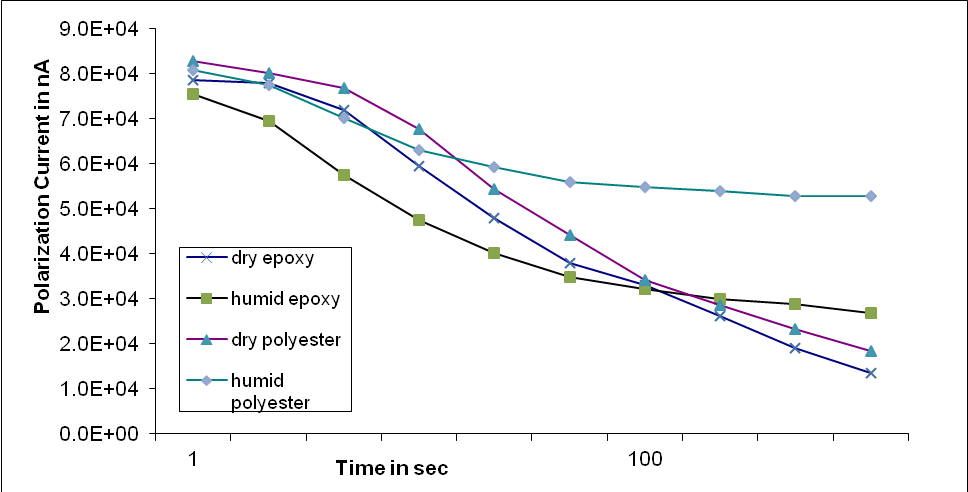 | Figure 8. Charge currents for epoxy-mica bars and a polyester-mica coil before (dry) and after (humid) one week under a humid atmosphere[6] |
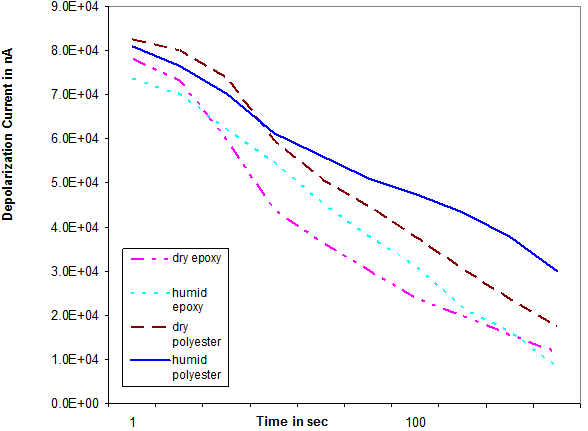 | Figure 9. Discharge currents for epoxy-mica bars and a polyester-mica coil before (dry) and after (humid) one week under a humid atmosphere[6] |
4.3. Cable Insulation Results
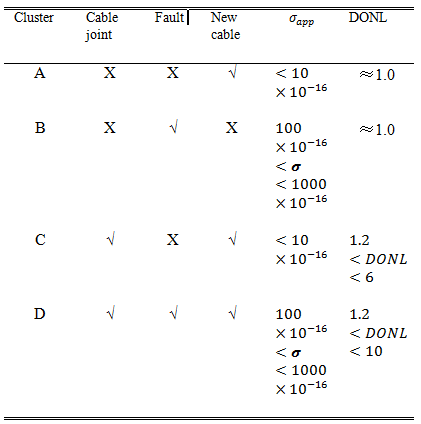
- PDC application on cable insulation was done by researchers[6, 7] . Based on their papers the test was classified into several cable classifications as listed in Table 2. Cluster A contains the newest cables with no joints and some intermediate aged cables. Cables in Cluster B have failed and had been repaired many times but there is widespread degradation of the cable insulation. Cables in Cluster C contain one of the newest cables with poor joints insulation quality. Cables in Group D appear to share characteristics of cables in Groups B and C.
|
 > 10 X 10-16 S/m and degree of nonlinearity DONL > 1.2 but < 2 they could have joint and/or water tree problems. If cables with
  < 10 X 10-16 S/m and DONL >1.2 but < 2, the cables have high water tree density where no tree is bridge the insulation and if cables with
  < 10 X 10-16 S/m and DONL < 1.2, cables are in good condition.As temperature increase, apparent conductivity increases. This is due to insulation degradation with temperature which refer to ageing process.
4.4. Conductivity Variation Results
- Polarization and depolarization current measurement enables estimation to be made for the condition (moisture and ageing) of insulation with different conductivities levels. From Equation (4), it proves that conductivity of the insulation is influenced by polarization and depolarization current values. Figure 10 show result of measured polarization and depolarization current and conductivity variation of transformer before and after oil reclamation. The current plots in each case are divided by corresponding charging voltage and geometric capacitance values. In this case, the values of polarization and depolarization current have been normalized to an equivalent base of geometry and charging voltage for easier comparison.It can be observed, changes in insulation polarization and depolarization current values tend to affect the value of conductivity. Figure 10 shows the similarity of polarization and depolarization current trends. Although the magnitude of both polarization and depolarization current before oil reclamation is much higher compare after oil reclamation, the conductivity variation for both insulations is almost same. This proves that, the variation of conductivity is depends on the difference values between polarization and depolarization current.It also found that, maximum value of conductivity for before oil reclamation is higher than maximum values for after oil reclamation. It indicates that after oil reclamation, the oil condition has improved as a whole[14].Figure 11 show result of measured polarization and depolarization current and conductivity variation of heavily loaded and lightly loaded operating aged transformers (45 MVA and 7 MVA). Higher differences between polarization and depolarization current values tend to increase the magnitude of conductivities. Indeed, maximum conductivity value for this transformer condition is higher then results in Figure 10. This is due to extremely degraded and increasing moisture level in the insulation systems.Transformers with poor insulation condition will have higher values of polarization and depolarization current. In this analysis, we also found that the conductivity of lightly loaded transformer is higher than heavily loaded transformer at the beginning of the testing time and then shifted to become lower than heavily loaded transformer at the end of testing time. The higher conductivity at the end of the testing time indicates that the paper insulation for heavily loaded transformer contains more moisture and had highly degraded compared to lightly loaded transformer
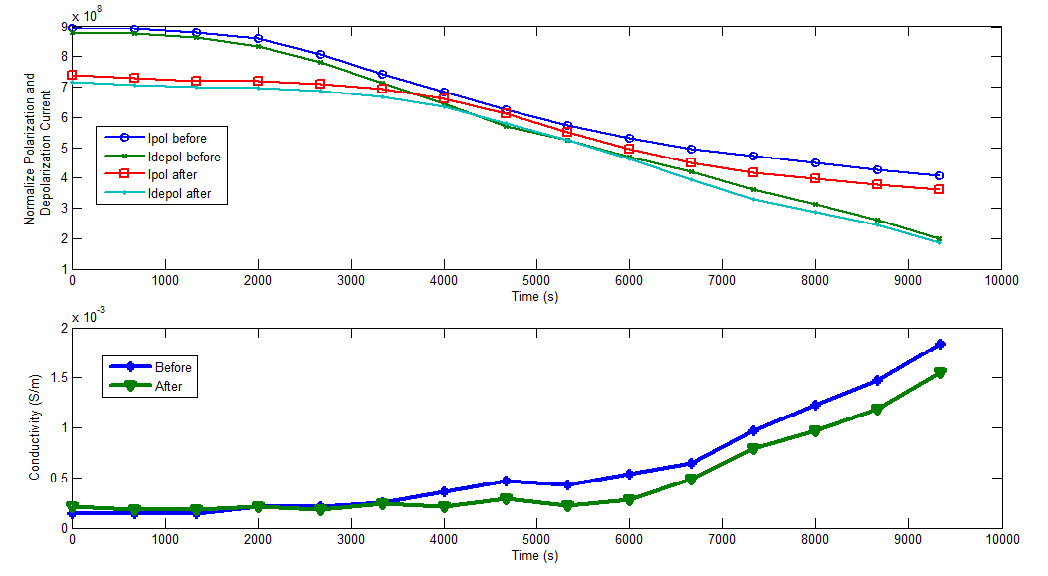 | Figure 10. Conductivity variation of transformer before after oil reclamation[14] |
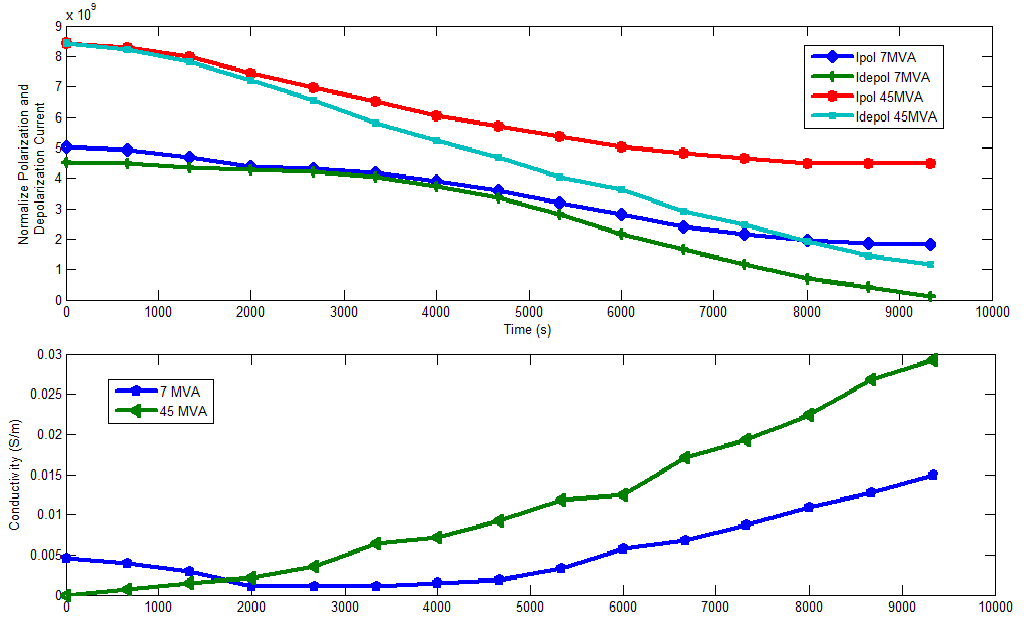 | Figure 11. Conductivity variation of 45 MVA operating aged and 7 MVA lightly loaded operating aged transformer[14] |
5. Conclusions
- PDC measurements can be used to determine the condition of HV insulation. PDC measurements results presented that higher moisture contents, ageing and heavily loaded transformers will gave higher conductivities of both solid and liquid insulations.This paper reviewed and does comparison results of PDC conductivity for transformer, cable and machine. From the comparison results, it concluded that the polarization and depolarization current results can be used to determine the conductivity of solid and liquid insulations. The PDC data are strongly influenced by the insulation conductivity. Higher values of polarization and depolarization currents can contribute to higher conductivity of insulation. The initial value of PDC can be used to determine the liquid conductivity and the long time values of PDC are primarily determined by the solid insulation condition.The trends of the conductivity variation were found to be dependent on the polarization and depolarization currents values. These trends can be used to evaluate the condition of the HV insulation.
ACKNOWLEDGMENTS
- The authors gratefully acknowledge the Malaysia Ministry of Higher Education, University of Technology Malaysia and University of Tun Hussein Onn Malaysia for financial support.
 Abstract
 Reference
 Full-Text PDF
 Full-Text HTML