Waleri Pawlowich Yushchenko
Ministry of education and science of the Russian Federation, Novosibirsk State Technical University, Novosibirsk, 630092, Russia
Correspondence to: Waleri Pawlowich Yushchenko , Ministry of education and science of the Russian Federation, Novosibirsk State Technical University, Novosibirsk, 630092, Russia.
| Email: |  |
Copyright © 2012 Scientific & Academic Publishing. All Rights Reserved.
Abstract
The paper gives a detailed overview of the algorithm of image reconstruction by using trajectory Doppler signal on the circular motion of the locator and the circular aperture synthesis. The monochromatic signal is considered. The offered method of reconstruction is non-projection one. In contrast to projection method it works equally well both in the near-field and far-field regions relative to the object aperture. Results of the model image reconstruction of single-point and three-point objects are represented. The interference on structures of reconstructed image and structures of ring spectra is shown.
Keywords:
Circular Aperture Synthesis of Antenna, Image Reconstruction, Tomography, Interference, Airy Rings, Transfer Function of The Point, Ring Spectrum
1. Introduction
Monochromatic signal is of great interest for tomography from the viewpoint of diagnostics. The resonant response of biological tissues to the influence of monochromatic signal makes it possible to detect pathology in these tissues. Monochromatic tomography was of great interest in 1980s. In support of this fact let us refer to the work of D. L. Mensa, Sh. Halevi, G. Wade[1]. The image reconstruction by using registered ring spectrum is considered in this paper. The spectrum is registered by stationary locator meanwhile the object rotates. The object is irradiated by monochromatic signal. This process can be called the tomography by the method of Fourier transform. The theoretical basis of the method results from the theorem of central section, i. e. J. Radon’s projection tomography. Projection method does not permit the registration of signals in near-field region relative to the object aperture. This article offers non-projection method of image reconstruction by using circular aperture synthesis of antenna. The method shows good results both in the near-field and far-field regions. The purpose of this paper is to show properties and possibilities of an offered not projective object image reconstruction method[9]. Probably, in the long term it will be possible to eliminate Airy rings on points transfer function and interference not refusing a monochromatic signal. It will allow to construct a tomograph with valuable diagnostic properties.
2. Object Image Reconstruction
An The locator radiates continuous monochromatic signal and moves round a circle setting by that a circular path of antenna aperture synthesis. The parameter of the circular line is defined by the radius  . It can be equivalently considered that the locator stands still, with the object rotating about its axis. The point of the object that has the number i reflects the probing signal with the density of reflection
  . Its space position is defined by polar coordinates
  . The locator with isotropic directional patterns of receiving and sending antennas registers samples of the trajectory signal
  in its locations (Figure. 1).
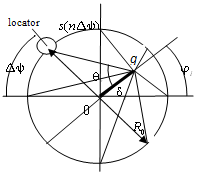 | Figure 1. Geometrical pattern of registering samples of the trajectory signal along the circular line with the uniform step for the single-point object |
Samples of the trajectory signal are registered in equal angular intervals  , where
  is the defined the number of samples along the circle,
  is the angle between the pointing direction from i point to the locator and the line connecting i point with the circle center. Let us proceed to a multipoint model of object consisting of
  points. Scattering power of the object is represented by a sum of signals reflected from all of I points, and the resultant trajectory signal is written as the sum of trajectory signals of separate points:
 | (1) |
The expression under the radical sign stands for the current distance between the i point of the object having the density of reflection  and the locator. Let us designate it as
  for continuous current time
  or as
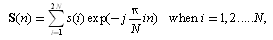
or as  for discrete samples in discrete periods of time.For image reconstruction of all points of the object it is necessary to set auxiliary points of control assigning them uniformly within the circular trajectory. Then reference trajectory signals should be calculated for every point of control, with the locator moving along the circular trajectory.For each point of control having the unit density of reflection the trajectory signal can be calculated for any instant of time using the formula represented below, with
  and
and defining polar coordinates of the control point:
 | (2) |
Cross-correlation function between the control signal (2) and the signal reflected from the object (1) can be written as follows: | (3) |
 Limits of integration are the following:
  varies from 0 to
  ,
,  varies from 0 to
  . Variable value
  is skipped in the expression. In this case time shift is equivalent to the angular difference
  . Therefore it can be considered that
  is the initial value of an angle and
  corresponds to the value of the angle after the time shift.If it is required to save time of calculations when reconstructing the image by means of the trajectory signal then it is also possible to use the set of one-dimensional cross-correlation functions as shown below:
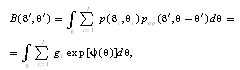 | (4) |
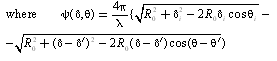
where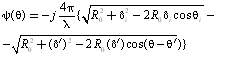 To study the formula (3) let us consider the particular case when the point object located at the origin of coordinates is exposed to tomography. With i being equal 1 and d1 being equal 0, cross-correlation function (3) takes the following form:
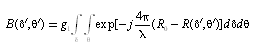 | (5) |
where  . The expression (5) allows obtaining the surface almost the same with the one obtained with the help of Bessel function (6):
 | (6) |
In contrast to expressions (1), (2), (3), (4)  rather than j in the expression (6). Such temporary changes are caused by j being kept by the name of the Bessel function itself. Both the transfer function of the central point obtained using the formula (5) and the top view of this function are presented in Figure. 2, a and b, with m and n being numbers of samples of spectrum coordinates.
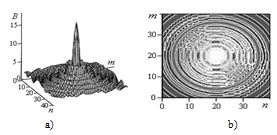 | Figure 2. Reconstruction of the image of the point located at the origin of coordinates and obtained by the method of cross-correlation of the trajectory signal with control signals according to the formula (5): a) the transfer function; b) plan view of the function |
It should be noticed that Bessel function obtained by D. Mensa as the result of Fourier transform of the ring spectrum allows building the surface similar to the one shown in Figure. 3, a. The last-mentioned one is obtained using the expression (4). 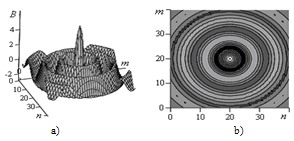 | Figure 3. Reconstruction of the image of the point located at the origin and obtained by the method of cross-correlation of the trajectory signal with control signals according to the formula (4): a) the transfer function; b) plan view of the function |
The following parameters were defined for calculations:  ,
,  m. The figure size is
  . If the count of the resolution starts at the level of 0,7 from the maximum of the main lobe, the ring having the diameter approximately about 1/5 is formed. This agrees with results of Mensa.Below is given the algorithm of discrete processing that results from the formula (4). To use algorithms of fast Fourier transform it is necessary to carry out the discrete processing of experimentally obtained data using the convolution of spectral functions. It is the algorithm of obtaining cross-correlation functions that is offered below. It is considered that the locator having isotropic directional diagram moves around a circular trajectory. The locator irradiates the reflective point displaced by the distance d relative to the center by monochromatic signal and registers the trajectory Doppler signal. Discrete samples of the signal are registered with the angular spacing
  that corresponds to spacing along the circular arc
  .N is the number of samples,
  is the radius of circular trajectory along which the locator moves when synthesizing the antenna aperture. It can be easily shown that in this case the distance from the point exposed to tomography to the locator will be changed in accordance with the formula:
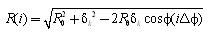 where
where  is radial distance between the point exposed to tomography and the center of aperture synthesis, i is the number of trajectory signal samples along the circular trajectory from 0 to N;
  is the current angle between radiuses
  and
and  when registering current samples. Such limits of angle sweeping correspond to the whole round of the object exposed to tomography.If we shall act as it was done in[1,2], i. e. the signal damping will not be taken into consideration then the trajectory signal s(i) of single point can be calculated using the formula:
 | (7) |
To make the data more reliable it will be more correct to take into account the radial damping which varies inversely as the second power of  :
: | (8) |
where  ,
,  is the wavelength.With the number of points being large, the signal
  reflected from these points can be calculated using the formula (9) in accordance with the principle of superposition:
 | (9) |
where M is the general number of object points exposed to tomography; m is the sequence number of the object point exposed to tomography;  is the trajectory Doppler signal reflected from m point and calculated using formulas (7) and (8).To carry out the spatial discrimination of points it is necessary to scan the received Doppler signal having the form (9). This can be out into practice by means of the reconfigurable dispersion filter that can be configured by turns for different distances within the circular aperture. Let us state that the dispersion filter is a filter with non –linear phase response. The value of signal delay in such filter depends on the frequency of a signal. Dispersion filters are used in radiolocation for compressing signals with linear frequency modulation. Thus, the process of scanning, or, to be more exact, filtering, comes to the determination of cross- correlation function
  . The calculation of this function for applying fast Fourier transforms can be carried out more effectively using the convolution of spectral functions:
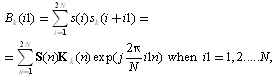 | (10) |
 | (11) |
 when
when 
 when
when  (12)
(12) when
when  The following notations are used in expressions (10), (11), (12):
 are samples of the signal spectrum (1);
  are samples of frequency response of dispersion filter adjusted for the distance
  are samples of control signal that were calculated by formulas (7) or (8) for single point located at the distance of
  from the center of aperture synthesis; n – numbers of frequency samples; i – numbers of signal samples, i1 – numbers of cross-correlation function samples. With the help of the expression (10) 2N samples of cross-correlation function are calculated meanwhile the trajectory signal has only N samples. Therefore missing samples of the trajectory signal are complemented by zeros with respect to 2N. It is also done for the control signal in order to determine the frequency response. This response is expressed by the formula (12). This step is stipulated by the fact that the correlation function requires two times as many samples as the signal.Thus, the aperture synthesis and image obtaining come to two stages: 1) the repeated convolution of the trajectory signal like (9) and control signals like (7) and (8) calculated with the account of different distances from control point to the center
  ; 2) the deconvolution of central, i. e., Nth samples of the cross-correlation function that are recoded in tone or color pixels in Cartesian coordinates. Each central sample of cross-correlation function corresponds to polar coordinates
  and
and  . The following formulas are used to make a transition from Cartesian to polar grid of coordinates:
 | (13) |
 | (14) |
where i=1,2,…,256 is the sample number along the abscissa axis, k= 1,2,…,256 is the sample number along the ordinate axis, Ds is the coordinate step.Using discrete samples in the procedure of transition from Cartesian to polar coordinates causes some error in the reconstructed image. The problem of reducing the error is partly solved by the interpolation of function samples based on values of the function in finite number of points where it is defined. There are many techniques of interpolation allowing to transit from Cartesian to polar grid coordinates and back. These techniques are considered in[3,5].In the present paper the Cartesian coordinate system was chosen for obtaining the image. However, it is impossible to avoid the transition to polar coordinate system because of the circular symmetry of the aperture synthesis. With the uniform locator moving along the circular trajectory and origin point of the aperture synthesis at the circle being defined, we involuntarily carry out a transition to polar coordinate system. In this case any sample of the registered trajectory signal can be tied to polar coordinates grid. In the process of image reconstruction only central samples of cross-correlation functions are used. Polar coordinates of those samples are known as well.In this case the Cartesian grid was defined as origin. Control points having the step  and discrete numbers along coordinates i and j were located in grid points. The control trajectory signal should be calculated for every control point. That signal should be tied to the polar grid in accordance with (13) and (14). Polar coordinates
  and
and  obtained by formulas (7) and (8) allow calculating samples of the control trajectory signal when moving along the circular trajectory (Figure. 4). Here the location of the first sample at the circle (Figure. 4) was defined by polar angle of the control point
  . The angle was calculated using the formula (14) with the help of Cartesian coordinates
  .Let us suppose that the object consists of single reflective point. If coordinates of the object point and coordinates of the control point do not coincide then their samples along the ring do not coincide either (Figure. 4).
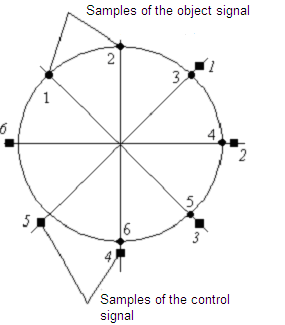 | Figure 4. Distinct samples of control and object trajectory signals (such situation occurs when coordinates of control and object points are distinct) |
When the coincidence of coordinates of the control and object points takes place, all samples along the circular trajectory from the first one to the last one coincide, and the Nth sample of cross-correlation function has the maximal amplitude.The number of control signals generated was 256 x 256. The whole space within the circular aperture is scanned by a set of control signals, and Nth samples of cross-correlation functions recoded in color pixels and swept in coordinate plane form the image of tomography.
3. Discussion of Modeling Results
Let us consider the properties of the method of image reconstruction stated above. As an example let us analyze the point located at the distance of  from the center of aperture synthesis with the radius of the aperture being
  . The trajectory signal obtained by going round the te point with the constant speed is shown in Figure. 5,a. The spectrum of the signal is represented in Figure. 5,b.
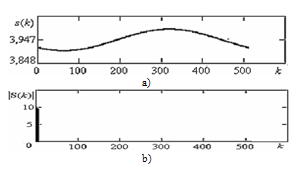 | Figure 5. Results of gathering data from the point object: a) the trajectory signal of the point located at the center of aperture synthesis, i. e. at the origin of coordinates; b) the spectrum of this signal |
The spectrum is localized in the neighborhood of zero frequency. This result is natural since the radial convergence is absent when going round the object. Because of this the Doppler frequency shift is absent as well. The trajectory signal reflected from the point located at the distance of  from the center is shown in Figure. 6. The signal spectrum obtained by moving the locator along the same trajectory at previous speed is represented in Figure. 6 as well.
 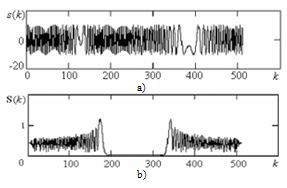 | Figure 6. Results of gathering data for the point: a) the trajectory signal of the point located at the distance of  from the center; b) the spectrum of this signal from the center; b) the spectrum of this signal |
The comparison of Figure. 5 and 6 allows stating the following fact: when the point exposed to tomography is moved away from the center of aperture synthesis the trajectory signal spectrum abruptly broadens. It can be explained by the appearance of radial component of the locator speed relative to the point object.The transfer function of the point located at the center of aperture synthesis is presented in Figure. 7,a. Figure. 8 shows the top view of this transfer function, i. e., its tomogram. The calculation was carried out without considering the radial damping.The transfer function of the point located at the distance of  from the center of aperture synthesis is presented in Figure. 7,b. Its plan view is the same as for the central point. The radius of aperture synthesis
  was
was  . According to the formula of location (8) the radial damping of the signal was not taken into account in this case as well. It was unexpected that the spectrum width of the trajectory signal does not influence on the form of the transfer function of the point. This implies that the circular aperture provides the same resolution within the circular region for all points regardless of their remoteness from the center of aperture synthesis.
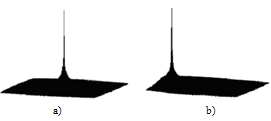 | Figure 7. Results of image reconstruction of the point object: a) the transfer function of the central point; b) the transfer function of the point located at the distance of  from the center of aperture synthesis from the center of aperture synthesis |
One can convince of this fact by comparing the transfer function of the point located at the center of circular aperture synthesis (Figure. 7, a) with that of the point moved away from the center of aperture synthesis (Figure. 7, b).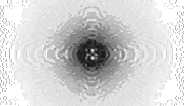 | Figure 8. Results of image reconstruction of the point object in the case of the circular aperture synthesis |
Interference phenomena occur in case of multipoint objects (Figure. 9, a and b). It was unexpected that two different tomography methods (the offered one and the projection method by Mensa) present same transfer functions of the point. It is obvious that the coincidence of spectral functions should be expected as well.Let us recollect the fact that D. Mensa registered spatial spectrum along the ring during the process of tomography. It is necessary to use the two-dimensional Fourier transform of the transfer function of the point in order to turn from the transfer function of the point to the spatial spectrum along the ring. Let us consider the point object located at the origin of coordinates. The trajectory signal of such object is shown in Figure. 5, a. Figure. 7, a shows the transfer function of the point obtained by the method of mutual correlations with control trajectory signals. The spatial spectrum of the transfer function of the point located at the origin is given in Figure. 10, a. Figure. 10, b depicts the plan view of the same spectrum. 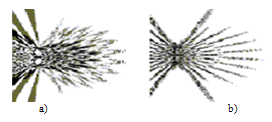 | Figure 9. Tomograms of three-point object located at the distance of 11 from the center of aperture synthesis; the radius of circular aperture synthesis is 25 from the center of aperture synthesis; the radius of circular aperture synthesis is 25  : a) the radial damping was taken into account when carrying out tomography; 512 samples of the trajectory Doppler signal were used in this case; b) the radial damping was not taken into account; 512 samples of the trajectory Doppler signal were used in this case. The overall size of each tomogram is : a) the radial damping was taken into account when carrying out tomography; 512 samples of the trajectory Doppler signal were used in this case; b) the radial damping was not taken into account; 512 samples of the trajectory Doppler signal were used in this case. The overall size of each tomogram is  |
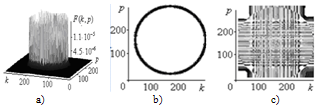 | Figure 10. Spectral parameters: a) the amplitude spectrum of the transfer function of the point located at the origin; b) the plan view of the spectrum; c) the phase-frequency spectrum |
The phase-frequency response of the ring spectrum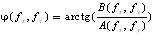 is presented in Figure. 10, c, where
  is the real part of the spectral function
 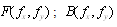 is the imaginary part of the spectral function; k stands for numbers of samples of the spatial frequency; fx p stands for numbers of samples of spatial frequency fy.Let us consider how spectral parameters of transfer function of the point are changed when moving the point object in the spatial region at the distance of
  . Let the radius of aperture synthesis will be the same, i. e.
  . The number of trajectory signal samples is 512.Spectral parameters of the transfer function of the point located at the distance of
  from the center of aperture synthesis are presented in Figure. 11.
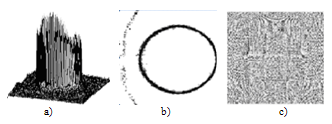 | Figure 11. Spectral parameters: a) the amplitude spectrum of the transfer function of the point located at the origin; b) the plan view of the spectrum; c) the phase-frequency spectrum |
The amplitude spectrum was not changed as seen in the Figure. 11, a and b. Nevertheless, the phase spectrum (Figure. 11, c) changed considerably. It was to be expected according to the spectral theorem of the shift[4]. Figure. 12, a shows the three-point object reconstructed by the trajectory signal. Points are moved away at the distance of  from the center of aperture synthesis. The distance between points is
  . As it follows from Figure. 12, c the spectral function at the ring is dissected. This dissection is the result of the interference of three spectra from each point
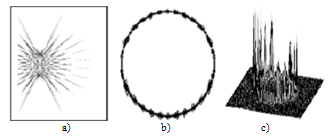 | Figure 12. Reconstructed three-point object: a) the image; b) the plan view of the ring spectrum; c) the ring spectrum of the tree-point object |
4. Conclusions
Following characteristics of offered not projective object image reconstruction method are presented: elementary objects transfer functions, its ring spectrums, Airy rings on images and interference on transfer functions and ring spectrums.Circular synthesis provides the same focusing in all areas inside the circular aperture, i. e. the transfer function of the point is the same both at the center of the circle and along its borders.The width of the trajectory signal spectrum rapidly increases as points exposed to tomography move away from the center of aperture synthesis when the aperture is circular. The tomography of large objects requires using a large number of trajectory signal samples.
ACKNOWLEDGEMENTS
Antennas and propagation, Signal processing
References
| [1] | Mensa, d. L. 1983 coherent doppler tomography for microwave imaging [text] / d. L. Mensa, Shalom Halevi, Glen Wade // TIIAR – 1983 – t. 71, №2. – p. 76-84. (Менса, Д. Л. Применение методов когерентной доплеровской томографии для получения изображения на свч [текст] / д. Л. Менса, Ш. Халеви, Г. Уэйд // тииэр. – 1983. – т. 71, № 2. – с. 76–84) |
| [2] | Mensa, D.L., 1991, High resolution radar cross-section imaging, Artech House, Boston (1991) |
| [3] | Helgason, S., 2009, Selected works of Sigurdur Helgson, Gestur Olafsson, Henrik Schlichtkrull, AMS Bookstore, 2009, P. 715 |
| [4] | Gonorovskiy I. S., 2006, Radio engineering circuitryand signals, Drofa, 2006. – 719 p. (Гоноровский И.С. Радиотехнические цепи и сигналы, Дрофа , 2006 г. – 719 с.) |
| [5] | Herman, G. T., 2009, Fundamentals of computerized tomography: Image reconstruction from projection, 2nd edition, Springer, 2009 |
| [6] | Allen J. Bric, 1997, Imaging a BQM-74E Target Drone Using Coherent Radar Cross Section Measurements / Target drone imaging with coherent radar.// Johns Hopkins apl technical digest, volume 18, number 3 (1997) |
| [7] | Antoni Broquetas, 1998, Josep Palau, Luis Jofre and Angel Cardama, / Spherical Wave Near-Field Imaging and Radar Cross-Section Measurement. // IEEE Transactions on antennas and propagation, vol. 46, no. 5, may 1998 |
| [8] | Robert Lee Morrison, Jr., Ph. 2007 D multichannel methods for restoration in computed imaging. /Department of Electrical and Computer Engineering University of Illinois at Urbana-Champaign, 2007 Minh N. Do, Adviser |
| [9] | Пат. 2066060 Российская Федерация, МПК6 G01S 13/90. Способ картографирования с помощью синтезированной апертуры [Текст] / Ющенко В. П ; заявитель и патентообладатель Ющенко Валерий Павлович. – № 93008773/09 ; заявл. 16.02.1993; опубл. 27.08.1996, Бюл. № 24 – 10 с |
 Abstract
 Reference
 Full-Text PDF
 Full-Text HTML