Ya-Chin Chang
Department of Electrical Engineering, Cheng Shiu University, No. 840, Chengcing Rd., Niaosong Dist., Kaohsiung City, Taiwan
Correspondence to: Ya-Chin Chang, Department of Electrical Engineering, Cheng Shiu University, No. 840, Chengcing Rd., Niaosong Dist., Kaohsiung City, Taiwan.
| Email: |  |
Copyright © 2012 Scientific & Academic Publishing. All Rights Reserved.
Abstract
In order for transmission systems to accommodate more power transfer with less network expansion by building new transmission lines, it can be a good measure to operate under optimal generation direction (GD) under existing networks. In this paper, the problem considering static voltage stability to determine the optimal GD is solved by a PSO algorithm, in which the continuation power flow (CPF) process is used to calculate the loading margin (LM) for each particle. Three objective functions are suggested for different purposes, including maximum loading margin (LM), minimum generation cost, and minimum generation cost and maximum LM as well. In the tests, to validate the effectiveness of the proposed method, the results derived with the respective objectives and from the cost participating factor (Cost PF) approach are made comparison. And, under each GD, with an SVC installation on the specified critical bus, how much the LM that can be increased is also investigated.
Keywords:
Continuation Power Flow, Loading Margin, Particle Swarm Optimization, Static Voltage Stability, Tangent Vector Technique
Cite this paper: Ya-Chin Chang, Optimal Generation Direction Method with SVC Installation for Loading Margin Improvement, Electrical and Electronic Engineering, Vol. 2 No. 1, 2012, pp. 1-5. doi: 10.5923/j.eee.20120201.01.
1. Introduction
The voltage instability problem is recently among the widest attentive problems that many power utilities were recently attracted to[1]. Owing to the difficulties in building new generators and transmission facilities to accommodate the regional load increase, over-utilization of the existing facilities or any contingency would result in voltage instability more easily. Eventually, the present power systems are operated gradually closer to various stability limits and become vulnerable to voltage instability[2].Among the main factors for voltage instability, power system configuration, generation and load patterns could be the most vital ones. The power systems can be properly modified to release voltage instability and thus increase the loading margin by flexible transmission systems (FACTS) at the weakest buses and/or transmission lines[3-4]; however, a poorly scheduled generation or load pattern can reduce a system’s ability to transfer power while maintaining system stable. Furthermore, in an open transmission access environment, poorly scheduled generation and/or load patterns will be brought about to the systems more frequently due to the increasingly competitive biddings. The generation pattern, however, has more flexibility to control by system operators than the load pattern for the relatively uncontrol-lable nature[5].To maximize the ability of supplying power to the loads before reaching a system limit, as can be a voltage collapse point, a low voltage or a thermal limit, etc, a good GD (or generation pattern) should be maintained. In general approaches, the generation of each participating generator is raised at a predefined rate, or proportional to their spinning reserves.To avoid the system limits, several works had been done to the load pattern[5-6]; however, the generation direction cannot be determined by simply changing the objective function. The method proposed in[5] relating the LM to only one generation parameter, hence it is not suitable for seeking the best GD. A maximum LM search method developed in[7] is based on a normal vector to indicate the hypersurface of the boundary intersects with a hyperplane tangent to the hypersurface at the point of maximum generations. It is used to solve for the maximum LM without the intermediate load- ing points and economic concerns. In[8], using the generation participation factors derived from a modal analysis, the impacts of generators around the critical point were inspected. Because the analysis can only be manipulated near the critical point, it cannot be used to anticipate or estimate the maximum LM prior to voltage instability.While in[9], with technical concerns, a polynomial function is used to approximate the respective maximum LM for the individual participating generators and the maximum LM for all participating generators is then estimated by a linear combination of the respective maximum LM. On the other hand, it would be beneficial for the competitive markets to find a permissible GD to maximize the LM for economical concerns. Accordingly, in[10], an economical GD method is developed to search the best GD for the maximum LM while minimizing the generation cost. A two steps optimization procedure is employed to do with the convergence problem when achieving a critical bifurcation point.The problem to determine the optimal GD for a maximum LM of the network considering static voltage stability is proposed in the paper. The PSO algorithm involving in the CPF process[11] is used to solve the problem. Three objective functions for possibly different purposes are suggested. With the loading factor taken as the first objective, the maximum LM can be determined. The second objective is specified as the generation cost function, and thus a maximum LM associated with the minimum generation cost can be derived. Combined with the two objectives above, the third objective can be used to maximize the LM and minimize the generation cost as well, and thus a compromise between the maximum LM and minimum generation cost can be determined.The rest parts of the paper are organized as: Section II introduces the problem to determine the maximum LM for a specific objective with optimal GD. The tangent vector technique to determine the critical buses for SVC installation is described in section III. And, in section IV, three objective functions suggested to determine the optimal GD and the PSO-based solution algorithm is also given. A modified IEEE 14-bus system is used for testing in section V, and the test results computed from different objectives are compared with each other and those derived with Cost PF approach. Also, the effects of an SVC installation on a critical bus are inspected. Section IV concludes with a brief discussion.
2. Problem Description
The power system model including the system nonlinear real and reactive power flow balance equations is expressed in a vector form as follows: | (1) |
where the vectors of the state variables  and
and  denote the system bus phase angles and load bus voltage magnitudes. A base-case power flow can be obtained with the system equations. When an uncontrollable loading factor
  associated with a loading margin (LM), that would drive the system from one stable equilibrium point to another, is inserted into the power flow equations, the system equations become:
  | (2) |
The real and reactive power balance equations at bus i can be described as:  | (3) |
 | (4) |
where  and
and  are the real and reactive power flows on line i-j;
  and
and  are the base case injections at bus i; as related to the future load increase, the loading increments
  and
and  are respectively generation real, and load real and reactive powers on bus i,
  being the set of the PQ buses associated with the additional system load. If increases are not allowed,
  and/or
  will be zero. For a specific value of , the
  and maximum
  being the maximum value of
  will be obtained when system state reaches a saddle-node bifurcation point for additional power supply due to increased system load. The maximum LM can also be referred to as the maximum static voltage stability margin (VSM). In the proposed strategy, the generation increments,
  , where
  being the set of the real power supplies from the participating generators for the additional system load, are regulated to seek the maximum LM, formed as a vector as follows:
  | (5) |
where all generation increments must be bounded within the permissible incremental ranges, i.e., | (6) |
In computation, in order not to overestimate each generation increment, the respective searching ranges are given below: | (7) |
where letting .Then, the system equations can be reformulated as:
  | (8) |
If a set of generation increments is determined, the GD for the participating generators can be calculated by:  | (9) |
where  represents the percentage of the total generation increments provided by generator i.On the other hand, simply determined by the cost participating factor (Cost PF) approach[9], the GD through the solution process for each participating generator is maintained as:
  | (10) |
3. Identification of Critical Buses
The tangent vector technique[12] is used to estimate how the state variables are changed along a loading increment path. With a unit change of  , i.e.
  , in (2) and based on the base-case state (
 ) , the tangent vector can be expressed as:
  | (11) |
The tangent vector provides an early identification of the critical buses, thus playing an important role in voltage collapse analysis. The buses with bigger negative voltage magnitude deviations  due to the specific power increments
  are considered to be critical. After the critical buses identified, some of them can be suitable for SVC installation. In the tests, an increase in LM will be made with an SVC installation on the specified critical bus.
4. Optimal GD Method
The generation cost is formulated as follows:  | (12) |
where  is the real power generation of generator i.
  and
and  are the coefficients of the generation cost.
4.1. Problem Formulation
Under a base-case state, the problem to seek an optimal GD for LM improvement is formulated as follows:  | (13) |
s.t. (6)-(8) | (14) |
There are three different objective functions suggested for testing: a).  to maximize the LM. b).
  to minimize the generation cost with an allowable LMc).
  to maximize the LM and minimize the generation cost at the same timeThe PSO algorithm involving in the CPF process is used to solve the problem. The bus voltages and
  are sought through the CPF process along the loading path each iteration.
4.2. Solution Algorithm
The individual particles of population in the PSO algorithm are denoted as a set of generation increments (GD) respectively and will be randomly reproduced in each iteration. Particle  is defined as a vector below:
  | (15) |
where  is the particle number, and the members in particle
  are denoted as ith candidate set of generation increments as shown in (5).The proposed solution algorithm is shown below: 1.Give the base-case and a set of loading increments.2.Set iteration and particle numbers (100 and the tests), and then randomly initialize a set of particles within the limited ranges.3.For each particle, first make a power flow analysis for
  , and then using CPFLOW program calculate the LM, and evaluate the fitness of (13).4.If iteration =1, the fitness value of each particle is set to its own pbest and the members of the particles set to the location associated with the pbest; else, if a particle’s current fitness is better than its own pbest, update the pbest and the location associated with the pbest, and finally, update the gbest and set the global location as the best associated with all particles’ pbest.5.If iteration is fewer than the number set, then update the particles and back to step 3; else, the best GD and the associated LM are recorded.
5. Numerical Results
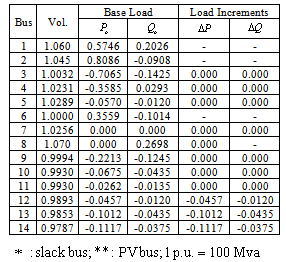
In the tests, the modified IEEE 14-bus system shown in Fig. 1 is used for testing. The base data and the specific loading increments for load buses 12, 13 and 14 are shown in Table 1, while the generation increments (or GD) for generators G1, G2 and G6 are to be determined using the proposed method. For simplicity, the voltage magnitudes of the PV buses (including an AVR on bus 8), shown on the second column of Table 1, are all set to be stationary. 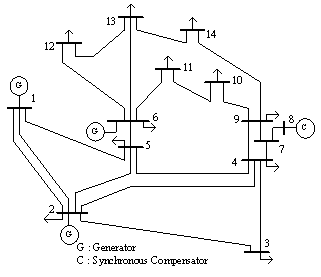 | Figure 1. Modified IEEE 14-bus system |
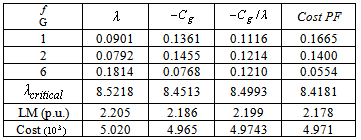
The parameters for the three generators are given in Table 2. The generation increments,  , LM and generation costs derived from the propose method using the three objective functions respectively and Cost PF approach are shown in Table 3. As seen that the maximum LM can be obtained with objective
  while the LM computed from Cost PF approach is the minimum. As performance index (PI), namely
  , applied to evaluate the performance of each LM obtained, the minimum PI value is 585.3 with objective
  used in the proposed method, which is better than 590.5 computed from Cost PF approach, even though the LM obtained from the former is also larger than the latter. Therefore, in the test, the proposed method performs better than Cost PF approach. Using the proposed method with objective
  , the GD determined are 0.38, 0.41 and 0.21 for G1, G2 and G6 respectively, while computed from Cost PF approach, they are 0.46, 0.39 and 0.15 respectively.
Table 1. Base data and specific loading increments
 |
| |
|
Table 2. Generation cost coefficients and limits
 |
| |
|
Table 3. Generation increments,
 , maximum LM and costs for the three objectives and Cost PF approach , maximum LM and costs for the three objectives and Cost PF approach
 |
| |
|
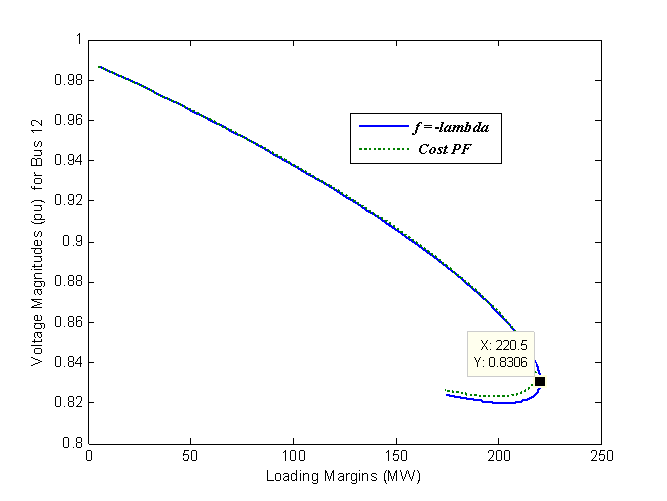 | Figure 2. P-V curves for the GDs found with objective function  and Cost PF approach. and Cost PF approach. |
The P-V curves derived from the proposed method with  and Cost PF approach are depicted in Fig. 2. As can be seen that, both LM obtained with the proposed method and Cost PF approach are almost consistent with the results shown in Table 3.When using objective
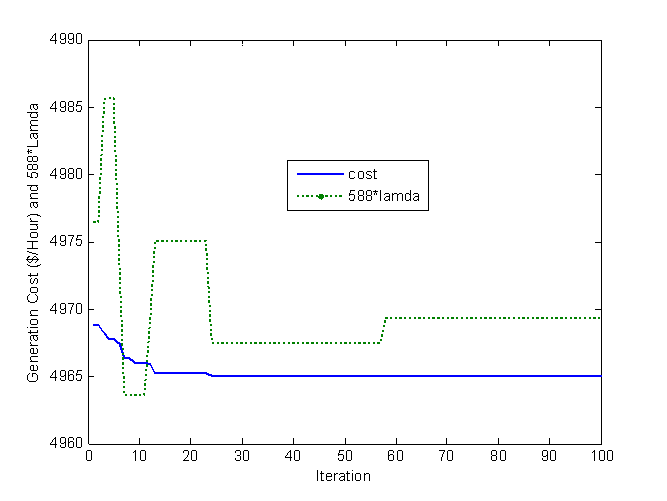
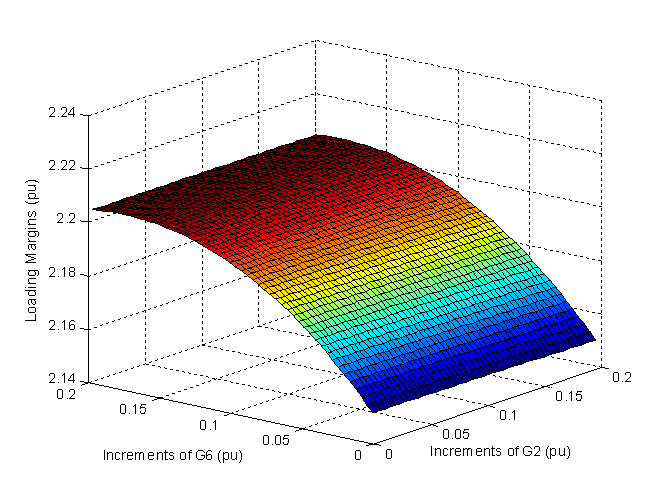
  , the curves for searching the minimum generation cost and the associated LM is depicted in Fig. 3. As seen that the minimum cost is obtained at the 24th iteration.The LMs for various generation increments of G2 versus G6 are expressed as a curve surface in Fig. 4. It can be seen that a larger LM is mainly correspondent with a bigger generation increment for G6. Therefore, to improve LM, it is available to increase the generation of G6.The critical buses obtained from the tangent vector in (11) with
  are shown in Table 4. In order to further improve LM, an SVC with 2 p.u. reactive power is installed at bus 14 and the effects for each GD are shown in Table 5. As found that, although the contribution of the GD, expressed as the PI value, obtained with the Cost PF approach is larger than other GD derived from the proposed method, however, they are very close to each other, among which 513.6 is the smallest with the maximum LM (=3.64 p.u.) obtained from using objective
  in the proposed method.
  | Figure 3. Course for minimum generation cost and corresponding LM with objective  |
 | Figure 4. Maximum loading margins for various generation increments of G2 vs. G6 |
Table 4. Critical buses
 |
| |
|
Table 5. The effects as an SVC installation on bus 14
 |
| |
|
6. Conclusions
In this paper, an optimal GD searching problem is proposed to determine the optimal GD such that the transmission system can be operated on the maximum LM under different objectives. With each particle representing a candidate GD, a PSO algorithm involving in the CPF process is used to solve for the maximum LM. Also, in the test results, with an SVC installation on the critical bus determined from the tangent vector technique, the LM under each GD can be largely improved is validated.
References
| [1] | T. Nagao, K. Tanaka, K. Takenaka, “Development of Static and Simulation Programs for Voltage Stability Studies of Bulk Power System,” IEEE Trans. Power Syst., Vol. 12, No. 1, Feb. 1997, pp. 273-281 |
| [2] | Blackout of 2003: Description and Responses, available: http://www.pserc.wisc.edu/ |
| [3] | A. R. Messina, M. A. Pe`rez, E. Herna`ndez, “Coordinated Application of FACTS Devices to Enhance Steady-State Voltage Stability,” Electrical Power and Energy Systems, Vol. 19, No. 2, 2003, pp. 259-267 |
| [4] | W. Shao, V. Vijay, “LP-Based OPF for Corrective FACTS Control to Relieve Overloads and Voltage Violations,” IEEE Trans. Power Syst., Vol. 21, No. 4, Nov. 2006, pp. 1832-1839 |
| [5] | S. Greene, I. Dobson, F. L. Alvarado, “Sensitivity of The Loading Margin to Voltage Collapse with respect to Arbitrary Parameters,” IEEE Trans. Power Syst., Vol. 12, No. 1, Feb. 1997, pp. 496-501 |
| [6] | I. Dobson, L. Lu, “New Method for Computing A Closest Saddle Node Bifurcation and Worst Case Load Power Margin for Voltage Collapse,” IEEE Trans. Power Syst., Vol. 8, No. 3, Aug. 1993, pp. 905-913 |
| [7] | R. Wang, R. H. Lasseter, “Re-Dispatching Generation to Increase Power System Security Margin and Support Low Voltage Bus,” IEEE Trans. Power Syst., Vol. 25, No. 2, May. 2000, pp. 496-501 |
| [8] | L. C. P. da Silva, Y. Wang, V. F. da Costa and W. Xu, “Assessment of Generator Impact on System Power Transfer Capability Using Modal Participation Factors,” Proc. Inst. Elect. Eng., Gen., Trans., Distr., Vol. 149, No. 5, Sep. 2002, pp 564-570 |
| [9] | A. Sode-Yome, N. Mithulananthan, K. Y. Lee, “A Maximum Loading Margin Method for Static Voltage Stability in Power Systems,” IEEE Trans. Power Syst., Vol. 21, No.2, May. 2006, pp. 799-808 |
| [10] | A. Sode-Yome, N. Mithulananthan, “An Economical Generation Direction for Power System Static Voltage Stability,” Electric Power Systems Research 76 (2006)1075-1083 |
| [11] | H. D. Chiang, et. al., “CPFLOW: A Practical Tool for Tracing Power System Steady-State Stationary Behavior Due to Load and Generation Variations,” IEEE Trans. Power Syst., Vol. 10, No. 2, May 1995, pp. 623-628 |
| [12] | A. A. A. Esmin, G. L. Torres, A. C. Z. Souza, “A Hybrid Particle Swarm Optimization Applied to Loss Power Minimization,” IEEE Trans. Power Syst., Vol. 20, No. 2, May 2005, pp. 859-866 |


 and
and  denote the system bus phase angles and load bus voltage magnitudes. A base-case power flow can be obtained with the system equations. When an uncontrollable loading factor
  associated with a loading margin (LM), that would drive the system from one stable equilibrium point to another, is inserted into the power flow equations, the system equations become:


 and
and  are the real and reactive power flows on line i-j;
  and
and  are the base case injections at bus i; as related to the future load increase, the loading increments
  and
and  are respectively generation real, and load real and reactive powers on bus i,
  being the set of the PQ buses associated with the additional system load. If increases are not allowed,
  and/or
  will be zero. For a specific value of , the
  and maximum
  being the maximum value of
  will be obtained when system state reaches a saddle-node bifurcation point for additional power supply due to increased system load. The maximum LM can also be referred to as the maximum static voltage stability margin (VSM). In the proposed strategy, the generation increments,
  , where
  being the set of the real power supplies from the participating generators for the additional system load, are regulated to seek the maximum LM, formed as a vector as follows:


 .Then, the system equations can be reformulated as:

 represents the percentage of the total generation increments provided by generator i.On the other hand, simply determined by the cost participating factor (Cost PF) approach[9], the GD through the solution process for each participating generator is maintained as:
 , i.e.
  , in (2) and based on the base-case state (
 ) , the tangent vector can be expressed as:
 due to the specific power increments
  are considered to be critical. After the critical buses identified, some of them can be suitable for SVC installation. In the tests, an increase in LM will be made with an SVC installation on the specified critical bus.
 is the real power generation of generator i.
  and
and  are the coefficients of the generation cost.

 to maximize the LM. b).
  to minimize the generation cost with an allowable LMc).
  to maximize the LM and minimize the generation cost at the same timeThe PSO algorithm involving in the CPF process is used to solve the problem. The bus voltages and
  are sought through the CPF process along the loading path each iteration.
  is defined as a vector below:
 is the particle number, and the members in particle
  are denoted as ith candidate set of generation increments as shown in (5).The proposed solution algorithm is shown below: 1.Give the base-case and a set of loading increments.2.Set iteration and particle numbers (100 and the tests), and then randomly initialize a set of particles within the limited ranges.3.For each particle, first make a power flow analysis for
  , and then using CPFLOW program calculate the LM, and evaluate the fitness of (13).4.If iteration =1, the fitness value of each particle is set to its own pbest and the members of the particles set to the location associated with the pbest; else, if a particle’s current fitness is better than its own pbest, update the pbest and the location associated with the pbest, and finally, update the gbest and set the global location as the best associated with all particles’ pbest.5.If iteration is fewer than the number set, then update the particles and back to step 3; else, the best GD and the associated LM are recorded.
 , LM and generation costs derived from the propose method using the three objective functions respectively and Cost PF approach are shown in Table 3. As seen that the maximum LM can be obtained with objective
  while the LM computed from Cost PF approach is the minimum. As performance index (PI), namely
  , applied to evaluate the performance of each LM obtained, the minimum PI value is 585.3 with objective
  used in the proposed method, which is better than 590.5 computed from Cost PF approach, even though the LM obtained from the former is also larger than the latter. Therefore, in the test, the proposed method performs better than Cost PF approach. Using the proposed method with objective
  , the GD determined are 0.38, 0.41 and 0.21 for G1, G2 and G6 respectively, while computed from Cost PF approach, they are 0.46, 0.39 and 0.15 respectively.
 and Cost PF approach.
 and Cost PF approach are depicted in Fig. 2. As can be seen that, both LM obtained with the proposed method and Cost PF approach are almost consistent with the results shown in Table 3.When using objective
  , the curves for searching the minimum generation cost and the associated LM is depicted in Fig. 3. As seen that the minimum cost is obtained at the 24th iteration.The LMs for various generation increments of G2 versus G6 are expressed as a curve surface in Fig. 4. It can be seen that a larger LM is mainly correspondent with a bigger generation increment for G6. Therefore, to improve LM, it is available to increase the generation of G6.The critical buses obtained from the tangent vector in (11) with
  are shown in Table 4. In order to further improve LM, an SVC with 2 p.u. reactive power is installed at bus 14 and the effects for each GD are shown in Table 5. As found that, although the contribution of the GD, expressed as the PI value, obtained with the Cost PF approach is larger than other GD derived from the proposed method, however, they are very close to each other, among which 513.6 is the smallest with the maximum LM (=3.64 p.u.) obtained from using objective
  in the proposed method.


 Abstract
 Reference
 Full-Text PDF
 Full-text HTML

 , maximum LM and costs for the three objectives and Cost PF approach

