-
Paper Information
- Next Paper
- Paper Submission
-
Journal Information
- About This Journal
- Editorial Board
- Current Issue
- Archive
- Author Guidelines
- Contact Us
Electrical and Electronic Engineering
p-ISSN: 2162-9455 e-ISSN: 2162-8459
2011; 1(1): 1-6
doi: 10.5923/j.eee.20111001.01
Benefit-Based Optimal SVC Installation for Transmission System Loadability Enhancement
 Abstract
 Reference
 Full-Text PDF
 Full-Text HTML
Ya-Chin Chang
Department of Electrical Engineering, Cheng Shiu University, No. 840, Chengcing Rd., Niaosong Dist., Kaohsiung City, Taiwan
Correspondence to: Ya-Chin Chang , Department of Electrical Engineering, Cheng Shiu University, No. 840, Chengcing Rd., Niaosong Dist., Kaohsiung City, Taiwan.
| Email: |  |
Copyright © 2012 Scientific & Academic Publishing. All Rights Reserved.
In order to enable power systems to accommodate more power transfers with less network expansion by building new transmission lines, reinforcement of existing transmission networks is becoming more urgent. Installation of Flexible AC Transmission Systems (FACTS) devices can be a better choice among previous methods. The aim of the optimal shunt voltage compensator (SVC) installation problem proposed in the paper is to maximize the benefit from the future fuel expense with proper SVC installations such that transmission system loadability can be improved the most. A particle swarm optimization (PSO) algorithm involving in the continuation power flow (CPF) process is used to determine the optimal SVC installation for the network reinforcement. The effectiveness of the proposed solution method is validated with the SVC installations conforming to the benefit from the investment.
Keywords: Continuation Power Flow, FACTS, Particle Swarm Optimization, System Loadability, Tangent Vector
Cite this paper: Ya-Chin Chang , "Benefit-Based Optimal SVC Installation for Transmission System Loadability Enhancement", Electrical and Electronic Engineering, Vol. 1 No. 1, 2011, pp. 1-6. doi: 10.5923/j.eee.20111001.01.
Article Outline
1. Introduction
- The reconstructed power systems under deregulation are confronted with new challenges to building new transmission lines for accommodating significantly increased power transactions. In order to improve system loadability and derive high operational efficiency and system security, other than to build large interconnected systems, another viable way is the use of the FACTS devices [1-12]. The issue of optimal installation of FACTS devices to improve loadability and security of system operation has been researched and discussed widely and several strategies were proposed. Most of those studies oriented towards technical or economic concerns. In technical concerns, the method proposed in [1] separately installed different types of FACTS devices on different positions in practice to identify the improvements of loadability. While in [2], Genetic algorithm (GA) was used to select suitable positions to install FACTS devices for maximizing system security and improving loadability. In [3], the CPF method was utilized to derive the maximum control law of FACTS devices to improve system security and loadability. Linear programming based optimal power flow (OPF) method was used in [4] to speed control on parameters of FACTS devices when contingencies happen, and thus fast decision of load shedding was made for overload and irregular voltages.For a practical system, due to the large search space in the FACTS installation problem with discrete and continuous variables to be determined, the computational burden will be high. A crude model was proposed in [5] to fast estimate the rough solutions for a set of candidate locations, and then the accurate solutions for a smaller set of candidates selected based on ordinal optimization theory are obtained with the correct method. The best solution is suggested as the good enough solution. While in [6], to lessen the computing burden for solving the discrete variables, a two-step approach is proposed. First, the locations suitable for SVC and TCSC installations are investigated by using analytical techniques, and then OPF methods are used to determine the best controls of the SVC and TCSC installations and the other control devices to maximize system loadability. While in economic concerns, the objective functions considered in [7] and [8] were the total investment of FACTS devices and generation costs, and GA was utilized to make decision where to install FACTS devices. The strategy proposed in [9] was comprised of tabu search (TS) and a nonlinear programming method to optimize FACTS devices investment and cost recovery. The method in [10], with the proposed performance indices of real power flows, was used to seek the optimal positions for installation of FACTS devices. Under the existent FACTS devices in the network, in [11], the minimum generation cost based OPF was solved using the proposed hybrid of TS and simulated annealing (SA) algorithms. While in [12], an optimal strategy comprising CPF and OPF techniques to install the static model of FACTS device, UPFC, was proposed, and the minimum cost of generations and FACTS devices were calculated.For dealing with both concerns together, several methods had been proposed in previous literatures. In [13], the generation cost, the investment of FACTS devices and the transmission security functions were together taken into account and a multi-objective GA algorithm was used to determine what types of FACTS devices should be used, their installation positions and rated capacities. In [14], for allocation of FACTS devices, the linear cost functions related to various types of devices, nonlinear security indices of real power flows and bus voltages stability constraints were together involved in the objective function, and the PSO algorithm was used to solve the discontinuous optimization problem.This paper focuses the optimal SVC installation on both concerns to maximize the benefit from the investment, and thus improving system loadability with high efficiency. This optimization problem would be carried out based on the PSO algorithm involving in the CPF process to evaluate the reactive power provided by each SVC installation. Prior to the evaluation, the tangent vector technique [6, 15] is referred to specify which buses need SVC installation.
2. Transmission System Loadability
- The power system model can be formulated by a functional vector including the system nonlinear real and reactive power flow balance equations in the following form:
 | (1) |
 that, associated with a loading level, would drive the system from one stable equilibrium point to another, is inserted into the power flow equations, the system equations become:
  | (2) |
 | (3) |
 | (4) |
 and
and  are the real and reactive power flows on bus i of line i-j;
  and
and  are the base-case injections (including generation and load) to bus i;
  ,
,  and
and  are a set of specific loading increments related to the expected future increases of generation real power, load real and reactive powers on bus i,
  ,
,  denoting the set of the buses associated with the loading increments. If increases are not allowed,
  ,
,  and/or
  would be zero. For clarity, the loading increments is denoted by a vector
  and
and  defined as a loading increment path to make loadability increase, whereas
  is used to seek for loadability along the loading increment path. The loadability =
 , where
 being the maximum value of
  , as represents the critical value of a saddle-node bifurcation point for the system about to become instable. The
  can also be referred to as the maximum LM or static voltage stability margin (VSM) for a specific loading increment, based on bus voltage stability collapse or critical constraints [16]. As an SVC installed on bus i, the reactive power balance equation can be expressed as:
  | (5) |
 is the reactive power provided by the SVC installation. It is another decision variable that may lead the system to a new state, whose value should be within the limited ranges defined as:
 | (6) |
 is the set of the PQ buses specified for SVC installation.
3. Key Approaches
3.1. Tangent Vector Technique
- The tangent vector [15] is used to estimate how the state variables are changed along a loading increment path, which can be evaluated from (2) based on the base-case Jacobian matrix
 and a unit change of parameter
  , say
, say , expressed as:
  | (7) |
3.2. CPF Process
- In the preceding, to seek the loadability, the power flow equations (3) and (4) on the buses associated with the loability with the loading increments were reformulated to contain parameter
 . If the functional vector
  is used to denote the whole set of equations, the problem can be expressed by:
 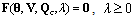 | (8) |
 , the base-case state
  can be obtained first by using a conventional power flow method, and then
  will be sought along the loading increment path by applying the CPF process. During the process, when no more increases, namely reaching
 , eventually the loadability,
  , is derived. CPF uses a predictor-corrector scheme along the loading increment path to find subsequent values of
  . While the corrector is only a slightly modified Newton-Raphson power flow, predictor is quite unique from anything found in a conventional power flow and deserves detailed attention [16]. PredictorAfter the base-case state obtained, a prediction of the next solution can be made by taking an appropriately sized step in a direction tangent to the solution path (loading increment path). Thus, the first task in the predictor process is to calculate the tangent vector. This tangent calculation is derived by first making derivative to both sides of (8) as follows:
  | (9) |
 that is directly associated with the base loading increment. In order to find a unique solution, an important barrier must be overcome. This problem arises when variable
  was inserted into the power flow equations but the number of equations remains unchanged. Thus, one more equation is required. This problem can be solved by choosing a non-zero magnitude, say 1, from one of the components in the tangent vector. Since the equations in (9) are linear, let
  be equal to 1 to simply denote the tangent vector and suppose
  would increase in each step until
 reached. Equation (9) is then augmented and becomes:
  | (10) |
 is an appropriately dimensioned row vector with all elements equal to zero except the (
 )th, which is equal to 1 associated with the unit change of
  .Once the tangent vector is obtained by solving (10), the predication can be made by:
  | (11) |
 and the scaling factor
  should be appropriately chosen during each predication so that the solution can be within the convergence radius of the corrector.The corrector process is used to modify the predicted solution onto the solution path with one of the state variables being ascertained into an additive equation, say
  . Then, the new set of equations would be:
  | (12) |
 , assuming on bus k, which has the most negative value in the prediction. With an additive equation and variable
  , the augmented equations can be solved by a slightly modified Newton-Raphson power flow method. For dealing with the saddle-node bifurcation point on the loading increment path, the CPFLOW method in [19] is employed to execute the CPF process. In this paper, by taking into account both technical and economical concerns, the maximum benefit from the investment for SVC allocation and the corresponding loadbility along the loading increment path will be solved with the following method.
 4. Optimal SVC Installation Method
- To benefit from the future fuel expense, in this paper, a direct cost recover from the average customer of the system is supposed to be
 [17]. The benefit rate from future system loadability is evaluated by:
 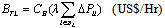 | (13) |
 | (14) |
 (Mvar) is the capacity of the SVC installation at bus i. The unit of
  is US$/Mvar.Obviously, the cost function in (14) must be unified into US$/MvarHr. Assume five years of its lifetime is employed, and the cost function for investment recovery becomes:
 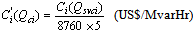 | (15) |
 ; if
; if  , set
, set  to 1.0 p.u..The total cost to recover from the investment to the SVC installations is evaluated by:
  | (16) |
4.1. Problem Formulation
- The benefit-based optimal SVC installation problem is formulated as follows:
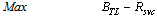 | (17) |
 | (8) |
 | (19) |
 | (20) |
 are sought via the CPF procedure along the loading increment path. The buses voltages are found when a terminated condition met.
 4.2. PSO-based Solution Algorithm
- In order to relate the problem formulation to the PSO algorithm appropriately, different sets of reactive powers provided by the SVC installations are denoted as individual particles of the population and will be randomly reproduced in the beginning of each iteration. Particle i is defined as: where m is the number of the installed SVCs in set .In the PSO-based solution algorithm, the CPF process is used to solve for the loadability for each particle. The solution algorithm is shown below:
5. Numeric Results and Discussions
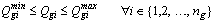
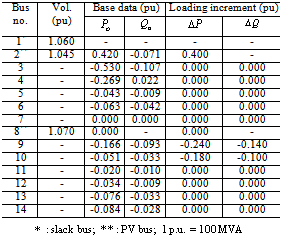
- The modified IEEE-14 buses system shown in Fig. 1 is used to validate the proposed method. The base-case data and the specific base loading increment are shown in Table 1. For simplicity of analysis, the voltage magnitudes of the PV buses (including an AVR on bus 8), shown in the second column of Table 1, are set to be fixed. Based on the base loading increment and the Jacobian matrix of the base-case state, using the tangent vector in (7), the changes of voltage magnitudes on the PQ buses were calculated and the 6 buses with most negative changes are shown in Table 2, which are considered to be suitable for SVC installation. As can be seen that the changes on buses 9 and 10 are bigger than the others due to that the two PQ buses are directly associated with the increased loading.In below analysis, it is assumed that the investment cost is only allowable for four SVC installations and each of them should be limited in the capacity ranges [1, 2.4] p.u. reactive power. Accordingly, four cases of different combinations of the buses shown in Table 2 are given in Table 3 to help make decision which buses need SVC installation. In following test, one of the four cases combined with the critical buses should be chosen.
 | Figure 1. Modified IEEE-14 bus system. |
|
|
 , for the four cases are shown in Fig. 2. As seen that the maximum loadability (
 ) is obtained from case 1 and the most critical voltage magnitude found on bus 9 is equal to 8.20 p.u., which is the biggest in the four cases. Consequently, case 1 is chosen and the four buses 6, 9, 10 and 11 are specified for SVC installation. And then, the proposed method is used to solve for an optimal SVC installation based on the locations of case 1 specified for SVC installation.
|
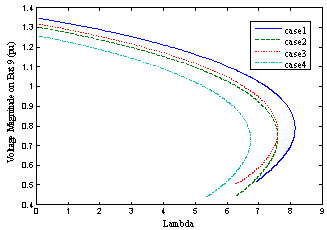 | Figure 2. P-V curves for the four cases. |
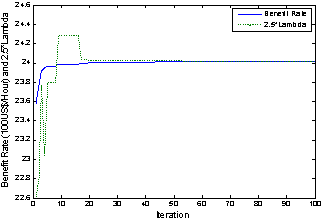 | Figure 3. Course for Seeking maximum benefit rate and loadability. |
 ) using the proposed method is shown in Fig. 3. As can be found that the maximum benefit rate derived is 2414 (US$/Hr) and the corresponding loadability equals
  =
=  , with the reactive powers provided by the four SVC installations being 1.398, 2.0, 1.745 and 0.502 p.u., respectively. In addition, it can also be found from Fig. 3 that, at 11th iteration, the reactive powers provided by the four SVC installations are 1.480, 2.0, 1.877 and 0.601 p.u. respectively, and the corresponding loadability equal to
  = 4.08 p.u. is bigger than 4.035 p.u.. Therefore, it is found that a bigger loadability can be derived from a different SVC installation. With the same reactive powers provided by the SVC installations and only using
  as the objective function to be maximized, the loadability is found to be 4.458 p.u., which is bigger than the others obtained before. The most critical voltage magnitude equal to 0.84 p.u. is found at bus 4. The capacities of the four SVC installations are set to 1.678 p.u., 2.40 p.u., 2.094 p.u. and 1.0 p.u., respectively. On the other hand, when network structure remains unchanged, namely without SVC installation, the loadability is found to be 3.715 p.u., as is much less than 4.458 p.u., and thus the effectiveness of the proposed SVC installation method is validated through the test.
 6. Conclusions
- This paper proposes an optimal SVC installation problem to maximize the benefit from the investment as well as to enhance the transmission system loadability the most. The problem is solved by using a PSO algorithm involving in the CPF process for maximizing system loadability considering static voltage stability. The locations for SVC installation are specified on the critical buses determined by the tangent vector technique. From the test results, the effectiveness of the proposed method is confirmed with the derivation that, not only the maximum benefit can be derived but also system loadability be largely improved.