-
Paper Information
- Paper Submission
-
Journal Information
- About This Journal
- Editorial Board
- Current Issue
- Archive
- Author Guidelines
- Contact Us
Education
p-ISSN: 2162-9463 e-ISSN: 2162-8467
2020; 10(2): 41-48
doi:10.5923/j.edu.20201002.03
Received: June 23, 2020; Accepted: July 20, 2020; Published: August 15, 2020

Effects of Sports Participation on the Academic Performance of Grade 12 Students after the K-12 Implementation
 Abstract
 Reference
 Full-Text PDF
 Full-text HTML
Joswa Billonid , Ma. Teresa Cabailo , Winde Rose Mie Dagle , Donna May Godilano , Kyle Robert Kibanoff , Lenny Rose Tasic
Department of Senior High School, Western Institute of Technology, Iloilo, Philippines
Correspondence to: Joswa Billonid , Department of Senior High School, Western Institute of Technology, Iloilo, Philippines.
| Email: |  |
Copyright © 2020 The Author(s). Published by Scientific & Academic Publishing.
This work is licensed under the Creative Commons Attribution International License (CC BY).
http://creativecommons.org/licenses/by/4.0/

Implementing the K-12 program is part of an active effort by stakeholders in Philippine education to solve the shortcomings in the educational system. This new educational framework seeks to deliver a more thorough and well-rounded educational experience for the students. However, this system's implementation and the addition of extracurricular activities like athletics provide several difficulties for students. This study compared the academic performance of athletes and non-athletes in Grade 12 Senior High School (N=60) using their midterm scores and a self-report survey questionnaire after the K-12 implementation. Data from the students' midterm scores and a self-report survey questionnaire administered after implementing the K-12 program were analyzed using a t-test. The results showed no significant difference in the midterm scores between non-athletes (78.13 ± 13.71) and athletes (73.7 ± 9.13), with a p-value of 0.146. The results of the survey questionnaire showed that only two (2) questions out of fifteen (15) (i.e., Do you skip classes? and Do you have enough allowance?) had a significant difference (p>0.05). The results of the current study demonstrated that student-athletes perform academically on par with non-athletes and can function both inside and outside the classroom. They could maintain attendance despite needing more time for training and getting used to the K–12 system. This study generally demonstrated that with the establishment of K–12, Grade 12 Senior High School pupils' engagement in athletics had little bearing on their academic achievement. The study's findings are crucial for promoting and supporting student participation in sports activities across all education stakeholders.
Keywords: General Academics, K to 12 Programs, Student Participation in Sports Activities, Athletics as Extracurricular, Activities, Self-report Survey Questionnaire
Cite this paper: Joswa Billonid , Ma. Teresa Cabailo , Winde Rose Mie Dagle , Donna May Godilano , Kyle Robert Kibanoff , Lenny Rose Tasic , Effects of Sports Participation on the Academic Performance of Grade 12 Students after the K-12 Implementation, Education, Vol. 10 No. 2, 2020, pp. 41-48. doi: 10.5923/j.edu.20201002.03.
Article Outline
1. Introduction
- Following popular stereotypes, some believe one can be academically or athletically inclined, but rarely both [1]. However, athletes must perform well academically and athletically. Student-athletes are described as a “Diverse Special Population” because of the roles they need to accomplish inside the campus, as students and athletes with different lifestyles than regular students [6]. Furthermore, Sedlacek and Adams-Gaston [25] classify student-athletes as “nontraditional” due to their sports experiences, obligations, and roles on campus. The researchers found four areas that student-athletes must commit to and focus on daily: academics, sports, personal development, and career development. Academics are the primary focus of the school environment, and extracurricular activities play a role in molding a well-rounded individual [23]. Being a student-athlete is not easy because they spend most of their time on sports training instead of studying, which may affect their academic performance in the long run. The good academic performance of an athlete is essential to be eligible to compete in athletic events, receive a scholarship, and graduate with the chosen degree. Student-athletes must perform responsibilities such as attending classes, studying, and passing examinations [6]. The study of Aries et al. [3] found that students involved in athletic activities for more than ten (10) or more hours per week had lower academic performance than non-athletes.A qualitative study by Emerson et al. [9] showed that external factors motivate student-athletes to achieve and they believe that grades are an external evaluation of their performance. The same study found that student-athletes communicate with one another about grades. In the study of Aries et al. [3], student-athletes were found to surpass sociability aspects compared to non-athletes. Sports enthusiasts claim that sports participation motivates student-athletes, and the results of Grimit support this idea [17], wherein the student-athletes performed better in the classroom, developed remarkable time management skills, felt motivated to complete their degree, and were motivated to attend classes.Nevertheless, there needs to be specific research about the effects of sports participation on the academic performance of senior high school students after implementing the K-12 curriculum in the Philippines education system. Thus, this study compared the academic performance of student-athletes and non-athletes in Grade 12 Senior High School using their midterm scores and a self-report survey questionnaire after the K-12 implementation.
1.1. Objectives of the Study
- This study compares the academic performance of student-athletes and non-athletes in Grade 12 Senior High School after the K-12 implementation.Specifically, it aims to answer the following questions:1. Do student-athletes differ from non-athletes in their academic performance if compared using the midterm scores?2. Do student-athletes differ from non-athletes in their self-report activities using the survey questionnaire?3. Is there a significant difference in the academic performance of student-athletes and non-athletes in Grade 12 Senior High School after implementing K-12?
2. Materials and Methods
2.1. Research Design
- This study used comparative and descriptive quantitative designs [1] to determine the effects of sports participation on the academic performance of grade 12 students after implementing K-12 (Figure 1).
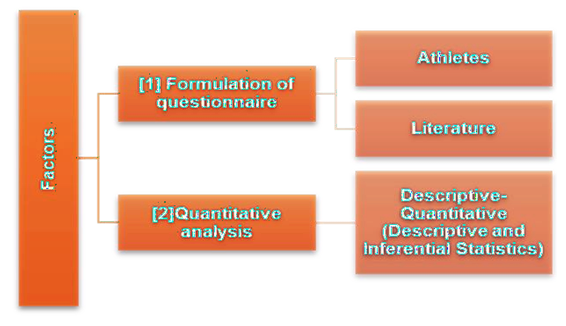 | Figure 1. Schematic diagram of the Descriptive-Quantitative Analysis |
2.2. Research Instrument
- The study used a validated survey questionnaire and midterm score to measure the participants’ academic performance. The questionnaire was formulated based on the information gathered from the athletes and existing data from the literature. The questionnaires were validated according to content, construct, and face by Department of Senior High School experts. The instrument was finalized based on their opinion and suggestions [1]. The survey part of this study was limited to a self-report context only. The survey questionnaire consisted of 15 questions and scored using 4-point Likert-type scales: (1) Never, (2) Sometimes, (3) Often, and (5) Always [17]. The midterm examination scores of students were used to measure their academic performance. The rationale for using midterm scores is that this examination is conducted after the sports competitions. For this reason, the researcher believes that the midterm scores accurately measure the athletes' academic performance without the biases of the teacher factor (Figure 1). The teacher factor is based on the finding of Bonura [5] that many students and professors believe that student-athletes receive discriminatory treatment academically, like having good grades without earning them. The consolidated results are presented in the bar and heat map using Microsoft Excel 2010.
2.3. Participants
- A total of 60 students were the participants of this study and were selected using convenience sampling [3]. These 60 students were purposively selected and categorized by researchers to have 30 student-athletes and 30 non-athletes. In this study, student-athletes participated in sports competitions before the midterm examination. Non-athletes refer to students who did not participate in any sports competition before the midterm examination. The following researcher-made criteria are utilized for the selection of respondents: (1) Enrolled as Grade 12 Senior High School students; (2) Taking Media and Information Literacy under the same subject teacher at the time of this study; and (3) Involved in a sports competition before the midterm examination (for the athlete). The selected criteria were formulated to avoid teacher and subject bias factors and control the other facets not covered in this study but that could affect the respondents' academic performance.
2.4. Data Analysis
- Data analysis was done through descriptive and inferential statistics [23]. The mean, standard deviation, and percentage were used for the descriptive statistics [20] using Microsoft Excel 2010. For the inferential statistics, the Statistical Package for the Social Sciences (SPSS) v20 was used as a statistical tool to analyze the data using a t-test. The alpha value of 0.05 was used as the cutoff for significance.
3. Results
3.1. Midterm Scores
- The midterm scores showed that the non-athletes generated the highest mean with a value of 78.13 ± 13.71, compared to student-athletes with 73.7 ± 9.13 (Figure 2). Although non-athletes had higher midterm scores than student-athletes, based on statistical analysis, there was no significant difference in the midterm scores of students. Student-athletes and non-athletes (p=0.146) performed similarly to each other regarding midterm examinations.
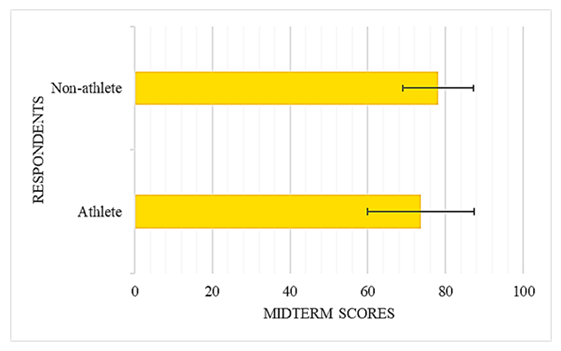 | Figure 2. Results of Midterm examination |
3.2. Survey Questionnaire
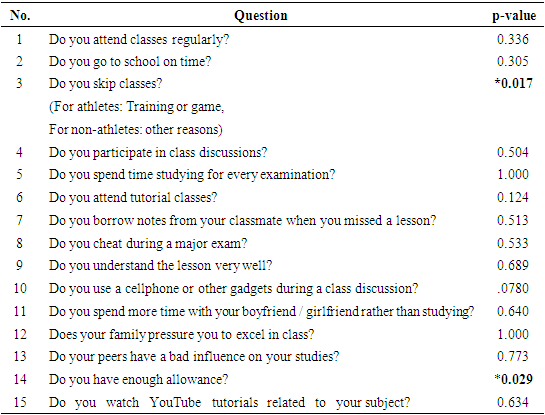
- The validated survey questionnaire explored the different activities that could affect a student’s academic performance during the midterm examination (Figure 3).
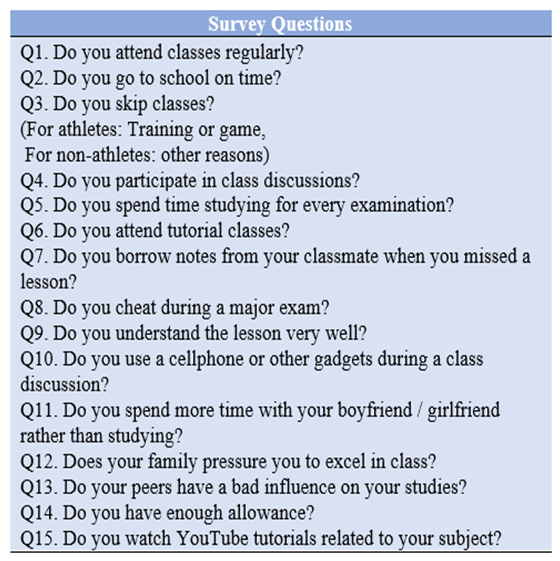 | Figure 3. Survey questions |
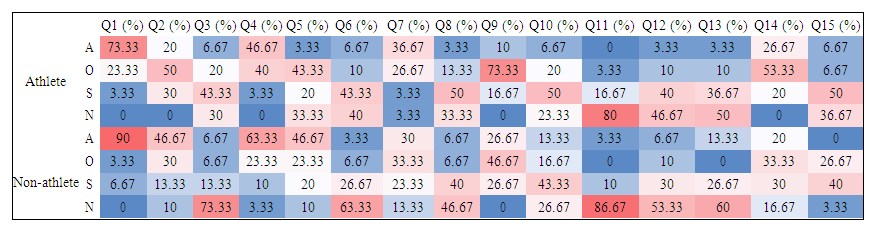 | Figure 4. Heat map showing the percentage of the responses categorized according to the respondents. Intense red means the highest percentage, and intense blue means the lowest percentage. The following initials mean: (Q1) Do you attend classes regularly; (Q2) Do you go to school on time; (Q3) Do you skip classes; (Q4) Do you participate in class discussions; (Q5) Do you spend time studying for every examination; (Q6) Do you attend tutorial classes; (Q7) Do you borrow notes from your classmates when you missed a lesson; (Q8) Do you cheat during a major exam; (Q9) Do you understand the lesson very well; (Q10) Do you use a cellphone or other gadgets during the class discussion; (Q11) Do you spend more time with your boyfriend/girlfriend rather than studying; (Q12) Does your family pressure you to excel in class; (Q13) Do your peers have a bad influence on your studies; (Q14) Do you have enough allowance; (Q15) Do you watch YouTube tutorials related to your subject? |
|
4. Discussion
- Research shows that participation in sports has excellent cognitive and physical benefits [3]. Physically, exercise promotes heart health, good weight management, healthy blood pressure, and mental sharpness [14]. In the present study, to answer the first research question, “Do student-athletes differ from non-athletes in their academic performance if compared using the midterm scores?” a comparison of midterm examination results was conducted. The analysis showed that though the midterm scores of non-athletes were higher than the student-athletes, the statistical results showed no significant difference in the midterm scores (Table 1). This result supports the claims that participating in sports had no negative impact on the academic performance of athletes (midterm scores in the case of this study) despite the implementation of K-12 in the Philippine education system. This result is consistent with the study of Yarkwah and Agyei [29] that participation in sports had no adverse effects on the academic performance of student-athletes. Sports participation instead contributed to the academic profile of student-athletes in terms of academic excellence, self-discipline, cognitive skills, and class participation. This result agreed with other studies that believe athletic activities enhance skills, stamina, and endurance and help promote cognitive function [3]. Similar trends were found in the study by Grimit [17], where the results revealed that student-athletes performed better in the classroom, developed remarkable time management skills, felt motivated to complete their degree, and were motivated to attend classes.To answer the second and third research questions, “Do student-athletes differ from non-athletes in their self-report activities using the survey questionnaire?” and “Is there a significant difference in the academic performance of student-athletes and non-athletes in Grade 12 Senior High School after the implementation of K-12?” a descriptive-quantitative analysis was conducted through a survey. The descriptive-quantitative design explores the daily activities inside and outside the school of student-athletes to determine their coping strategies and compare them to those of non-athletes. ETC [10] stated that learning is wasted when a student is late or absent. In the present study, both student-athletes and non-athletes considered regular class attendance as significant, wherein “always” rated the highest percentage compared to their other answers (Figure 1). Attendance and punctuality are essential factors in ensuring students have an equal opportunity in the curriculum. Moreover, for student-athletes to participate in sports activities, students must be present in classes [19]. Some students who are late to attend class attempt to explain the difficulties that prevent them from being punctual [4]. Despite these excuses, students should come on time for class. Interestingly, the present results are far from expectations. There was no significant difference in punctuality during class attendance between the student-athletes and non-athletes. This result means that student-athletes did not use sports activities as an excuse for late attendance and avoided being undisciplined and unfair to other class members. The results of the present investigation are consistent with the study of Grimit [17] that student-athletes were motivated to attend classes. ETC [10] reported that the attendance and punctuality policy clearly states that “regular and punctual attendance is paramount in ensuring that all students have full access to the curriculum. Valuable learning is lost when students are absent or late”. Students often encounter a problem with motivation to attend classes [8], and it was observed in the present study that some students who were not athletes also skipped classes. However, this practice was also observed in student-athletes, where the highest percentage was found in those who indicated they “sometimes skip classes for training”. The consequence was evident in their midterm scores; though the result was insignificant, the trend showed that athletes had lower midterm scores than non-athletes. However, student-athletes could compensate for occasional absences when they were inside the classroom by contributing to class. This observation supported the present results that both student-athletes and non-athletes were active in class discussions. The percentage of those who answered “always” dominated compared to the other answers in student-athletes and non-athletes (Figure 1). This result agrees with the study of Grace et al. [15] that athletes give their best efforts to participate in class activities and discussions. Most students gain more knowledge and enjoy themselves if they actively contribute to class [28]. Some students have trouble in class, not because of a lack of ability but because they lack good study skills, such as reading textbooks and notes for the exam [18]. Studying before the exam to improve memory has a significant impact on exam scores.Moreover, this study showed no significant difference in the study habits between non-athletes and student-athletes before examinations (Table 1). This result inferred that student-athletes tend to do the same activities academically compared to non-athletes. Yilmaz et al. [30] concluded that there is a significant relationship between study habits and athletes’ academic performance. Another option to cope with the class activities was attending class tutorials. In this study, student-athletes and non-athletes who do not attend tutorial classes dominated the survey. However, some of them do attend tutorials. This result can be an important matter that the school needs to work out, especially for the student-athletes: for example, it could be made mandatory for student-athletes to attend tutorial classes. Students attend tutorial classes for different reasons: to fulfill their parents’ expectations, pass a university entrance examination, excel in class, get high grades, etc. [7]. As student-athletes, they tend to spend more time in training than studying, which leads to a lot of prejudices and stereotypes. Student-athletes who are more active and committed to sports than to academics often believe they are not smart [3]. School non-attendance might lead to severe consequences [21]. One of the student-athletes’ coping strategies is to borrow notes from their classmates, and the results of the present study showed that student-athletes and non-athletes borrow notes from their classmates when they miss a lesson. However, what if student-athletes were not able to cope with their classes? One common problem in school is cheating. According to Graves [16], students who cheat on examinations show dishonesty and are unfair to other students. The present investigation revealed no significant difference in responses of student-athletes versus non-athletes (Table 1).Students have their own strategies to understand lessons. Some students analyze the lesson through viewing, listening, and visualizing [11]. In this study, both student-athletes and non-athletes understood their lessons very well (if not always) and the difference between the two groups was not significant (Table 1). This result means that even if student-athletes had extracurricular activities, they could understand the lesson as readily as a non-athlete. Students assume the presence of the internet as a great help in their social and educational lives [12]. In the present study, using the internet can be another way to cope with their missed lesson. The use of the internet for educational purposes is increasing, especially for assignments that require the use of the internet [30]. In this study, student-athletes and non-athletes partly use gadgets during class discussions (Figure 1). The same trend was found in the results: that is, no significant difference in student-athletes and non-athletes in using YouTube for further learning (Table 1). The literature supports this result as computer-based instruction improves students' ability. It also increases students' understanding through visualization [22].Hormonal changes affect students when they reach their teenage life [13]. During this stage, students often engage in a romantic relationship, be it serious or not. This scenario can affect the academic performance of students. The present investigation showed that student-athletes and non-athletes do not prioritize romantic relationships over their studies. Sports activities for students with social adjustment issues are essential physically, mentally, and socially [24]. Their attitude and how students act in different school situations are mainly affected by peers, but also notably by parents. A significant relationship exists between the parent’s relationship and student academic performance [2]. In the literature, parents rarely support or let their children join a particular sport because not all parents want their children to be athletically inclined. Mostly, they think that being athletically inclined may hinder academic achievements, while others require their children to participate in sports for social and cognitive benefits [3]. In this study, student-athletes and non-athletes were not pressured by their families in their studies (Figure 1).People need social interactions with their peers or friends. The influence of peers is strong, which makes one follow others in the peer group. Moreover, to feel a sense of belonging, people tend to adapt to the influence of their friends [1]. Interestingly, the present study showed no significant difference between the athletes and non-athletes in terms of the influence of their peers (Table 1). In the literature, studies have shown that sports participation is used to help students with social adjustment disorders. Students with adjustment issues who participated in sports programs reported a feeling of belonging and empowerment [24]. Aside from friendships, another factor that can affect students' academics is their financial status. Vhalery et al. [27] stated that allowance is given to students for educational needs to learn how to value money and use it wisely. The present study showed that even though money was needed for the student’s studies, not all the student-athletes and non-athletes received enough allowance. However, compared to the non-athletes, student-athletes seemed to have enough allowance.In summary, although non-athletes had higher mid-term examination scores than athletes, based on statistical analysis, there was no significant difference in the midterm scores of athletes and non-athletes (Table 1). In the survey questionnaire, only two of the fifteen questions showed a significant difference between the responses of the two groups of students (Figure 4). Student-athletes significantly skip classes for training compared to the non-athletes, who miss classes for other reasons, and student-athletes had enough allowance compared to the non-athletes. This result indicates that education stakeholders should create programs that will facilitate the academic needs of student-athletes during their training period. Lastly, although there were variations in responses, the statistical results showed that the other thirteen questions had no significant difference between the responses of student-athletes and non-athletes (Table 1).
5. Conclusion and Recommendations
- The present investigation showed that student-athletes have the same academic performance as non-athletes, and they could perform generally the same inside and outside the classroom as non-participants in sports. Despite needing extra time for training and adapting to the implementation of K-12, they could keep up with school activities. This study showed that athletic participation did not affect the academic performance of Grade 12 Senior High School students after implementing K-12. The study results are essential for all education stakeholders to promote and support the involvement of students in sports activities.This study is limited to Grade 12 students and focuses only on one subject. Thus, further investigation of the other grade levels is recommended to cover different subject matter. For the improvement of research, a qualitative method is recommended to achieve corroboration with the indications gained from the survey.
ACKNOWLEDGEMENTS
- The authors would like to acknowledge the grade 12 students who participated in the survey and the Department of Senior High School of Western Institute of Technology, Philippines, for facilitating the study's data collection. No grant or financial support was received during the conduct of this study.