Education

p-ISSN: 2162-9463    e-ISSN: 2162-8467

2018;  8(3): 54-62

doi:10.5923/j.edu.20180803.04


Speech Perception of Text-To-Speech English Sounds by Japanese High School Students

Harumi Kataoka

Faculty of Economics, Kindai University, 3-4-1 Kowakae, Higashiosaka City, Osaka, Japan

Correspondence to: Harumi Kataoka, Faculty of Economics, Kindai University, 3-4-1 Kowakae, Higashiosaka City, Osaka, Japan.

Email:

Copyright © 2018 The Author(s). Published by Scientific & Academic Publishing.

This work is licensed under the Creative Commons Attribution International License (CC BY).
http://creativecommons.org/licenses/by/4.0/

Abstract

The purpose of this study was to investigate whether 21 Japanese high school students were able to notice any difference between Text-To-Speech (TTS) voice rendering and human voices, that is, whether there was any “perception gap,” via a listening test. The TTS voice used was generated by concatenating phonemes of human voices. Some people view TTS voices as “artificial voices,” while others may view TTS voices as a kind of human voice even if they are recorded rather than being directly uttered from human mouths. This conceptual matter is a source of continued disagreement. The results of a listening test revealed that there was no statistically difference among three types of English speech, and the students did not notice that TTS English sounds were artificially synthesized speech sounds produced by personal computer. These findings indicate that TTS voices have a high enough quality for both Japanese high school English as a Foreign Language (EFL) students and teachers to use them as English language listening materials in high school English education in Japan.

Keywords: TTS, High school English education in Japan, Educational technology

Cite this paper: Harumi Kataoka, Speech Perception of Text-To-Speech English Sounds by Japanese High School Students, Education, Vol. 8 No. 3, 2018, pp. 54-62. doi: 10.5923/j.edu.20180803.04.

1. Introduction

In light of language recognition, English audio materials can be of great help and support for Japanese EFL learners studying English [13, 14, 16-18, 26, 30, 31, 35]. However, almost all of the audio language learning materials currently used in Japanese high schools are produced by commercial publishers. Many Japanese Teachers of English (JTE) feel that such materials do not properly correspond to their students’ English proficiency levels; using TTS, teachers can easily produce English audio materials themselves that better meet students’ needs [20].
Unfortunately, some Japanese and native English language teachers in Japan have negative attitudes toward using TTS sounds as audio materials for their lessons due to their artificially synthesized nature and/or machinelike speech [20-23]. TTS sounds are not “real/live” speech; however, TTS sounds are produced from an originally recorded human voice, and thanks to recent advances in computer technology, the speech quality of TTS has improved. At present, many TTS audio databases and TTS systems are sold globally, and the increasing ubiquity of these tools is one of the reasons for improved speech quality [23].
Nevertheless, negative perceptions persist, and so the author explored whether TTS sounds are suitable English audio materials for Japanese high school EFL education. To do so, speech perception research was conducted in this study.

2. English Speech Sounds in This Study

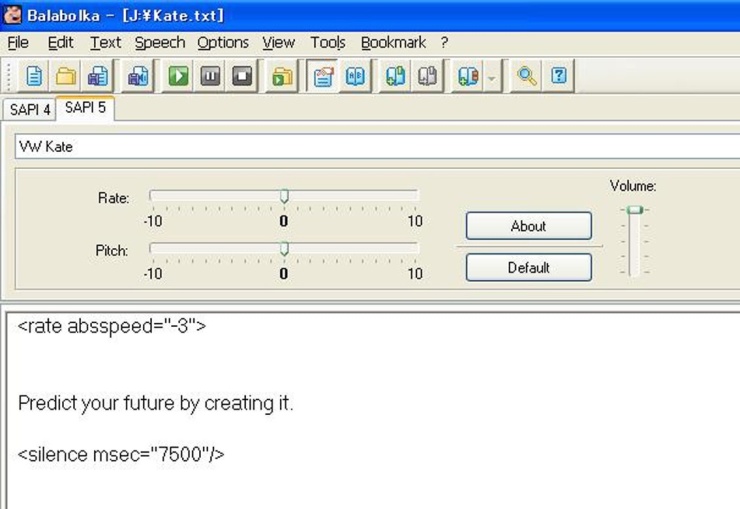
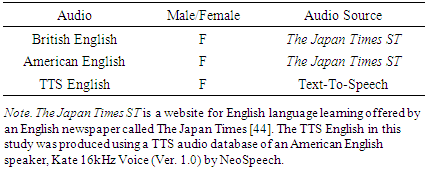
In this study, speech perceptions of TTS sounds by high school students were researched. If the participants listen to both a human voice and TTS sounds, and do not express any perception gap/feelings of strangeness about TTS sounds, then the use of TTS as pedagogical audio English tools in English lessons can be proved as having a high enough speech quality for this purpose. Three types of female voices in English—two natural voices, (a) British English and (b) American English, as well as (c) a TTS “voice” in American English produced by the program Kate 16 kHz Voice1— were recorded in order to conduct comparative research into Japanese EFL learners’ speech perception. Table 1 shows the audio sources of the three voices2 used in this study. In order to eliminate gender influence, the speech samples used were all female voices.
Table 1. Audio Source of Three Voices
     
English proverbs were used for this study for two reasons. First, high school students have little chance to study English proverbs, as they are not included in school curricula; however, they are sometimes used as questions in university entrance examinations in Japan. As such, the participants in this study asked for an opportunity to study English proverbs during their language lessons. Secondly, the author taught English as a JTE in high school and had previously written her Master’s thesis using English/Japanese proverbs as teaching materials for other high school students [19]. She believes that it is important for high school students to study English proverbs not only from an educational viewpoint but also for moral/ethical lessons.
Figure 1. A screenshot of the TTS system used in this study
The author decided to use the dual-purpose design to teach English proverbs to high school students in order to enable the research about speech perception of TTS sounds. Approximately 10 minutes were set aside for this activity during the students’ regular high school English lesson. After the activity, the author taught them the meaning of the English/Japanese proverbs as well.
Following are the four proverbs used in this study.
1. Predict your future by creating it.
(未来はそれを作り出すことによって予測せよ。)
2. Failure is an event, never a person.
(失敗は出来事であって、人間そのものではない。)
3. Patience is a bitter plant, but it has a sweet fruit.
(忍耐は苦い植物だが、甘い果実が実る。)
4. Success doesn’t come to you, you have to go to it.
(成功はやって来ない。自分から向かっていかなければならない。)
These four proverbs were recorded in the three aforementioned voices with their different speech sounds, for a total of 12 speech tokens in this study.

2.1. Acoustic Analysis Using a Speech Analyzer

To investigate the quality and features of TTS synthesized speech sounds in this study, 12 English speech tokens—four English sentences with three voices—were analyzed acoustically using the speech analyzer Praat (Ver. 5.1.15).
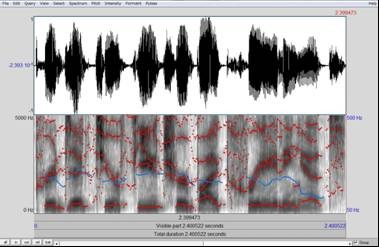
[39] revealed that human perception of speech sounds is changeable. Their research showed that participants detected a change in pitch of a half-value at various frequencies. In terms of psychological magnitude, they developed the concept of the MEL scale,3 upon which human perception of pitch is based. According to [9, p. 30], the relationship between the MEL scale and the Hertz scale is direct up to about 500 Hz. The author decided to use the Hertz scale in analyzing the features of each speech sound in this study (see Figure 2). [39, p. 185; 40; 28, p. 75] state that pitch can be a useful parameter in examining the features of speech sounds. To identify the features of the three voices used in this study, the author measured utterance duration, maximum and minimum pitch, and pitch range, analyzing each speech sound in the range from 50 Hz to 500 Hz, with reference to the speech analyses described by [9, p. 30]. Praat is a free software program that is widely used to analyze speech sounds; for example, [9] presented the results of acoustic analyses by Praat, and recommend its use in analyzing and examining speech sound features. In Japan, [27, p. 120] also recommended Praat as a speech analyzer because it is free of charge and can measure each speech sound accurately.
Figure 2. A screenshot of the speech analyzer Praat; Proverb No. 1, “Predict your future by creating it.” TTS sounds
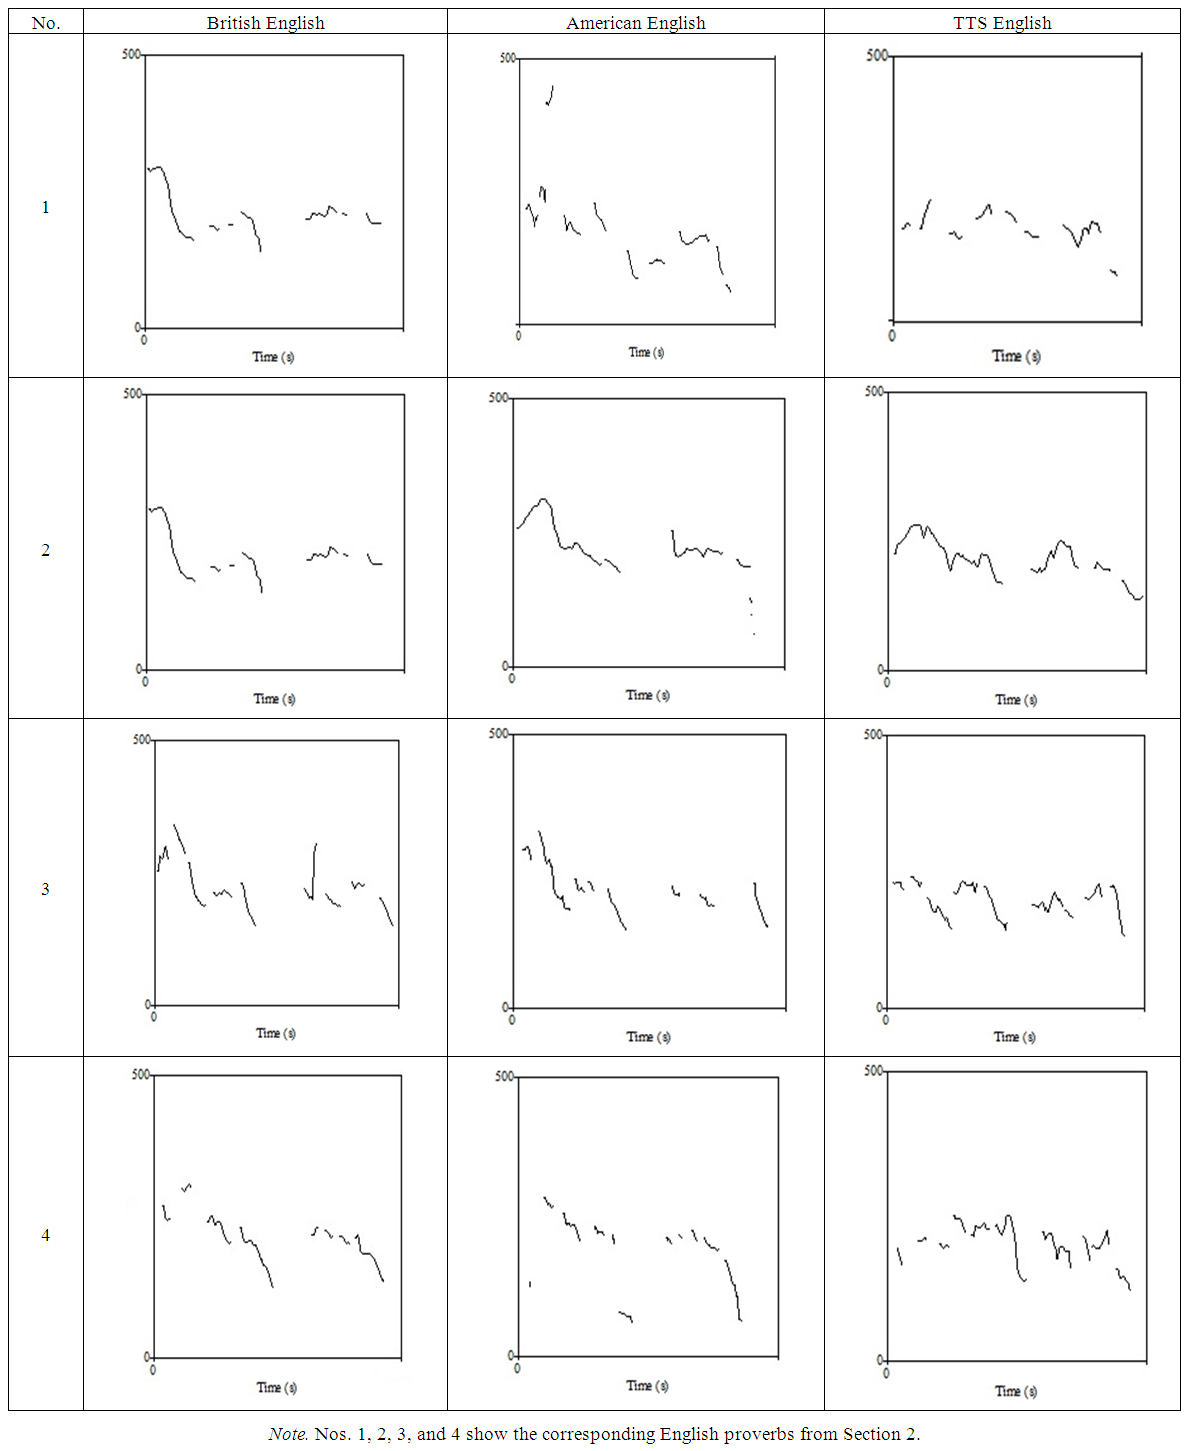
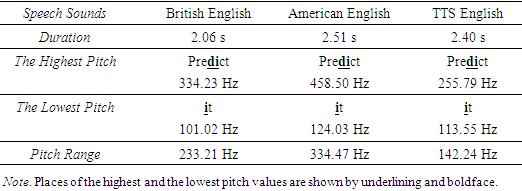
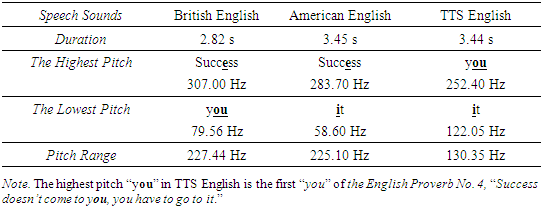
Both voiced and voiceless sounds can be depicted by acoustical waveforms or spectrograms on the screens of speech analyzers [9; 24; 37]. However, some voiceless sounds are harder to identify clearly in waveforms and spectrograms, whereas all voiced sounds can be clearly captured by acoustical analyzers. In general, the perception of pitch by the human auditory system is subjective and differs according to the individual [1; 25; 36; 39, p. 185; 41]; and impressions of voice characteristics also differ according to individuals [25; 45], partially because tone and intonation are manifested through pitch [28, p. 75]. As a result, it is important to measure pitch to determine the objective features of each voice. [38] used an intonation curve to indicate the features of speech. The 12 speech tokens in this study were analyzed for pitch, duration, and intonation curve. Pitch and duration data are shown from Table 2 to Table 5, and intonation curves are shown in Figure 3. Based on the sound analysis procedures designed by [28, p. 75; 9, p. 30], the intonation curve was analyzed by Praat.
Figure 3. Intonation curve of English sentences produced by three voices
Table 2. Acoustical Analyses of English Proverb No. 1, “Predict your future by creating it.”
     
Table 3. Acoustical Analyses of English Proverb No. 2, “Failure is an event, never a person.”
     
Table 4. Acoustical Analyses of English Proverb No. 3, “Patience is a bitter plant, but it has a sweet fruit.”
     
Table 5. Acoustical Analyses of English Proverb No. 4, “Success doesn’t come to you, you have to go to it.”
     
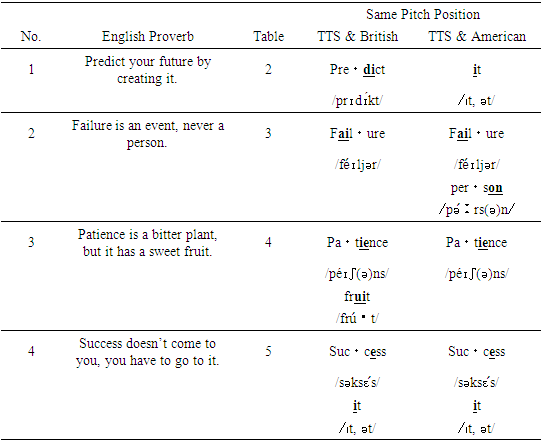
Table 6. High and Low Pitch Positions in Each English Proverb
     
The duration differences between proverbs4 were as follows. Proverb No. 1 showed a range of 0.45 s across voices (see Table 2), No. 2 was 0.31 s (see Table 3), No. 3 was 0.46 s (see Table 4), and No. 4 was 0.63 s (see Table 5). Each of these is less than 0.70 s/700 ms; thus, a significant difference in duration among the three voices was not evident.
The pitch range of TTS English was the narrowest among the three types of speech sounds (see Tables 2, 3, 4, and 5). The highest pitch of the TTS sounds in Tables 2, 3, 4, and 5 indicated that the tones of TTS sounds are lower than those of British and American speakers in this study.TTS sounds were produced by a recorded announcer/newscaster, whose speech was less emotional or expressive than daily conversation (i.e., flat tone). Therefore, TTS sounds in this study are more monotone and less emotional, like an announcer or newscaster.
All pitch values of the TTS sounds appeared to be the same as those of either the British or the American speech sounds. TTS and British voices had six pitch positions that were identical (see Tables 2, 3, 4, 5, and 6). They were (1) /ɪ́/ in the second syllable of predict, (2) /éɪ/ in the first syllable of failure, (3) /ə/ in the second syllable of patience, (4) /ú:/ in fruit, (5) /ɛ́/ in the second syllable of success, and (6) /ɪ, ə/ in it in proverb No. 4. There were six pitch positions that were the same between TTS sounds and American speech sounds (see again Tables 2, 3, 4, 5, and 6): (1) /ɪ, ə/ in it in proverb No. 1, (2) /éɪ/ in the first syllable of failure, (3) /ə/ in the second syllable of person, (4) /ə/ in the second syllable of patience, (5) /ɛ́/ in the second syllable of success, and (6) /ɪ, ə/ in it in proverb No. 4. Therefore, the TTS sounds in this study, which were originally produced by a recorded American woman’s voice, have audio/speech features quite similar to those of American English.

3. Method

The speech perception research conducted in this study was implemented in order to investigate whether Japanese EFL learners experience any perception gaps and/or differences among speech sounds produced by three English voices: (a) British English, (b) American English, and (c) TTS English. A group of high school students constituted the participants.

3.1. Participants

A total of 21 twelfth-grade (third-year) male students from a private boys’ high school in Osaka Prefecture participated in this study. On average, participants had studied English for five years (since junior high school). All were enrolled in the school’s comprehensive course (futsuuka).
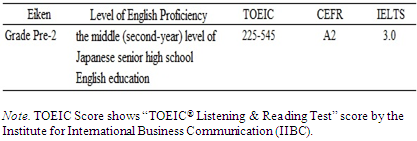
The Japanese Ministry of Education, Culture, Sports, Science and Technology (MEXT) published a guideline [29] of the definition of level EIKEN, TOEIC, CEFR, and IELTS (Table 7).
Table 7. Definition of Level EIKEN, TOEIC, CEFR, and IELTS
     
In order to measure their basic English proficiency levels, reading and listening tests from the first stage of EIKEN Grade Pre-2 test5 (one of the most popular English proficiency tests in Japan) were conducted (see Table 8). According to [6; 8], the level of English proficiency of EIKEN Grade Pre-2 is at the middle (second-year) level of Japanese senior high school English education. The EIKEN Grade Pre-2 test consists of a reading section (75 min.) and a listening section (25 min.); however, since the regular lesson time in the high school was 50 min, a shortened version of the EIKEN Grade Pre-2 test was conducted, comprising 53 questions selected from the standard test.
Table 8. Results from EIKEN Grade Pre-2 Test Items
     
The mean reading score was 9.10, with a range of 4.00 to 13.00, and the mean listening score was 12.81, with a range of 9.00 to 24.00. The passing score of a standard EIKEN Grade Pre-2 is around 60% of questions answered correctly for each of the two sections [7]. Although the shorter version of the EIKEN Grade Pre-2 test was given to the participants in this study, the results of the test imply the participant did not have enough English proficiency to pass the EIKEN Pre-2 test level.
None of the participants had had any prior experience of participating in this kind of experiment. The author assured the participants that they would remain anonymous, and that the results of the experiment would not affect their academic marks. All data in this study would be analyzed and displayed following conversion into a numerical value in order to avoid identification of individuals. After obtaining the requisite permissions, the author conducted each study in the high school. The rough results of the study were revealed to the students during their regular high school English lessons.

3.2. Procedure

This study was conducted during ordinary high school English lessons, not as an experiment in a laboratory. Therefore, a dual-Purpose design was adopted (Table 9).
Table 9. The Dual-Purpose Design
     
After the presentation of the materials in three voices to the participants, a following listening test as a fill-in-the-blank test was administered.
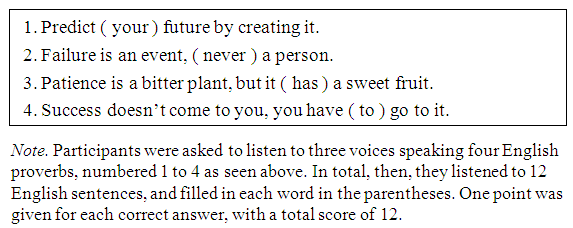
Figure 4. A listening test
A total of 12 speech tokens were created using the four proverbs in the three voices (see section 2). The 12 tokens were recorded in random order on a CD, which was played on a Panasonic RX-D12 CD player. Each proverb was given in writing on the listening test sheets.
The listening test, in the fill-in-the-blank test, carried full marks of 12 points. Each speech sound was followed by a 7.5-second-pause to allow participants to fill in the blank on the listening test sheet. As described above, the four English sentences used in this study were proverbs; the participants had not had many opportunities to learn proverbs, but they would be expected to encounter them later on, meaning that studying them here could hopefully be helpful for their university entrance examinations in Japan.
The data collected from the listening test was analyzed using IBM SPSS Statistics (Ver. 23.0) and JavaScript-STAR (Ver. 4.4.3j). A comparative analysis of the results for students’ speech perception was conducted.

3.3. Research Question

The hypothesis in this study was as follows:
H: TTS sounds are produced from an originally recorded human voice. Therefore, a statistically significant difference will not exist among the three voices in this study.
In order to investigate the qualities of TTS speech in English audio materials for Japanese high school students, the single research question (RQ) was formulated to explore their speech perception in relation to the three voices:
RQ: Is there a difference in the scores on the listening test among the three voices?

4. Results and Discussion

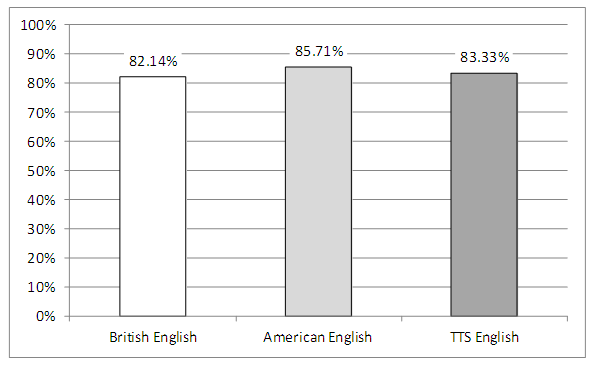
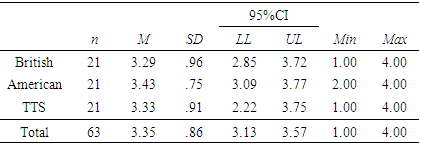
In the listening test, participants listened to 12 sentences, that is, four English proverbs each spoken in three voices, and answered the fill-in-the-blanks test on each. One point was given for each correct answer. The total possible score was 12 points. Accuracy rates on the listening test are shown in Table 10 and Figure 5.
Table 10. Descriptive Statistics of the Results of the Listening Test
     
Figure 5. Listening test accuracy rates among students at the high school
Of the three voices, the highest accuracy rate (85.71%) was for American English, the second-highest was for TTS English (83.33%), and the lowest was for British English (82.14%).
A one-way analysis of variance (ANOVA) was conducted to evaluate the results of the listening test, which were analyzed by IBM SPSS Statistics Version 23.0 for Microsoft Windows. Cronbach’s α6 was .83, which shows that the listening test was appropriate for the participants’ listening abilities.
Table 11. Results of the Listening Test of One-Way ANOVA
     
Because the number of participants was 21 students, which obviously created fewer than 30 samples, in order to check the variance of data, Levene’s test for equality of variance was adopted. The result of Levene’s test was .46, which, at greater than .05, showed the equality of variance [42, p. 64; 46, p. 72, p. 75].
The results of a one-way ANOVA confirmed a statistically significant difference did not exist among the three voices [F (2, 62) = 0.15, p = .87, η2 = .01], at a p < .05 level. The results of multiple-comparison of TURKEY’s Honestly Significant Difference Test (HSD) revealed that there was no statistically significant difference between the following when listened to by the participants: (1) British and American English, (2) American and TTS English, and (3) TTS and British English. The effect size was η2 = .01, which is small.7 Because the effect size was small, at .01, no difference was shown for the high school students in this study when listening to the three types of voice. This also showed that the three types of voice have equal quality when viewed as pedagogical tools for high school students with beginner-level English proficiency. None of the students realized (on the basis of their comments) that the TTS sounds were artificially synthesized voice/machinelike speech.
As noted above, the TTS sounds in this study were artificially synthesized from an audio database of native speakers of American English. Many Japanese high school EFL students learn English by listening to American English speech sounds on English audio CDs accompanying their English textbooks in Japanese high schools [10]; they are therefore more used to listening to American English than other varieties. This seems to be reflected in students’ listening comprehension scores. The results indicated that TTS sounds in this study were of an appropriate level and sufficient audio quality for use as listening materials for Japanese high school EFL students in the high school.

5. Conclusions

This study focused on speech perception by Japanese high school students.
The research question in this study was as follows:
RQ: Is there a difference in the scores on the listening test among the three voices?
Concerning Research Question, the results showed that the American English voice received the highest score in the listening test; however, there was no statistically significant difference among the three voices (see section 4).
[39] revealed that speech perception by humans showed a half-value in pitch, which implies that human speech perception is not accurate and yields different results in an acoustic analysis by a speech analyzer. The results of acoustic analyses by the speech analyzer (see Tables 2, 3, 4, and 5) showed that the pitch ranges of TTS English were narrower than those for the two other voices (British and American English). However, the results statistically showed that participants did not experience any speech perception gap between human English speech sounds and TTS English speech sounds. The participants did not realize that the TTS English voice was artificially generated by a computer, which matches/conforms the results of previous TTS studies of speech perception [3; 11, 12; 15]. This implies that TTS sounds are usable as English audio language learning materials for Japanese EFL learners, including high school students.
It is hoped that the findings in this study will encourage more English teachers in Japanese high schools to use TTS sounds in order to create audio materials for high school EFL education in Japan.

ACKNOWLEDEMENTS

The author gratefully acknowledges the cooperation and support of the high school teachers and students to take time for this study.

Notes

1. Users could be purchased Kate 16 kHz Voice produced by NeoSpeech through TTS selling agent NextUp.com [34]. As of 2018, they can buy various kinds of TTS voices there. Please refer to [23] for details.
2. The Copyright Law (Chosakukenhou) [2] Revision Act of January 1, 2004 revised Article 35 of the Copyright Law to expand the scope for replication of materials in schools and other educational institutions, by making it possible to do so without permission from copyright holders/owners. Under the Copyright Law, Article 35, the author used a British English voice and an American English voice from “the Japan Times ST” website for This study. Please refer to the revised Article 35 [4; 5] for details.
3. [39, p. 188] defined the MEL scale as a perception scale of pitch judged by listeners. MEL was taken from the root of the word melody.
4. Differences of duration between English proverbs were calculated by the following math formula [longest duration minus (−) shortest duration equals (=) difference of duration]. For example, the differences of duration in English proverb No. 1 (see Table 2) were calculated by the following math formula [2. 51 – 2.06 = 0.45].
5. The students in the high school did not take English tests like the EIKEN Test in Practical English Proficiency (EIKEN), Global Test of English Communication (GTEC), Shinken Moshi, and Test of English for International Communication (TOEIC). In order to assess students’ English proficiency, they were asked to take a selected test from the first stage of EIKEN Grade Pre-2 test (one of the most popular English proficiency tests held in Japan).
6. [32, p. 23] states that Cronbach’s α should be over .80 on a language test and over .70 on a psychological assessment like a questionnaire.
7. Based on [33, p. 62; 43, p. 353], the author interprets the effect size in the one-way ANOVA as follows: Effect size η2 = .01, small (S); η2 = .06, medium (M); η2 = .14, large (L).

References

[1]  Abe, K., Ozawa, K., Suzuki, Y., & Sone, T. (2006). Comparison of the effects of verbal versus visual information about sound sources on the perception of environmental sounds. ACTA Acustica United with Acustica, 92, 51–60.
[2]  Agency for Cultural Affairs, Government of Japan. (1970). Chosakukenhou dai 35 jou (Copyright Law, Article 35). Retrieved from http://law.e-gov.go.jp/htmldata/S45/S45HO048.html.
[3]  Azuma, J. (2008). Applying TTS technology to foreign language teaching. In F. Zhang & B. Barber (Eds.), Handbook of research on computer-enhanced language acquisition and learning (pp. 497506). New York: Information Science Reference.
[4]  Chosakukenhou dai 35 jou gaidorain kyougikai. (2004). Gakkou sonotano kyouikukikannniokeru chosakubutsuno hukuseini kansuru cyosakukenhou dai 35 jou gaidorain (Copyright Law Article 35 guidelines for duplication of work in schools and other educational institutions). Retrieved from http://www.jbpa.or.jp/pdf/guideline/act_article35_guideline.pdf.
[5]  Copyright Law Department, Agency for Cultural Affairs, Government of Japan. (2015). Gakkouni okeru kyouikukatudouto chosakuken (Educational activities in schools and copyright). Retrieved from http://www.bunka.go.jp/seisaku/chosakuken/seidokaisetsu/pdf/gakko_chosakuken.pdf.
[6]  Eiken Foundation of Japan. (2016a). Kaku kyuu no meyasu (Standard of each grade). Retrieved from http://www.eiken.or.jp/eiken/exam/about/.
[7]  Eiken Foundation of Japan. (2016b). 2016 nendo karano atarasii gouhi hantei houhou ni tuite (A new gideline for admission criteria starting from fiscal year of 2016). Retrieved from https://www.eiken.or.jp/eiken/exam/2016admission.html.
[8]  Eiken Foundation of Japan. (2017). About EIKEN Grade Pre-2. Retrieved from http://www.eiken.or.jp/eiken/en/grades/grade_p2/.
[9]  Halliday, M. A. K., & Greaves, W. S. (2008). Intonation in the grammar of English. London: Equinox.
[10]  Hanamoto, H. (2010). How do the stereotypes about varieties of English relate to language attitude?: a quantitative and qualitative study of Japanese university students. The Japanese Journal of Language in Society, 12 (2), pp. 18–38.
[11]  Harashima, H. (2006a). Review of “VoiceText.” Electronic Journal of Foreign Language Teaching, 3 (1), 131–135. Retrieved from http://e-flt.nus.edu.sg/v3n12006/rev_harashima.pdf.
[12]  Harashima, H. (2006b). Onsei gousei ni yoru eigo risuningu sozai no sakusei (Creating English listening materials using speech synthesis). Proceedings of the 22nd Annual Conference of Japan Society for Educational Technology, 789–790.
[13]  Hatori, H. (1977). Eigokyouiku no shinrigaku (Psychology of teaching English). Tokyo: Taishuukanshoten.
[14]  Ishikawa, K. (2005). Kotobato shinri (Language and psychology). Tokyo: Kuroshiosyuppan.
[15]  Jones, C., Berry, L., & Stevens, C. (2007). Synthesized speech intelligibility and persuasion: Speech rate and non-native listeners. Computer Speech and Language, 21, 641–651.
[16]  Kadota, S. (2006). Dai ni gengo rikai no ninchi mecanizumu (Reading and phonological processes in English as a second language). Tokyo: Kuroshio Syuppan.
[17]  Kadota, S. (2012). Syadouingu ondokuto eigosyuutokuno kagaku (Science for shadowing RA and English acquisition). Tokyo: Cosmopier.
[18]  Kadota, S. (2015). Syadouingu ondokuto to eigo komyunikeisyon no (Science for shadowing RA and English communication). Tokyo: Cosmopier.
[19]  Kataoka, H. (2007). The study of memory: Retention of English and Japanese proverbs (Unpublished master’s thesis). Graduate School of Foreign Language Education and Research, Kansai University: Osaka.
[20]  Kataoka, H. (2009). Text-To-Speech (TTS) synthesis technology wo katsuyoushita eigo kyouikukyouzai no kaihatsu to nihonjin no onseininshiki (The use of Text-To-Speech (TTS) synthesis technology for English education: Speech recognition of Japanese EFL learners). Journal of Kansai University Graduate School of Foreign Language Education and Research, 7, 1–33.
[21]  Kataoka, H., & Ito, M. (2013). A comparative study on reading aloud: Instruction by Text-To-Speech synthesis sounds and a high school Japanese English teacher. THE JASEC BULLETIN, 22 (1), 39–54.
[22]  Kataoka, H., Ito, M. & Yamane, S. (2015). Retention of English sentences learned by reading aloud using Text-To-Speech (TTS) speech sounds: A longitudinal study in a Japanese high school. International Journal of Research Studies in Educational Technology, 5 (1), 29–47. DOI: 10.5861/ijrset.2015.1331.
[23]  Kataoka, H. (2018). Producing English speech sounds by Text-To=Speech tecnology for English as a foreign language education in Japan. International Journal of Education and Socia Science Redearch, 1 (2), pp. 34–48.
[24]  Kent, R. D., & Read, C. (2002). The Acoustic analysis of speech (2nd ed.). New York: Singular Pub Group. (T. Arai, T. Sugawara, Trans.). (1996). The Acoustic analysis of speech (Onsei no Onkyoubunseki). Tokyo: Kaibundo Publishing Co., Ltd.
[25]  Kido, H., & Kasuya, H. (1999). Tsuujou hatsuwa no seishitsu ni kanren shita nichijou hyougengo no chuushutsu (Extraction of everyday expression associated with voice quality of normal utterance). The Journal of the Acoustical Society of Japan, 55 (6), 405–411.
[26]  Kohno, M. (1984). Eigojugyou no kaizou (Remodeling of English language lessons). Tokyo: Tokyoshoseki.
[27]  Komatsu, M. (2011). Acoustic phonetics (Onkyou onseigaku). In H. Joo, T. Fukumori, & Y. Saito (Eds.), Dictionary of basic phonetic terms (Onseigaku kihon jiten) (pp. 115–122). Tokyo: Bensei Publishing Inc.
[28]  Ladefoged, P. (2003). Phonetic data analysis: An introduction to fieldwork and instrumental techniques. Oxford: Blackwell Publishing.
[29]  Ministry of Education, Culture, Sports, Science and Technology (MEXT). (2015c). Kakusikendantaino deetaa niyoru CEFRtono taisyouhyou (A comparison table of scores among CEFR and other certification association). Retrieved from https://0x9.me/CQsZ6.
[30]  Miyasako, N. (2006) Bumonkousei ondoku shoriteki kenchikarano ondokuno shorontenni kansuru seiri (A critical review of oral reading issues from the componetal processing view of oral reading). Language Education & Technology, 43, 139–159.
[31]  Miyasako, N. (2007). A theoretical and empirical approach to oral reading. Language Education & Technology, 44, 135–154.
[32]  Mizumoto, A. (2012). Sokutei no datousei to sinraisei (Validity and reliability of measurement). In O. Takeuchi & A. Mizumoto (Eds.), Gaikokugo kyouikukenkyuu handobukku (The Handbook of Research in Foreign Language Learning and Teaching) (pp. 17–30). Tokyo: Shohakusya.
[33]  Mizumoto, A., & Takeuchi, O. (2008). Kenkyuuronbun ni okeru koukaryou no houkoku no tamei: Kisoteki gainen to cyuuiten (Basics and considerations for reporting effect sizes in research papers). Studies in English Language Teaching, 31, 57–66.
[34]  NextUp.com. (2018). Get the best voices available for TextAloud 4 on your PC! Retrieved from https://nextup.com/index.html.
[35]  Palmer, H. E. (1921). The principles of language study. In the Institute for Research in Language Teaching (Ed.), The selected writings of Harold E. Palmer: Pāmā senshū, Dai 1 Kan, (1999), (pp. 331–520). Tokyo: Hon-no Tomosha.
[36]  Robinson, D.W., & Dadson, R.S. (1956). A re-determination of the equal-loudness relations for pure tones. British Journal of Applied Physics, 7, 166–181.
[37]  Ryalls, J. (1996). A basic introduction to speech perception. San Diego, CA: Singular Publishing Group. (S. Imatomi, T Arai, T. Sugawara, K. Shintani, Y. Kitagawa, & K. Ishihara, Trans.). (2003). Onsei chikaku no kiso (A basic introduction to speech perception). Tokyo: Kaibundo Publishing Co., Ltd.
[38]  Sonobe, H., Ueda, M., & Yamane, S. (2009). The effects of pronunciation practice with animated materials focusing on English prosody. Language Education & Technology, 46, 41–60.
[39]  Stevens, S. S., Volkman, J., & Newman, E. B. (1937). A scale for the measurement of the psychological magnitude pitch. The Journal of the Acoustical Society of America, 8 (3), 185–190.
[40]  Sugito, M. (1996). Nihonjinno eigo (Japanese English). Osaka: Izumishoin.
[41]  Suzuki, Y., & Takeshima, H. (2004). Equal-loudness-level contours for pure tones. Journal of Acoustical Society of America, 116 (2), 918–933.
[42]  Takeuchi, O. (2012). t kentei nyuumon (Beginning guide to t-test). In O. Takeuchi, & A. Mizumoto (Eds.). Gaikokugo kyouikukenkyuu handobukku (The handbook of research in foreign language learning and teaching). (pp.62–70). Tokyo: Shohakusha.
[43]  Takeuchi, O., & Mizumoto, A. (Eds.) (2012). Gaikokugo kyouikukenkyuu handobukku (The handbook of research in foreign language learning and teaching). Tokyo: Shohakusha.
[44]  The Japan Times ST. (2007). Eigo to beigo no hatsuon (Brirish and American pronunciation). Retrieved from https://0x9.me/Cjqa8.
[45]  Uchida, T. (2009). Onsei no inritsuteki tokuchou to washa no personality inshou no kankeisei (Proposing the prospect model: Relationship between the prosodic features of speech sound and the personality impressions). Journal of the Phonetic Society of Japan, 13 (1), 17–28.
[46]  Yamanishi, H. (2012). Bunsanbunsekinyuumon (Beginning guide to analysis of variance; ANOVA). In O. Takeuchi, & A. Mizumoto (Eds.). Gaikokugo kyouikukenkyuu handobukku (The handbook of research in foreign language learning and teaching). (pp.71–82). Tokyo: Shohakusha.