Qazi U. Farooq1, Muhammad Tayyab Naqash2
1Program Coordinator and Assistant Professor, Department of Civil Engineering, Islamic University of Madinah, Saudi Arabia
2Coordinator of Quality and Assistant Professor, Department of Civil Engineering, Islamic University of Madinah, Saudi Arabia
Correspondence to: Muhammad Tayyab Naqash, Coordinator of Quality and Assistant Professor, Department of Civil Engineering, Islamic University of Madinah, Saudi Arabia.
| Email: |  |
Copyright © 2018 The Author(s). Published by Scientific & Academic Publishing.
This work is licensed under the Creative Commons Attribution International License (CC BY).
http://creativecommons.org/licenses/by/4.0/

Abstract
Outcome based education model is gaining popularity in engineering education. The proper assessment of course learning outcomes (CLOs) is a backbone of this model. In this study the CLOs are numerically assessed by three different methods EMAU approach, weighted average and simple arithmetic mean. The assessment matrix was same for all three methods. Three Specific CLOs for two different courses were studied. Two different levels reinforce (Soil Mechanics with laboratory) and an introductory (Statics theory course) from civil engineering program have been selected for three consecutive terms in a developing engineering institute. This concludes six cases of CLO assessment. The courses were taught by the same instructors (Authors) for the studied terms. Their performance has been compared. The term wise progress of each CLO has also been addressed. It is revealed form the results, that the weighted average method is most sustainable for the engineering education processes due to its simplicity and proper coverage. The conclusion of the study is expected to assist engineering and other faculty members to have better indulgent of the outcome based engineering education processes.
Keywords:
Outcome based Education (OBE), Course learning outcomes (CLOs), Weighting factors, Engineering Education, Course learning Levels, Numerical Assessment
Cite this paper: Qazi U. Farooq, Muhammad Tayyab Naqash, Comparison of Numerical Assessment and Periodic Progress of Specific Course Learning Outcomes for Introductory and Reinforce Level Engineering Courses, Education, Vol. 8 No. 3, 2018, pp. 42-47. doi: 10.5923/j.edu.20180803.02.
1. Introduction
Outcome Based Education (OBE) model is current scenario of engineering education. Several global and regional accreditation agencies such as Accreditation Board of Engineering Technology (ABET) [1], International Engineering Alliance (IEA) [2], Washington Accord [3], Bologna Process [4], National Commission of Academic Accreditation and Assessment (NCAAA) [5] and Middle States Commission of Higher Education (MSCHE) [6] appreciate academic institutes to adopt OBE system. The system is focus of approximately all engineering programs in the Kingdom of Saudi Arabia. Therefore, the assessment of course learning outcomes, performance indicators and student outcomes at the program level has been a contemporary topic of international interest. The system requires a comprehensive method of assessment and continuous quality enhancement and improvement at the program level in engineering education. These factors are also been set as the requirement of different accreditation agencies [7-9]. The OBE model requires the attainment of different student’s outcome at the program level these are linked to the CLOs at the course level. The assessments of the CLOs are required at the course level and it is a backbone of the OBE model [10].In the Civil Engineering Program at the Faculty of Engineering the CLOs are assessed directly using the performance of students through collection of data (e.g. Quizzes, Home works, Exams, Lab experiments, Reports, Term papers, course projects and presentations assessment skills/knowledge/behavior of students etc.) in Performance Indicators (PIs). The PIs are specific learning outcomes which defines the key performance for each Course Outcomes (COs). Student Outcomes are assessed directly by using the assessment of course specific PIs one for each CO. Therefore, specific PIs for each course are assessed directly using the performance of students [11, 12].Educational researchers come up with basic solutions for assessing and evaluating the CLOs through Performance Indicators (PIs) but very few examples are available on the analyses of real time data. Therefore, the end users i.e. the faculty members, most of the time find it difficult to incorporate the model during the educational process. This paper shed some lights and provides some critics with their pros and cons for the different existing methodologies of numerical assessment. The EMAU approach, weighted average and simple arithmetic mean are considered for comparison purpose. Three Specific CLOs for two different courses were studied for two different levels reinforce (Soil Mechanics with laboratory) and an introductory (Statics theory course) from civil engineering program. Data obtained from the three consecutive terms in a developing engineering institute is analyzed. Altogether six cases of CLO assessment were analyzed carefully. The data obtained from two different courses were taught by the same instructors (Authors) for the studied terms. The term wise progress of each CLO has also been addressed. It is revealed form the results, that the weighted average method is most sustainable for the engineering education processes due to its simplicity and proper coverage. The conclusion of the study is expected to assist engineering and other faculty members to have better understanding of the outcome based engineering education processes [11, 13, 14].
2. Predicament and Objectives
OBE is a complicated model and requires a numerical value for each CLO. The numerical assessment procedure CLO is itself very complex and is not fully understand by several faculty members particularly those who use software embedded models. The authors, throughout their administrative role, receive several complains even from senior faculty members about the difficulty of the assessment process. An effort has been made in this research to clearly explain and compare three different numerical assessment methods for course learning outcomes. The research outcome are useful for the faculty members to adopt the most suitable, simple and reliable method of CLO assessment. The faculty members using embedded software can also use the research results to countercheck the measurement and reliability of their model.
3. Course and CLO Selection
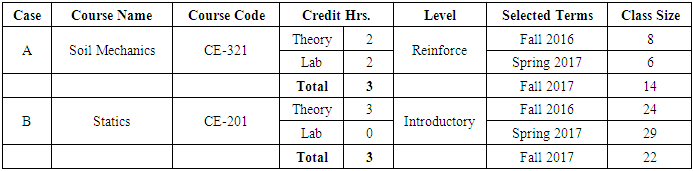
Soil Mechanics and Statics are core civil engineering courses which can be found in almost all civil engineering degree plans around the globe. Since the course topics and outcomes differ from faculty to faculty, therefore, the most likely outcomes which any instructor will cover are selected. In order to protect the intellectual property rights, only three learning outcomes for each course have been selected. One reinforced and one introductory level course from civil engineering program has been assessed in this case study. Due to higher proportion of research, design and versatility it was not possible to generalize mastery level courses and are not considered in this study. Courses were taught by same instructors (authors) in three consecutive regular terms. The detail information about the courses such as course name, code, credit hours, course learning level and class size are tabulated in Table 1. Whereas, the selected learning outcomes and assessment matrix for course-A and B are, respectively tabulated in Table 2 and Table 3.Table 1. Selected Courses with code, credit hours, course level, selected terms and class size
 |
| |
|
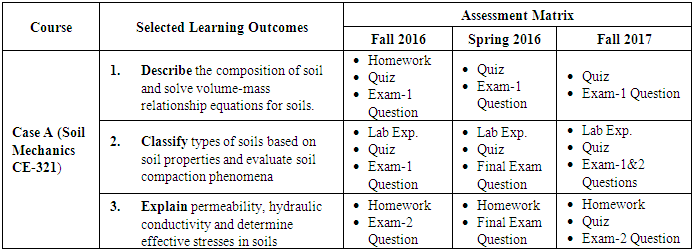
Table 2. Selected Learning outcomes (CLOs) and the corresponding assessment used for different terms for Course A
 |
| |
|
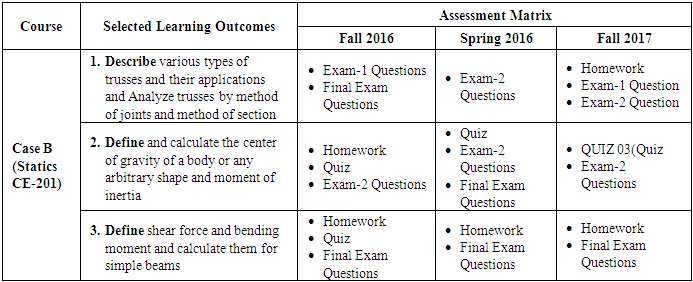
Table 3. Selected Learning outcomes (CLOs) and the corresponding assessment used for different terms for Course B
 |
| |
|
4. CLO Assessments Methodology
4.1. Weighted Average
This methodology is based on weight of each assignment in a final grade. The Learning outcome is assessed based on the following relationship: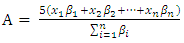 | (1) |
Where A= Assessment score of CLO on the scale of 5x = percentage of average class score in an assignment used for CLO assessment (Homework, Quiz, Exam Question etc.)β= weight of the assignment in final grade e.g. 10% etc.n = Number of assignments used for the assessment of the CLO.For example a certain CLO has been assessed by using a Home work and final exam question. The homework weighs only 1% whereas Final Exam Question has 8% weightage in the final grade. The percentage of class average scores in homework and final exam question are 80 and 60 respectively.In that case: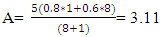
4.2. Arithmetic Mean (A.M.)
This is the most simple calculation for the CLO assessment in this method all assignment were given equal weight regardless of their weightage in final grade. It is calculated as follows: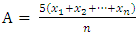 | (2) |
Where A= Assessment score of CLO on the scale of 5.x = percentage of average class score in an assignment used for CLO assessment (Homework, Quiz, Exam Question etc.)n = Number of assignments used for the assessment of the CLO.For the above example the CLO assessment result will be: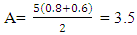
4.3. EAMU Vector
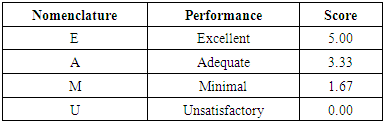
EAMU is a student centered approach, in this method the students for each assessment are divided in to four groups: Excellent (E) is scoring 90% or more, Adequate (A) is 75 to 89.9%, Minimal (M) is 60 to 74.9%, and Unsatisfactory (U) less than 60%. In this study EvalTools® 6 Assignment Setup Module has been used EvalTools® 6 removes students who received denial or F grade in a course from EAMU vector calculations, and enters student scores on the selected assignments, questions for remaining students. EvalTools® 6 calculates for each student the weighted average percentage on the assessments, set of questions selected by faculty. Weights are set according to the product of their percentage in the course grading scale and multiplication factor based on the course format and entered in the weighting factor section of the Assignment Setup Module. EvalTools® 6 uses the average percentage to determine how many students fall into the EAMU EvalTools® 6 calculates the EAMU average rating by rescaling to 5 for a weighted average based on a 3 point scale. Mathematically the model can be expressed as follows [15]: | (3) |
For the rationale for developing a standardized assessment template in the civil engineering program is: a) To classify four kinds of course formatsi. Courses without labs and without project/term paperii. Courses without labs and with project/term paperiii. Courses with labs and without project/term paperiv. Courses with labs and with project/term paperb) To classify assessments as initial, culminating, complex etc. and emphasize major assessment components that are holistic and the true reflection of actual students learning involving 3 domains of learning: cognitive, psychomotor and affective.c) To develop appropriate weighting factors for different assessments in various course formats to accurately reflect combination of grading scale and level of learning.WF (Assessment X) = Grading Scale % (Assessment X) x Multiplication Factor (Assessment X)Table 4. Description of EAMU vector and respective scores
 |
| |
|
5. Numerical Comparison and Discussion
In this section, the assessment scores for all considered CLOs measured by above mentioned methods are plotted. Each group in the plot represents an outcome of a unique CLO by three different methods.Figure 1 shows the comparison of the CLOs for fall 2016 for both Case A and Case B. In both cases the EMAU results for CLO-1 which represents skills related to basic concepts was lower than those of weighted average and arithmetic mean. The second CLO shows almost similar result with the three methods whereas, In case of advanced CLO-3 the EMAU results are once again lower. The results of CLO-3 in statics (case-B) are differ more than the soil mechanics (case –A) results.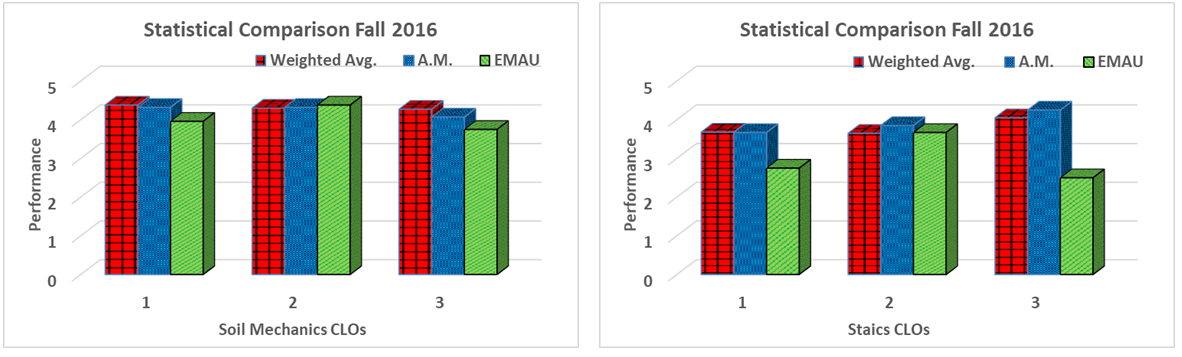 | Figure 1. Statistical Comparison of CLOs Performance Fall 2016 Case-A (Left) and Case-B (Right) |
As far as the comparison of assessment methods is concerned almost same scenario is repeated in spring 2017 term data. Figure 2 shows the comparison of the CLOs for this term. Generally speaking the EMAU results were lower bound than those of weighted average and arithmetic mean except for CLO-2 incase A and CLO-3 in case B where EAMU results were better than other two methods.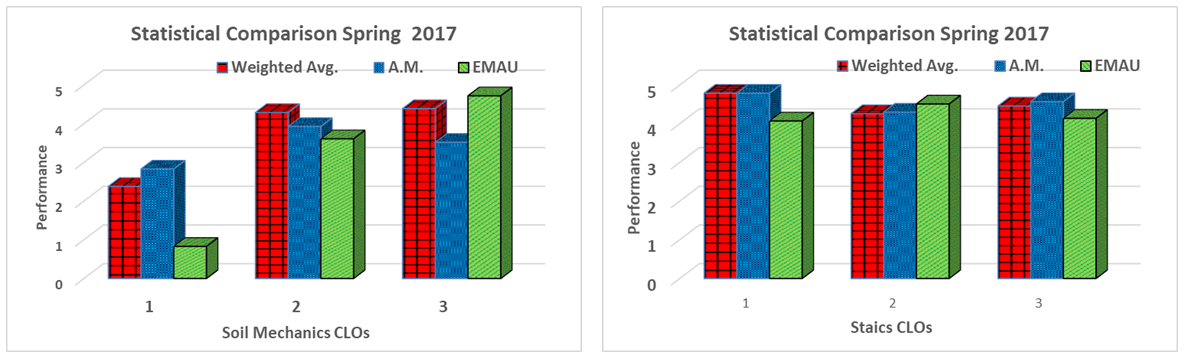 | Figure 2. Statistical Comparison of CLOs Performance Spring 2017 Case-A (Left) and Case-B (Right) |
The EMAU result for fall 2017 term were lower than weighted average and A.M in five out of six cases and it is almost equal to the other two methods in the exceptional case i.e. CLO-2 for case-B. The results for fall 2017 term are expressed in Figure 3.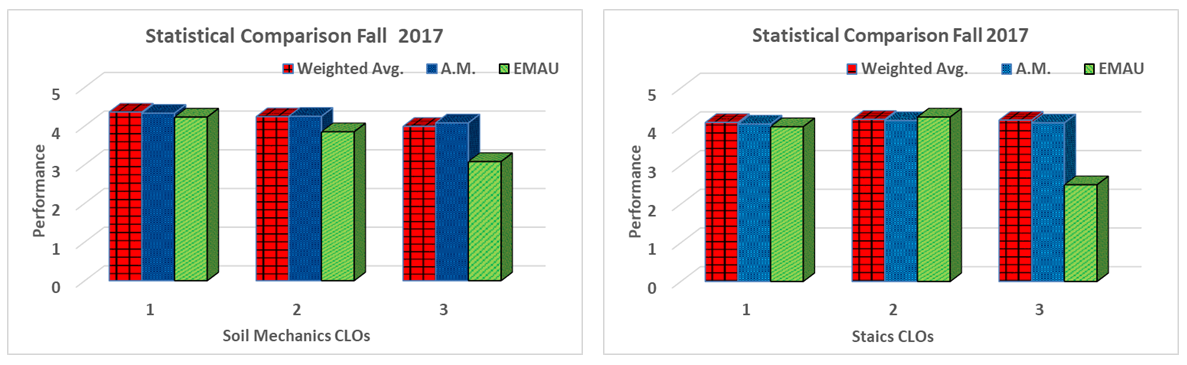 | Figure 3. Statistical Comparison of CLOs Performance Fall 2017 Case-A (Left) and Case-B (Right) |
In most of the above cases the numerical results for Arithmetic mean and weighted average are at par with each other.
6. Periodic Progress (Term Wise Progress)
In the following section, term wise periodic comparison is graphically expressed for the three methods that were incorporated for the CLOs assessment. Since term wise progress depends on many factors such as class size, way of teaching etc. In this study the course syllabus, instructors, teaching facilities and learning tools were similar. Therefore, only the class performance is reflected in term wise progress comparison.In this segment each figure represents the results of a unique CLO. Figure 4 shows the term wise progress of CLO-1 for both Case-A and Case- B. The CLO-1 for soil mechanics (Case-A) shows poor performance in spring 2017, however, the results improve in the next term. Since the class size (Table-1) was exceptionally small and even the performance of single student can disrupt the class results. Although all the assessments methods reflect the same results the EMAU results were lowest. The results for CLO-1 in statics (case-B) were better in spring 2017 as compared to other two terms. The EMAU method reflects the lowest output.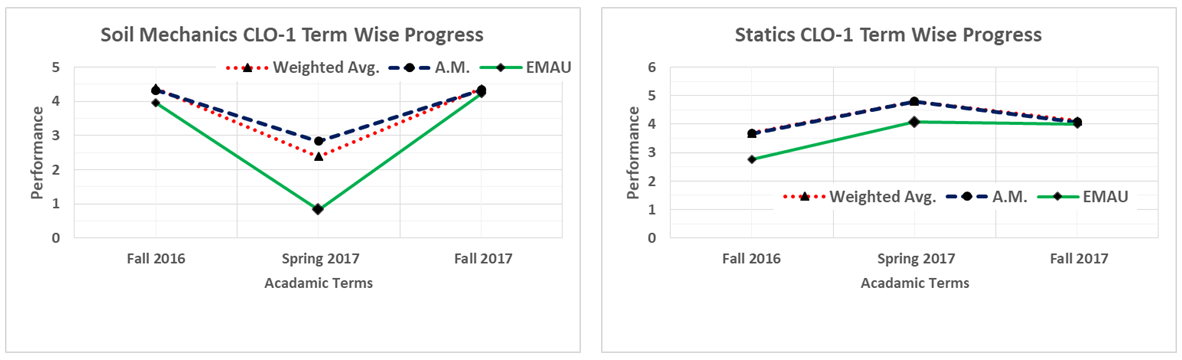 | Figure 4. Periodic Progress of CLO-1 Case-A (Left) and Case-B (Right) |
The term wise progress of CLO-2 in both cases has marginal variation. The EMAU result of CLO-2 for case-A can be seen separately on the lower side. Figure 5 shows the comparison of the CLO-2 for both Case A and Case B.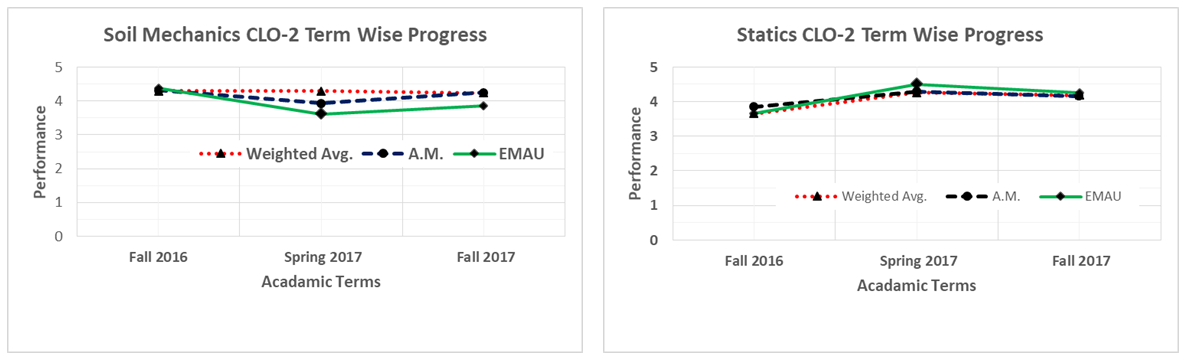 | Figure 5. Periodic Progress of CLO-2 Case-A (Left) and Case-B (Right) |
Figure 6 shows the term wise progress of CLO-3 for both cases. In this occasion the weighted average and arithmetic mean results were similar for all three terms however, EMAU method has revealed a variation in all the cases except spring 2017 in case-B where it is in compromise with other methods.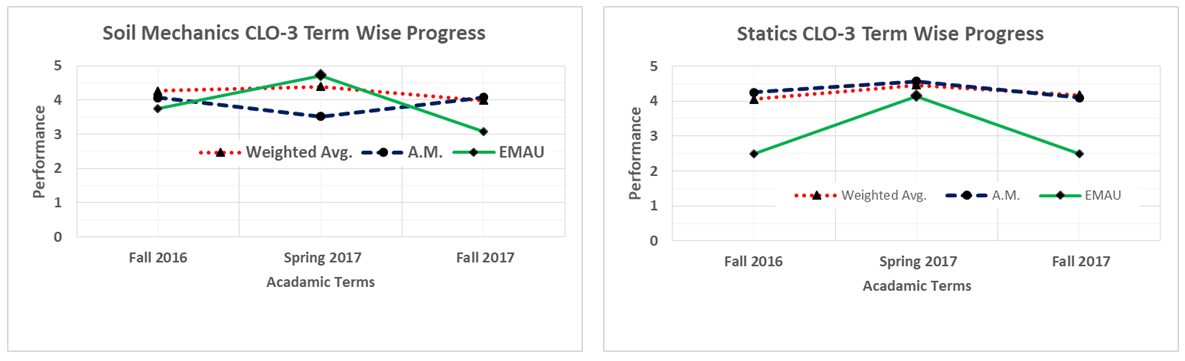 | Figure 6. Periodic Progress of CLO-3 Case-A (Left) and Case-B (Right) |
7. Conclusions
1. The EMAU approach for CLO assessment generally reflects lower numerical scores in most of the cases as compared to the weighted average and arithmetic mean methods. The reason behind this consequence is ignoring all those students who score below 60% in a single assessment. It has been universally observed by most of the faculty members in their teaching career that sometimes even exceptional students score below 60% in few assessments; however they ended up with maximum grades. 2. Despite different portion of each assessment in final grade, the weighted average and arithmetic mean method results were quite similar. Since CLO results were mostly required for the group of students these two methods includes the data for all the students without exception of failure and dropouts. 3. The calculation of EMAU vector is slightly complex and the understanding of the process can be difficult for the new and very senior faculty members particularly from humanities courses.4. The EMAU approach is appreciated if the accreditation body requires students to sub-group as per their academic performance. The weighted average method is the most convenient and dependable technique for the numerical assessment of course learning outcomes. The method is simple and accurately considered the proportions of all assessment tools. The arithmetic mean method does not have proportions for each assessment tools. Whereas, the EAMU vector approach is complicated and extremely time consuming if assessed manually. The weighted average method can also be used to check the software embedded EAMU results.This case study is focused on a newly developed program which has small to medium class size the results may differ for larger student groups.
References
| [1] | ABET. (2018). Accreditation | ABET. Available: http://www.abet.org/accreditation/. |
| [2] | IEA. (2018). International Engineering Alliance. Available: http://www.ieagreements.org/. |
| [3] | W. Accord. (2018). International Engineering Alliance. Available: http://www.ieagreements.org/accords/washington/. |
| [4] | Bologna Process. (2018). The Bologna Process and the European Higher Education Area - Education and training - European Commission. Available: http://ec.europa.eu/education/policy/higher-education/bologna-process_en. |
| [5] | NCAAA. (2018). The National Commission for Academic Accreditation and Assessment. Available: https://www.ncaaa.org.sa/en/Pages/default.aspx. |
| [6] | MSCHE. (2018). Middle States Commission on Higher Education. Available: https://www.msche.org/. |
| [7] | L. Goff, et al., "Learning outcomes assessment a practitioner's handbook," 2015. |
| [8] | K. Trigwell and M. Prosser, "Improving the quality of student learning: the influence of learning context and student approaches to learning on learning outcomes," Higher education, vol. 22, pp. 251-266, 1991. |
| [9] | R. M. Felder and R. Brent, "Designing and teaching courses to satisfy the ABET engineering criteria," Journal of Engineering Education, vol. 92, pp. 7-25, 2003. |
| [10] | B. Olds and R. Miller, "Performance Assessment Of Ec 2000 Student Outcomes In The Unit Operations Laboratory," in 1999 Annual Conference, 1999, pp. 4.417. 1-4.417. 12. |
| [11] | M. W. Hussain, "Specific, Generic Performance Indicators and Their Rubrics for the Compre-hensive Measurement of ABET Student Outcomes." |
| [12] | C. J. Heinrich, "Outcomes–based performance management in the public sector: implications for government accountability and effectiveness," Public administration review, vol. 62, pp. 712-725, 2002. |
| [13] | C. Liu and L.-M. Chen, "Selective and objective assessment calculation and automation," in Proceedings of the 50th Annual Southeast Regional Conference, 2012, pp. 192-196. |
| [14] | J. K. Estell, et al., "Improving upon best practices: FCAR 2.0," in 2012 ASEE Annual Conference & Exposition, 2012, pp. 25.755. 1-25.755. 47. |
| [15] | EAMU Vector Calculation, "EAMU Vector Calculation | Faculty of Engineering," 2018. |

 Abstract
 Reference
 Full-Text PDF
 Full-text HTML