Mahtab Shirazi
Department of Industrial Management, Faculty of Management, University of Science and Culture, Tehran, Iran
Correspondence to: Mahtab Shirazi, Department of Industrial Management, Faculty of Management, University of Science and Culture, Tehran, Iran.
| Email: |  |
Copyright © 2017 Scientific & Academic Publishing. All Rights Reserved.
This work is licensed under the Creative Commons Attribution International License (CC BY).
http://creativecommons.org/licenses/by/4.0/

Abstract
The main goal of this research is to identify the factors affecting the academic satisfaction of students and the degree of this satisfaction. It is believed that academic satisfaction is one of the important factors for the academic progress of students and their willingness and motivation to continue their studies that will ultimately affect their future career. The population in this study in particular includes the students of industrial management of the University of Science and Technology, which is one of the Iranian public universities, and considered the students from 2014 to 2016. A questionnaire was given to a group of students, male and female, based on the Morgan table given number and was answered accordingly. Based on this, the degree of satisfaction and the factors affecting it were investigated and identified. Item analysis method was used to calculate satisfaction dimensions and the correlation between items was calculated with total scores of each dimension and the result of Cronbach’s alpha was also shown. The result of the confirmatory factor analysis also showed that each of the six dimensions has a high validity in determining students’ academic satisfaction. Finally, after investigating the students’ satisfaction, the main causes of their dissatisfaction were identified and appropriate solutions are presented to the students’ condition.
Keywords:
Academic Satisfaction, Dissatisfaction, Effective Factors
Cite this paper: Mahtab Shirazi, Student Satisfaction Analysis and Its Factors (2014 to 2016), Education, Vol. 7 No. 4, 2017, pp. 71-81. doi: 10.5923/j.edu.20170704.03.
1. Introduction
Universities are important, effective and worthwhile institutions that are a pivotal element in the ever-increasing advancement of a society. This organization can be considered as one of the fundamental pillars of the country’s development. This institution is actually a producer of research and education. In the same vein, satisfaction with this institution should be taken seriously. We know that teenagers have been endeavouring for years to enter the university environment and achieve their ambitions and cultivate their talents in their chosen field. In this regard, it is necessary to take the necessary measures to create the satisfaction of these individuals who have made every effort to achieve this aim. Because in this case, it can be expected that these students will be more committed to work, life, and others after graduation, because this commitment can prevent issues such as lying at work (in the future), lack of commitment to work, committing corruption, just to name a few. According to studies of Artino, A. R. (2007), Bolliger, D. U. & Martindale, T. (2004), Sahin, I. (2007), Reinhart, J. & Schneider, P. (2001), there is a significant relationship between academic satisfaction with elements such as student interactions with each other and their faculty members, types of material and spiritual support, student freedom, quality of educational technology, and student self-efficacy. To this end, one can point to the Theory of Conscientiousness that believes that satisfaction in one part of life has positive impact on the other aspect of one`s life. For example, in this research, when students are satisfied with their studies, they will be satisfied with other areas of cultural and political life. On this basis, according to Deshields, O. W.; Kara, A. & Kaynak, E. (2005), Helgesen, Q. & Nesset, E. (2007) it can be said that since students are considered to be the most important recipients of academic services, continuous investigation of their satisfaction with education to adopt appropriate policies will help not only to advance their academic achievement, but also it will lead to the preservation and survival of the university. Therefore, universities and higher education institutions should strive to create a desirable image not only to help attract/absorb students and help them achieve academic satisfaction but also gain more resources both financial and human.
2. Theoretical Foundation
Definition of gratification from the point of view of sociologists:
2.1. Gratification
The feeling of joy or gratification that a person experiences when he is rewarded or endorsed by others, according to the theory of learning, which is a positive satisfaction is effective in reinforcing a behaviour that is rewarding. Therefore, the likelihood that the person will repeat the same behaviour under similar circumstances in the future increases.The less the gap between the ideal and reality the easier satisfaction is achieved. And the farther the ideal from reality is, the unreachable satisfaction will be.
2.2. Definition of Gratification in Present Study
The finding in this study reaffirms the theory of gratification which is when the gap between expectation and reality is reasonable, satisfaction is attainable. In other words, it gives people a satisfying feeling when their goal is reached in different situations.
2.3. Academic Ssatisfaction Measurement Criteria
Different views are presented regarding the satisfaction measurement criteria. Kuo, Y. C. (2010) believes that the students’ satisfaction reflects how they perceive their learning experiences, so according to research students with satisfactory experiences lead them to continue their studies and increase their survival rate at university. From Chua’s point of view, satisfaction is one of the four key elements for the existence and development of competitive business, so according to Athanassopoulos, A; Gounaris, S. & Stathakopoulos, V. (2001) satisfaction of students will not only keep them loyal to their university, but also encourage them to pursue higher education in that same university. It should be noted that, according to some scholars, there is a relationship between academic satisfaction and the fitness of the physical and social environment of the university. In this regard, Hatcher et al. reported that while there is a positive relationship between the investment dimension on human resources (students) and their academic satisfaction, there is an inverse relationship between academic services such as financial costs and students’ academic satisfaction; therefore, as James, R. (2001) claimed due to the dynamic and flexible relationship between the university environment and students’ academic satisfaction, paying attention to the needs and desires of the students, as the main audiences of the university is important. The role of faculty members and educational groups contributing to academic satisfaction is among other factors for assessing the satisfaction of student. Umbach, P. & Porter, S. (2002) have reported that a group of students who communicate with their professors while carrying out research, compared to other students who don’t have higher academic satisfaction. Based on Kara’s findings, there is a positive and significant relationship between academic experience of students, academic satisfaction and their willingness to stay. In addition, according to Hatcher, Kryter, Prus, and Fitzgrald, there is a relationship between academic satisfaction and the quality of faculty members and opportunities for their creative and scientific improvement.
2.4. Main Components Affecting Academic Satisfaction
1. Having experienced training staff to provide courses; an experienced staff is not only a training specialist, but also a student guide and tutorial guide. According to Gillespie, lack of mastery of educational content is one of the factors that reduce self-esteem in the teacher and having knowledge and experience in teaching the contents is of important characteristics.2. Having mutual respect between professors and student is the second most important factor in academic satisfaction.3. The induction of self-esteem by faculty and authorities in students is the third most influential factor in academic satisfaction. Self-esteem is self-worthiness and contentment in one self; meaning that if professors and relevant authorities use different methods to enhance self-esteem in students, students will feel satisfied with themselves, and their academic satisfaction will increase.
2.5. Methodology
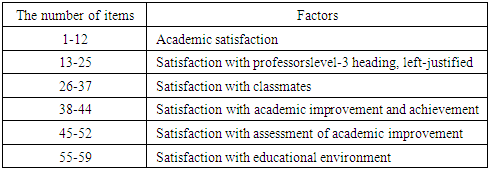
The research community consists of 160 B.A. students enrolled in 2014-2016 academic year studying in Industrial Management. Based on Morgan Table, 113 questionnaires were distributed and completely responded and filled out by them.To investigate and analyse a dataset, the descriptive statistics is first carried out and then analysed. Thus, we do the first part of the descriptive statistics on the present features on the questionnaire and then calculate the questionnaire’s reliability individually and then finally for all questionnaire. To analyse the influence of gender or entrance year on the academic satisfaction, it is essential that we calculate the variables related to each effective factor. That is, we first figure six effective factors (professors, classmates, promotion, academic achievement, development evaluation and academic environment) on the academic satisfaction. According to the available questions for each factor, the score related to reach factor is given by means of major components. Using six factors mentioned, finally, we assess the score of academic satisfaction based on the ideas of each individual. The score of academic satisfaction is based on the answers of each subject to 59 items in the questionnaire. Based on the score of academic satisfaction, in third part, we analyse the effect of gender and entrance year on the academic satisfaction using T-test and ANOVA table.It is worth noting that the mentioned scale had been prepared by a systemic approach inspired by the scale of job design checklist and inductively by the semantic differentiation with five-scale spectrum. To assess the validity of each dimensions using item analysis, the correlation between items and the total score of each dimension. It is worth noting that items related to the six factors in the scale of academic satisfaction are shown in Table 1.Table 1. Number of Items. Related to each Factor of the Degree of Academic Satisfaction
 |
| |
|
2.6. Sample of Questionnaire
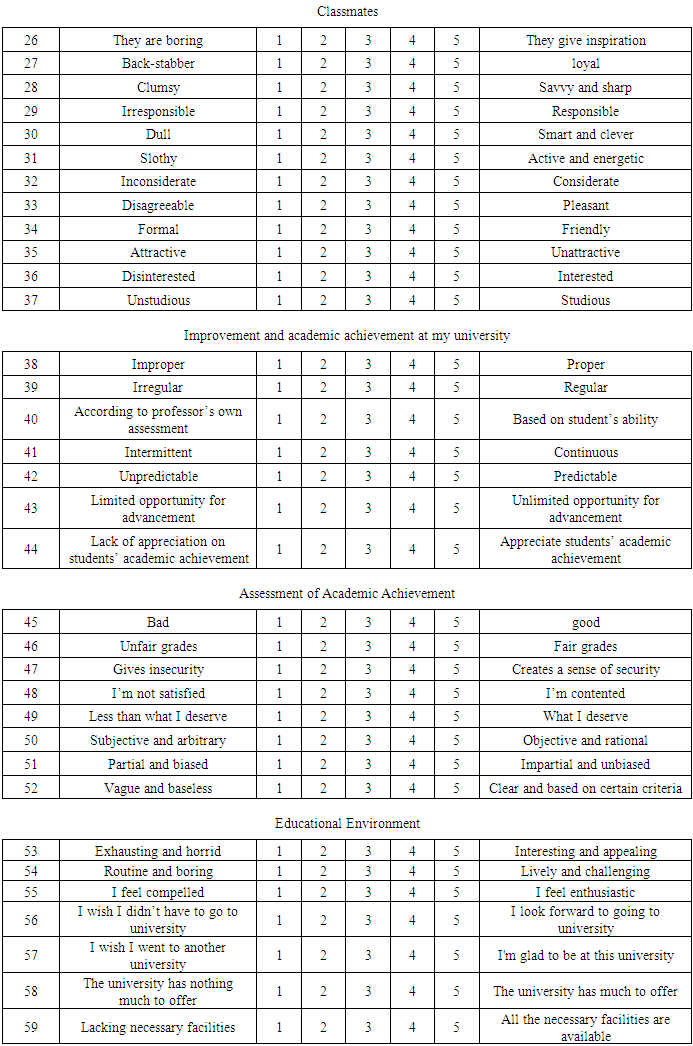
Greetings The questionnaire presented provides a list of six different aspects of student career. Each aspect has a number of criteria. Please read them and circle the number of the opinion you agree with. Thank you for your cooperation.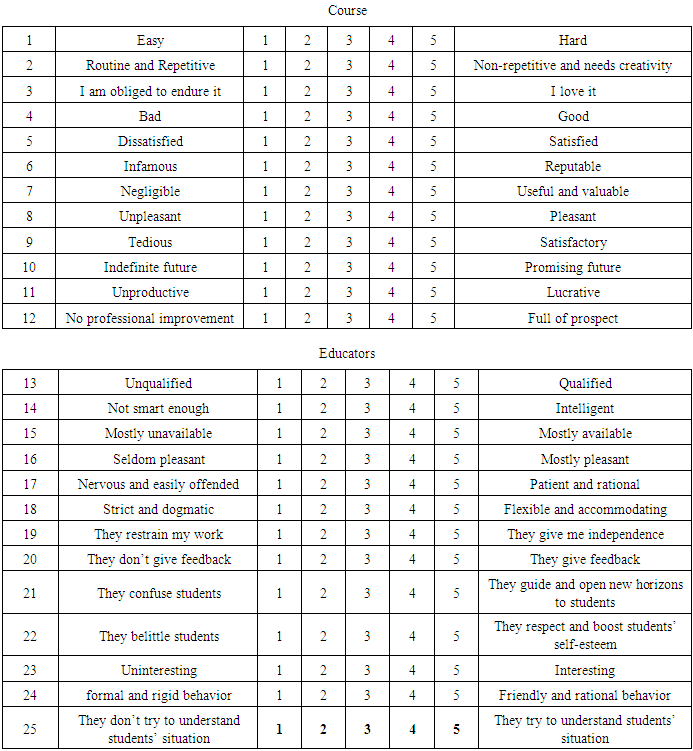
3. Data Analysis
3.1. Reliability
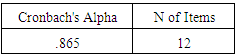
In this section, the reliability of questionnaire questions will be first calculated in each aspect and then the total questionnaire. It should be noted that the reliability of the questions examines whether the respondents' answer change over time. To calculate the reliability value, a coefficient called the alpha Cronbach is used. If the Cronbach's alpha value is greater than 0.75, it can be concluded that the questions are reliable.
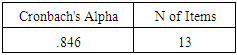
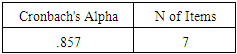
3.1.1. Reliability of the Questionnaire on the Firs Factor
Table 2. Alpha Cronbach's Table
 |
| |
|
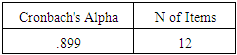
3.1.2. Reliability of the Questionnaire on the Second Factor
Table 3. Alpha Cronbach's Table
 |
| |
|
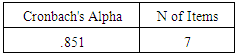
3.1.3. Reliability of the Questionnaire on the Third Factor
Table 4. Alpha Cronbach's Table
 |
| |
|
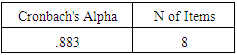
3.1.4. Reliability of the Questionnaire on the Fourth Factor
Table 5. Alpha Cronbach's Table
 |
| |
|
3.1.5. Reliability of the Questionnaire on the Fifth Factor
Table 6. Alpha Cronbach's Table
 |
| |
|
3.1.6. Reliability of the Questionnaire on the Sixth Factor
Table 7. Alpha Cronbach's Table
 |
| |
|
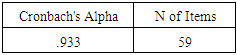
3.1.7. Reliability of the Questionnaire for the Whole Questionnaire
Table 8. Alpha Cronbach's Table
 |
| |
|
Based on the Cronbach alpha value in the above tables, it can be concluded that each of the aspects of the questionnaire and the whole questionnaire are valid.
3.2. Illustration of the Statistics on Gender Attributes
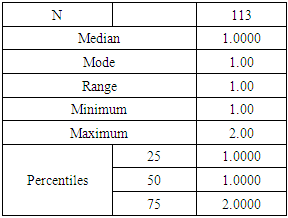
In this section, we present a frequency table and descriptive criteria such as median, mode, minimum and maximum and a pie chart on gender trait.It should be noted that code one is for female and code two is for male.
3.2.1. Criteria of Gender Trait Illustration
Table 9. Gender Descriptive Criteria Table
 |
| |
|
According to Table 9, it can be concluded that the mode of the gender attribute is equal to one which means majority of participants are women.
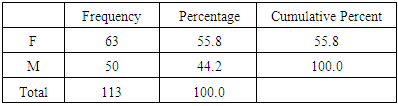
3.2.2. The Frequency Table of Gender Trait
Table 10. Frequency Table of Gender
 |
| |
|
According to Table 10, 55.8% are women and 44.2% are men.
3.2.3. Pie Chart of Gender Trait
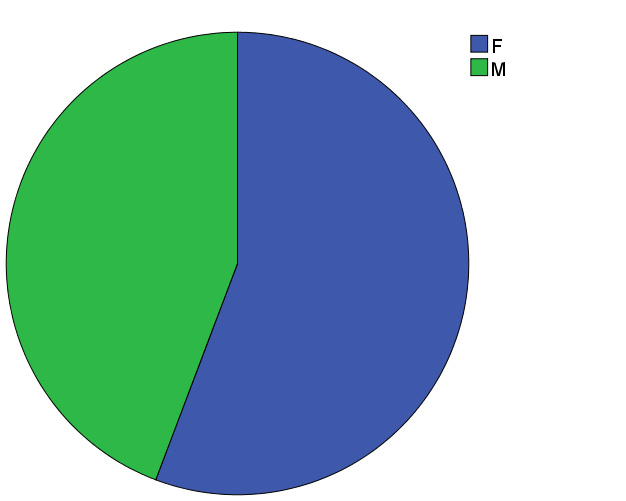 | Figure 1. Pie chart of gender trait |
Based on Figure 1, more participants are women.
3.3. Illustration of Statistics Relating to the Attribute of the Year of Entry
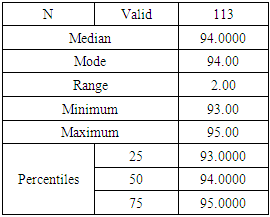
In this section, we present a frequency table and descriptive criteria such as median, mode, minimum and maximum, and a pie chart related to the input of the year. It should be noted that the code for the year 2014 entries is 93, the entries for the year 2015 is 94, and the entries for 2016 is 95.
3.3.1. Illustration of Criteria of the Year of Entry Attribute
Table 11. Table of Descriptive Criteria of the Year of Entry
 |
| |
|
Based on table 11, it can be concluded that the mode of the input year attribute is for the year 2015. That is, the year 2015 experienced more frequency than the other 2 years.
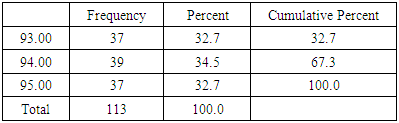
3.3.2. Table of Frequency of the Year of Entry
Table 12. Table of Descriptive Criteria of the Year of Entry
 |
| |
|
Based on Table 12, it can be concluded that 32.7% of the students entered the university in the year 2014, 34.5% entered in 2015 and 32.7% entered in 2016.
3.3.3. Pie Chart of the Year of Entry Attribute
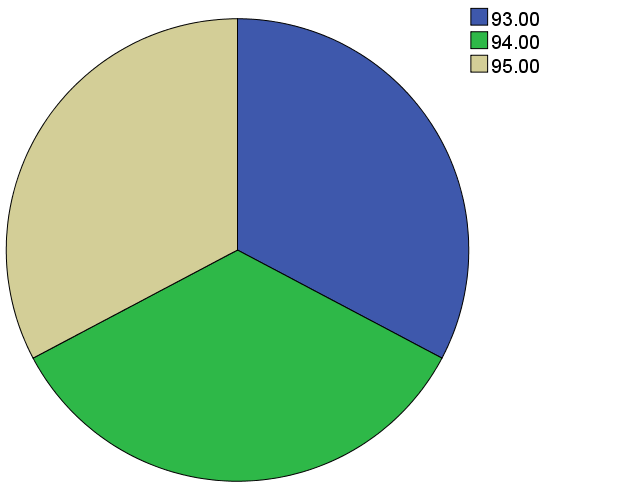 | Figure 2. Pie Chart of the year of entry attribute |
Based on the pie chart Figure 2, it can be concluded that the number of the students in all three years' entries who participated in the survey are approximately the same.
3.4. Calculation of the Variable or the Grades Associated with each Factor
As it was described previously, using the main component method, we compute the students' opinion or students' scores' on each factor as well as the degree of satisfaction.
3.4.1. Calculation of the First Factor (Education)
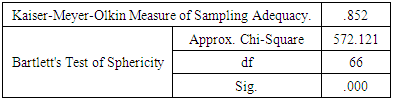
Using the main component method, the impact of each of the question 1 to 12 of the questionnaire was determined based on the scores given on the first aspect that is Education and also the KMO test was used to check whether we were allowed to use the principle method with these questions or not.KMO Bartlett's table H0: Using the principal component method is not suitable for the desired data.H1: Using the principal component method is suitable for the desired data. Table 13. Table of Bartlett test
 |
| |
|
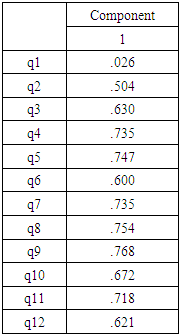
Because the value of the significant level (Sig) is less than 0.05, we therefore reject the hypothesis H0, which means that the principal components can be implemented on the given data.Table 14. The Table Describes the Coefficients of each of the First Aspect Questions Coefficient Table
 |
| |
|
Based on the table in sections 14, it can be concluded that for calculating the score of the first factor, the first question in the coefficient 0.026 multiplied by the second question in the coefficient 0.504, and thus, up to the twelfth question and, finally, the sum considers the values as the score for the first factor.
3.4.2. Calculation of the Second Factor (Educator/Professor)
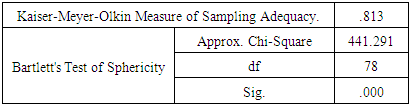
Using the main component method, we determined the impact of each of the questions 13 to 25 combined of the questionnaire in calculating the score of the faculty factor. We also used the KMO test to check whether we were allowed to use the principal component method on these questions.Table of KMO Bartlett:H0: Using the principal component method is not suitable for the desired data.H1: Using the principal component method is suitable for the desired data. Table 15. Table of Bartlett Test
 |
| |
|
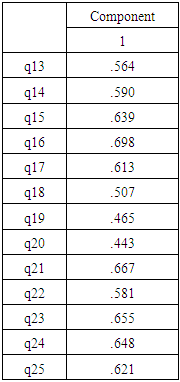
Since the value of the significant level (Sig) is less than 0.05, we therefore reject the hypothesis H0, which means that the principal components can be implemented on the given data.Table of coefficients for each of the second factor questionsTable 16. Coefficient table
 |
| |
|
Based on table 16, we can conclude that for calculating the second factor, the first question with the coefficient of 0.564 multiplied by the second question’s coefficient 0.590, and thus, until the 25th question and finally the total amount is considered as the sum of the second factor.
3.4.3. Third Factor Calculation: (Classmates)
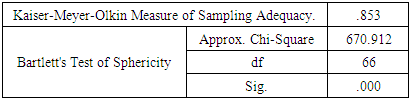
Using the main component method, we determined the impact of each of the questions 26 to 37 combined of the questionnaire in calculating the score of the classmate factor. We also use the KMO test to examine whether we are allowed to use the principal component method on these questions.KMO Bartlett Table:H0: Using the principal component method is not suitable for the desired data.H1: Using the principal component method is suitable for the desired data.Table 17. Bartlett Test Table
 |
| |
|
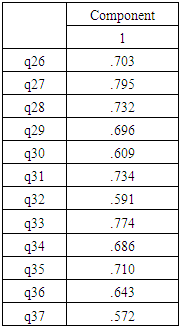
Since the Sig value is less than 0.05, we reject the assumption of H0, which means that the principal component method can be implemented on the given data.Table 18. The table describes the coefficients of each of the third factor questions Coefficient Table
 |
| |
|
According to the table in sections 18, it can be concluded that for calculating the third factor, the first question with the coefficient 0.703 multiplied by the second question with the coefficient 0.795, and thus, up to thirty-seven question and finally the total amount is considered as the sum of the third factor.
3.4.4. Fourth Factor Calculation: (Promotion and Academic Achievement)
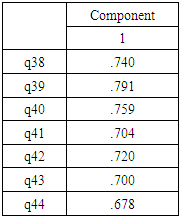
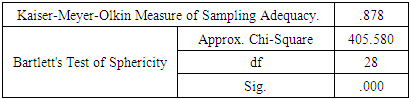
Using the main component method, we determined the impact of each of the questions 38 to 44 combined of the questionnaire in calculating the score of the classmate factor. We also use the KMO test to examine whether we are allowed to use the principal component method on these questions.Table 19. Coefficient Table
 |
| |
|
Based on the table in sections 19, it can be concluded that for calculating the fourth factor, the first question with the coefficient of 0.740 multiplied by the second question with the coefficient of 0.791, and thus, until the forty-four. Finally, the total amount is considered as the sum of the fourth factor.
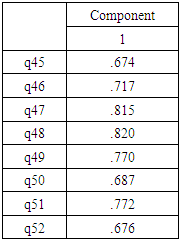
3.4.5. Ffifth Factor Calculation (Assessment of Academic Achievement)
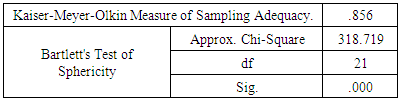
Using the main component method, we determined the effect of each question from 45 to 52 in calculating the academic achievement assessment factor score, which is a combination of questions 45 and 52. We also use the KMO test to examine whether we were allowed to use the principal component method on these questions.KMO Bartlett Table:H0: Using the principal component method is not suitable for the desired data.H1: Using the principal component method is suitable for the desired data. Table 20. Bartlett Test Table
 |
| |
|
Since the Sig value is less than 0.05, we reject the assumption of H0 , which means that the principal component method can be implemented on the given data.Table 21. The Table Illustrates the Coefficients of each of the Fifth Factor Questions Coefficient Table
 |
| |
|
According to the table in sections 21, it can be concluded that to calculate the fifth factor, the first question with the coefficient of 0.674 multiplied by the second question with the coefficient of 0.717, and up to the fifty-two question. Finally, the total sum is considered as the fifth factor.
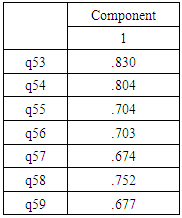
3.4.6. Sixth Factor Calculation (Educational Environment)
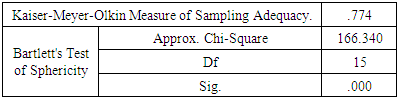
Using the main component method, we determined the effect of each question from 53 to 59 in calculating the academic achievement assessment factor score, which is a combination of questions 53 and 59. We also use the KMO test to examine whether we are allowed to use the principal component method on these questions.KMO Bartlett Table:H0: Using the principal component method is not suitable for the desired data.H1: Using the principal component method is suitable for the desired data.Table 22. Bartlett Test Table
 |
| |
|
Since the Sig value is less than 0.05, we reject the assumption of H0 , which means that the principal component method can be implemented on the given data.Table 23. The Table Illustrates the Coefficients of each of the Sixth Factor Questions Coefficient Table
 |
| |
|
According to the table in sections 22, it can be concluded that to calculate the sixth factor, the first question was multiplied by its corresponding coefficient 0.830. The second question was multiplied by its corresponding coefficient 0.804 and so on. Finally, the total sum is considered as the sixth factor.
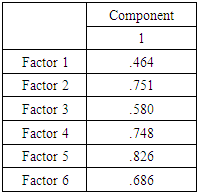
3.5. Variable Calculation or Score Regarding Academic Satisfaction
In this section, the satisfaction score is reached by using the main component on the calculated scores in the six factors above.KMO Bartlett Table:H0: Using the principal component method is not suitable for the desired data.H1: Using the principal component method is suitable for the desired data.Table 24. Bartlett Test Table
 |
| |
|
Since the Sig value is less than 0.05, we reject the assumption of  , which means that the principal component method can be implemented on the given data.
Table 25. Coefficients Table for each Factor Coefficient Table
 |
| |
|
According to the table in sections 25, it can be concluded that to get the academic satisfaction the first factor was multiplied by its corresponding coefficient 0.464. The second factor was multiplied by its corresponding coefficient 0.751, and so on. Finally, the total sum was considered as the Academic Satisfaction score.
3.6. Analysis of Gender on Academic Satisfaction
In this section, to examine the effect of gender on academic satisfaction, a survey on two groups (one female, one male) was done. But first we need to study whether the scoring on Academic Satisfaction is normal or not.
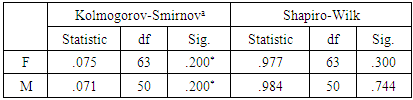
3.6.1. Studying the Normal Score of Academic Satisfaction
H0: data related to the degree of academic satisfaction follow the normal distribution.H1: data does not follow the normal distribution of academic satisfaction.Table 26. Chart of Normality Assessment
 |
| |
|
Since the value of the significant level (Sig) is greater than 0.05, so we can accept the assumption of H0 which means that the data follow the normal distribution and, a T-test on two groups can be used to examine the gender impact on the degree of academic satisfaction.
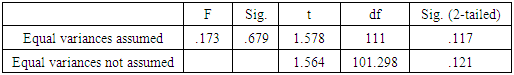
3.6.2. T-Test Exam Related to Gender Impact on Academic Satisfaction
H0: the average score of satisfaction between men and women is equal.H1: The average score of satisfaction between men and women is not equal.Table 27. T.Test Test Table
 |
| |
|
Since the value of the significant level (Sig) is greater than 0.05, so we can accept the assumption of H0 which means that the data follow the normal distribution. Thus, T-test of two group can be used to examine the effect of gender on the degree of academic satisfaction.
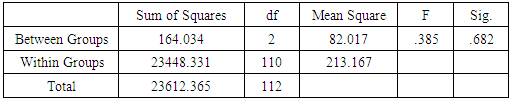
3.6.3. Analysis of the Year of Entry effect on Academic Satisfaction
Since the normality of the satisfaction score was checked in Section 3.6.1 and the data follow the normal distribution, we do not repeat the normalization test here.To evaluate the effect of the year of entry on academic satisfaction, we use the Analysis of Variance (ANOVA)H0: the average score of satisfaction of the three entries is equalH1: The average score of satisfaction of the three entries is not equal.Table 28. ANOVA Test Table
 |
| |
|
Since the (Sig) value is greater than 0.05, we accept the assumption of H0, which means that the average of academic satisfaction is the same in the three years of academic entry. This means that the variable of academic entry year does not effect on the degree of satisfaction.
4. Conclusions
Students are considered to be the most important and key recipients of academic services. Continuous monitoring of their academic satisfaction is not only effective in their academic achievement, but also it leads to the preservation and survival of the universities in a competitive environment. In fact, students are, on one hand, the organizational members of a university, and, on the other hand, they receive university services, which at the same time are regarded as a kind of university product. Considering these features, students can be representatives of the effectiveness and usefulness of university education in the society. By taking these conditions into account, the quality of students' perceptions and academic performance and their role in ensuring the effectiveness and guaranteeing the survival of the university system in the environment is important, therefore, universities and higher education centers are required to practically seek to guarantee their survival in the environment by creating a reliable and supportive environment through the development of factors affecting academic satisfaction in order to satisfy students. That is why universities should be provided the needed information and effective measures on the factors affecting academic satisfaction. Therefore, this study aims to help this by validating the students' academic satisfaction scale.As stated earlier, students' academic satisfaction is a multidimensional concept, which is divided into six dimensions and its authors called these dimensions as satisfaction with education, satisfaction with the teacher, satisfaction with the classmate, satisfaction with academic achievement, satisfaction with the methodology for evaluating education and satisfaction with the educational environment. Here, each dimension will be dealt with.Satisfaction with education is one of the students' academic satisfaction dimension. In explaining this aspect, one can refer to the relationship between student's mental assessment on the various experiences and achievements of the learning process or their understanding of the extent to which they expect on education and learning. Therefore, it is very important that to provide a ground for gaining positive experiences by the students and this should be considered by the authorities and teachers.Satisfaction with the teacher was the next dimension. Regarded the teacher's knowledge and their interaction with students as the factors affecting the students' academic satisfaction.A group of researchers believe that the teachers’ expertise and capabilities are among the factors affecting the academic satisfaction of learners. Also, Elliot and Shine (2003) reported that paying special attention to students 'problems and expectations and having a respectful attitude towards them affects students' academic satisfaction.Satisfaction of the classmate is the third dimension. Acknowledged that the integration of students in academic settings and their interaction with their peers are the most significant factors on academic satisfaction that prevent the students to drop out of the university. Thus, considering the effect of the students' satisfaction with their classmates on their satisfaction with education, educational planners and practitioners, in particular teachers, should increase the level of interaction and cooperation of students with each other using the participatory teaching methods and encouraging them to conduct collaborative research activities to ensure that student satisfaction is guaranteed in some way.Then satisfaction with academic achievement and satisfaction with the educational evaluation method is another aspect of students' academic satisfaction. Torkzadeh et al. conducted a study on factors affecting the evaluation of teachers by the students and came to the conclusion that checking the exam papers is the third most influential aspect of the evaluation of teachers by the students. The way to check the exam papers by the teachers is an important factor that affects the students' satisfaction with the professors; on this basis, due to the evaluation of academic achievement in achieving the goals of universities, academic managers and planners should encourage the teachers to use the various methods of evaluating academic achievement, as well as describe the goals and results of the evaluation for students, in order to increase the level of students' academic satisfaction.Students’ satisfaction with the educational environment was the last dimension in the present study. In this regard, a number of scholars have acknowledged that there is a significant relationship between academic satisfaction and the suitability of the academic, physical and organizational environment of the university. It is also stated that in dynamic academic environments, due to the emphasis on flexible rules, engagement, innovation and providing the trustable conditions among educational stakeholders, in addition to ensuring the survival and durability of the system, it also increases students’ satisfaction due to the consideration of their demands.Therefore, given that environmental factors directly or indirectly affect the perception and performance of educational stakeholders such as students, university authorities should pay attention to the improvement and development of this dimension, because it increases the university's effectiveness, as well as level of students' academic satisfaction. Ultimately, identifying student satisfaction factors and making improvements in each field is one of the important responsibilities of the authorities.
References
| [1] | Artino, A. R. (2007). Online Military Training: Using a Social Cognitive View of Motivation and Self-regulation to Understand Students' Satisfaction, Perceived Learning and Choice. Quarterly Review of Distance Education, 8 (3): 191-202. |
| [2] | Bolliger, D. U. & Martindale, T. (2004). Key Factors for Determining Student Satisfaction in Online Courses. International Journal on E-Learning, 3 (1): 61-67. |
| [3] | Sahin, I. (2007). Predicting Student Satisfaction in Distance Education and Learning Environments. Retrieved from ERIC database. (ED496541) |
| [4] | Reinhart, J. & Schneider, P. (2001). Student Satisfaction, Self-Efficacy, and the Perception of the Two-Way Audio/Video Distance Learning Environment: A Preliminary Examination. Quarterly Review of Distance Education, 2 (4): 357-365. |
| [5] | Deshields, O. W.; Kara, A. & Kaynak, E. (2005). Determinants of Business Student Satisfaction and Retention in Higher Education: Applying Herzberg’s Two – Factor Theory. International Journal of Educational Management, 19 (2): 128 – 139. |
| [6] | Helgesen, Q. & Nesset, E. (2007). What Accounts for Students’ Loyalty? Some Field Study Evidence. International Journal of Educational Management, 21 (2): 126 – 143. |
| [7] | Kuo, Y. C. (2010). Interaction, Internet Self – Efficacy and Self – Regulated Learning as Predictors of Student Satisfaction in Distance Education Courses. A Dissertation Submitted in Partial Fulfillment of the Requirements for the Degree, Utash State University Logan. |
| [8] | Debourgh, G. (1999). Technology is the tool, teaching is the task: Student satisfaction in distance learning. Paper presented at the Society for Information and Technology & Teacher Education International Conference, San Antonio, TX. |
| [9] | Chua, C. (2004). Perception of Quality in Higher Education. Paper Presented at the Australian Universities Quality forum. |
| [10] | Athanassopoulos, A; Gounaris, S. & Stathakopoulos, V. (2001). Behavioral Responses to Customer Satisfaction: An Empirical Study. European Journal of Marketing, 32 (5/ 6): 687 – 707. |
| [11] | Hatcher, L.; Kryter, K.; Prus, J. S. & Fitzgrald, V. (1992). Predicting College Student Satisfaction, Commitment and Attrition from Investment Model Constructs. Journal of Applied Social Psychology, 22: 1273 – 1296. |
| [12] | James, R. (2001). Students’ Changing Expectations of Higher Education and the Consequences of Mismatches with Reality. OECD Programme in Institutional Management in Higher Education (IMHE) Management Responses to Changing Student Expectations, Queensland, 24 September. |
| [13] | Umbach, P. & Porter, S. (2002). How do academic departments impact student satisfaction? Understanding the contextual effects of departments. Research in Higher Education, 43 (2): 209-234. |
| [14] | Kara, A. (2004). Business Student Satisfaction, Intentions and Retention in Higher Education: An Emprical Investigation. MEQ, Vol. 3. |
| [15] | Hatcher, L.; Kryter, K.; Prus, J. S. & Fitzgrald, V. (1992). Predicting College Student Satisfaction, Commitment and Attrition from Investment Model Constructs. Journal of Applied Social Psychology, 22: 1273 – 1296. |
| [16] | Gillespie M. Student-teacher connection: A place of possibility. J Adv Nurs. 2005; 52(2):211-9. |

 Abstract
 Reference
 Full-Text PDF
 Full-text HTML