-
Paper Information
- Paper Submission
-
Journal Information
- About This Journal
- Editorial Board
- Current Issue
- Archive
- Author Guidelines
- Contact Us
Education
p-ISSN: 2162-9463 e-ISSN: 2162-8467
2015; 5(2): 39-54
doi:10.5923/j.edu.20150502.01
Evaluating a Training Program Model for Computer Labs
 Abstract
 Reference
 Full-Text PDF
 Full-text HTML
Jose L. Silva-Lugo
Academic Technology, University of Florida, Gainesville, Florida, USA
Correspondence to: Jose L. Silva-Lugo , Academic Technology, University of Florida, Gainesville, Florida, USA.
| Email: |  |
Copyright © 2015 Scientific & Academic Publishing. All Rights Reserved.
Academic Technology (AT) Computer Labs at the University of Florida, USA, assessed a training program model with the objectives of finding the best training method, measuring training program’s effectiveness, and improving the program. In addition, we quantified transfer of training. This paper summarizes the results from fall 2000 to spring 2008. Training methods were lecture, group discussion, role-play, brainstorm, and hands-on activity. We measured training program effectiveness by evaluating knowledge, skill, performance, satisfaction, and an overall evaluation at the end of every semester. The training program was effective because 289 trainees passed the knowledge and skill test, 86% had good-excellent performance, and the majority was satisfied with the program. The overall assessment made structural/content changes, improved the program, and divided it in three periods. Trainees preferred role-play in Periods I and II, and they had no preferences in Period III. Transfer of training was 82% immediately after training, 67% after six months, and 53% after one year. The model resulted easy to apply, demanding in time and effort, and provided accurate and reliable results for improving the program through time. Face-to-face training is the best approach to guarantee well-trained employees in computer labs.
Keywords: Training methods, Training program effectiveness, Evaluations, Transfer of training
Cite this paper: Jose L. Silva-Lugo , Evaluating a Training Program Model for Computer Labs, Education, Vol. 5 No. 2, 2015, pp. 39-54. doi: 10.5923/j.edu.20150502.01.
Article Outline
1. Introduction
- Although training methods are important because of their influence on trainees’ learning process, on the success of the training program, and on the transfer of training, little research has been conducted in this topic. During the training program, training methods provide trainees the conditions that closely resemble those in the actual work environment. Therefore, the design and evaluation of these methods will be the key factor for effective training programs. In addition, training methods will ultimately affect how trainees apply their knowledge, skills, attitudes, and behaviors to the working environment. Even though there is no doubt about their importance, the number of papers evaluating the best training method for a particular field of expertise are scarce. Regarding a comparison among traditional training methods such as lecture, group discussion, brainstorm, and role-play, Carrol et al. [1] and Newstrom and Scannell [2] reported those comparisons in the field of Education, Health, Business, and Industry, and Silva-Lugo [3] in the field of Environmental Education. Other comparisons have been made with other training methods in several fields such as business administration, education, sciences, and psychology [4, 5], information technology [6, 7], health education [8], and medicine [9]. However, no study was found in computer labs training programs.Evaluating the effectiveness of a training program has become critical for organizations and researchers. United States companies spend more than $125 billion annually in training and development [10]. Since training cost is so high, organizations are concerned with implementing effective training programs to improve job efficiency. Effective training programs can only be obtained through continuous evaluations and the importance of evaluating them and assessing their effectiveness has been highlighted in the training field by AL-Ajlouni et al. [11], Bober and Bartlett [12], Galanou and Priporas [13], Goldstein [14], Hu Lien et al. [15], Noe [16], Swanson [17], and Swanson and Holton [18]. The literature has relied on the theoretical framework of evaluation models such as Kirkpatrick’s four-level model [19-22], Phillips’s five-level model [23], Swanson’s performance-level satisfaction model [17], and Galanou and Priporas’s six-dimensional model [13]. All these models have been applied in different fields such as human resource development, business, industry, banking, health care, education, technology, and e-Learning, but the settings have rarely been computer labs.The transfer of training has been highly discussed in the literature because of its relevance [24-31]. Since organizations make a significant financial investment in training, it is imperative to demonstrate that training efforts are accomplished [32, 33]. In other words, it is critical for organizations to make sure that training programs acquire a desired outcome such as an increase in job performance. Transfer of training has been evaluated in several academic fields such as human resource development, management, training, adult learning, and psychology. Nevertheless, we did not find any research in computer labs.Academic Technology (AT) Labs are five computer labs at the University of Florida, Gainesville, Florida, and a model was implemented to improve its training program. The predecessor of the current AT Labs was created in 1973 with the mission of providing computing service to students, faculty, and staff. This service has been offered through Technology Consultants (TCs), students who have been trained in trouble shooting hardware and software problems and customer service. Before fall 2000, the training program had problems with its design and evaluation instruments. In fall 2000, a new training program model was implemented with the following objectives: (a) to find the best training methods, (b) to measure training program’s effectiveness, and (c) to improve the training program every semester. In addition, we quantified transfer of training. The research questions were as follows: (a) what was the best training method for computer labs among lecture, group discussion, role-play, brainstorm, and hands-on activity? (b) Could the model measure training program’s effectiveness accurately? (c) Did the model improve the training program during and after implementation every semester? (d) How much transfer of training could this model achieve? This paper presents the results of evaluating the training program model from fall 2000 to spring 2008 and of quantifying transfer of training.
2. Methods
2.1. The Trainees
- A total of 289 trainees participated in the training program and they came from 46 countries and 77 academic majors. Trainees’ average age was 21 years old and the majority were American (60%), Asian Indian (7%), and Pakistani (5%). Caucasians had the highest percentage (48%) followed by Asian (30%), African American (10%), Latina/o or Hispanic (10%), and Europeans (2%). Academic majors with the highest representation were Computer Science (10%), Computer Engineering (8%), and Architecture (7%). The majority of trainees (56%) did not have previous work experience, and only 13% had some knowledge working with computers.
2.2. The Schedule
- The training program had two phases. Phase I included orientation, policies and procedures, customer service, and troubleshooting problems with PC/MAC computers, printers, plotters, scanners, CD/DVD burners, LCD projectors, and document camera. Phase II covered the most common software used in the labs such as Excel, PowerPoint, Photoshop, UNIX/HTML, and Dreamweaver. During the first five years, Phase I and II were carried out in six (13 hr) and five (10 hr) sessions, respectively. During the last two years, Phase I used eight sessions (19 hr) and Phase II had four sessions (8 hr). The Policies and Procedures Manual and the training website provided trainees all information needed to work in the labs.
2.3. The Training Program Model
- The model conceptualized training as a learning and evaluation process that provides training methods to engage TCs in the learning environment, uses evaluation instruments for measuring training effectiveness accurately, and improves the training program with an overall evaluation every semester (Figure 1). It was developed based on previous experience working with training programs. During and after the implementation of this model, the training program was expected to cause change in knowledge, skills, attitude, and behavior that contributed to the improvement of AT Labs. Furthermore, trainees were expected to behave according to AT Labs Policies and Procedures and to provide the best service to students, faculties, and staff. This model provided feedback during implementation and at the end of each training program.
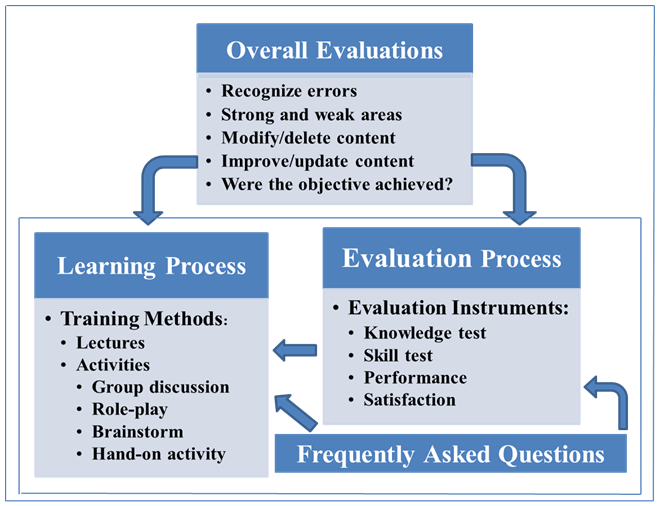 | Figure 1. Training Program as a Learning and Evaluation Model |
2.3.1. Training Methods
- We compared the following training methods: lecture, group discussion, role-play, brainstorm, and hands-on activity. We delivered lectures, summarized main ideas, and linked objectives with conclusions. In single-topic group discussions, we divided the group into subgroups, asked questions, subgroups discussed answers, and a general discussion synthesized answers. In several-topic group discussion, trainees asked any type of questions. In role-play 1, trainees faced normal and problematic users (e.g. aggressive and/or complaining about everything). In role-play 2, trainees received questions and dealt with users violating rules in the labs. Brainstorm confronted trainees with difficult questions. Hands-on activities practiced the skills learned during the training sessions.
2.3.2. Evaluations
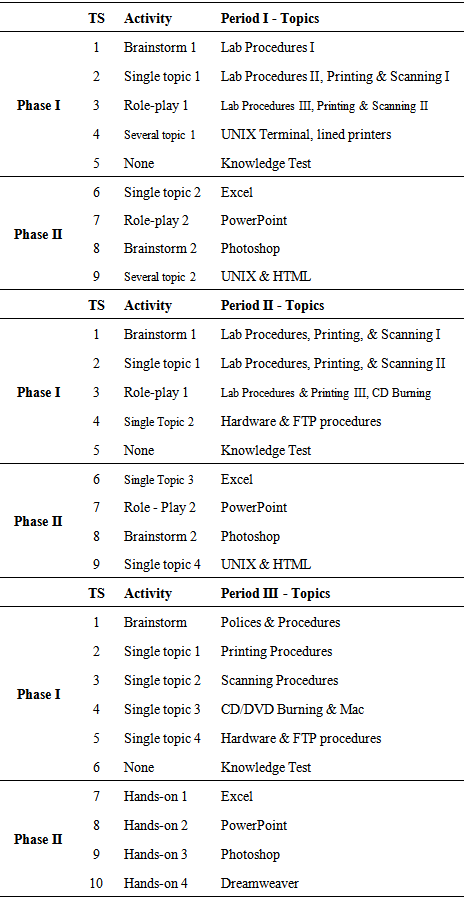
- The model included an evaluation of the training methods and an overall evaluation (Figure 1). We quantified training program effectiveness by assessing the training methods with a knowledge, skill, performance, and satisfaction evaluations. The program was deemed effective if it fulfils the following criteria: the majority of trainees per semester passed the knowledge test, obtained a satisfactory score in the skill test, had a good performance evaluation, and was satisfied with the training program.Knowledge and skill test were applied at the end of Phase I, and both verified the learning process in this phase. A knowledge test applied as pretest and posttest was a written test with 30 questions (maximum score 30 points and passing score 20 points). The skill test was an oral evaluation of procedures covered during each training session. The score was satisfactory or unsatisfactory. The performance evaluation monitored trainees’ activities in the labs. This evaluation was carried out to verify if trainees worked following policies and procedures, and to allow trainees to change their performance pattern before the end of the semester. Trainees did not know that they were evaluated during each shift for the entire semester. We coached trainees at the end of every shift by informing them how they could improve reporting/troubleshooting problems and helping users. If the dataset showed moderate or low performance, we counseled the trainee to persuade him/her to change his/her performance. From fall 2000 to fall 2005, we counseled trainees after 15 hr because our goal was to carry out 30 hr of evaluation per trainee. We observed that 15 hr of evaluation gave us a good picture of trainee’s performance pattern, and we noticed a drastic improvement of it after the counselling sessions. We emphasized trainees’ self-efficacy in their ability to change performance. Since we noticed a drastic change in the performance pattern, we started to give coaching/counselling sessions in every shift after fall 2005 if trainees did a poor job. The performance evaluation used a new methodology: activity/inactivity index and performance pattern.The performance evaluation recorded how active the trainee was by using the Relative Activity Index (RAI) and the Relative Inactivity Index (RII). The RAI was the number of counts working with hardware/software or users divided by the number of evaluated hours. We counted if trainees were working or not every 30 minutes. Hence, it was up to two counts per hour. Trainees needed to be active at least two times in an interval of 30 minutes to record one count. We also counted the number of times sitting down at the TC station every 30 minutes and estimated the RII as the number of counts not working divided by the number of evaluated hours. Both indices varied between zero and two. Trainees’ indices were categorized according to the following performance scale: excellent 1.5 < RAI ≤ 2.0; good 1.0 < RAI ≤ 1.5; moderate 0.5 < RAI ≤ 1.0; and low 0.0 < RAI ≤ 0.5. Then, the percentage of trainees that fell in those categories was calculated.Performance was also assessed by plotting trainees’ duties in a graph bar named performance pattern. The recorded duties were as follows: arriving on time, reporting problems, counting users, doing class preparation procedures, monitoring the lab, sitting down for more than 10 minutes, enforcing rules, pushing chairs, collecting trash, following instructions, and customer service. Each duty was transformed into categorical data by assigning it subcategories such as always = 2, sometimes = 1, and never = 0. Then, all duties were plotted in a bar chart according to the frequency of each duty in percentage during the semester. We evaluated each trainee for 20-30 hr per semester. We used surveys to assess trainees' degree of satisfaction toward each training session and to compare lectures vs other training methods (group discussion, role-play, brainstorm, and hands-on activity), henceforth activities. Lectures and activities were compared because of their different dynamics. The survey was anonymous, 5 questions rated separately lectures and activities from 1 (very dissatisfied) to 5 (very satisfied) for a maximum of 25 points each, and an open-ended question asked for suggestions for improvement. We took into consideration suggestions to improve the next training session. Another survey was given at the end of each training program to ask trainees’ opinion about the preferred activity.Trainees had the mandatory assignment to submit the questions received per lab every week. The purpose was to record and to answer all questions per semester. Thanks to these frequently asked questions (FAQ), trainees had questions and answers in advance just starting their jobs in the training website. The FAQ was a very important dataset to analyze and to evaluate the training program every semester.Trainees needed to attend all training sessions and to pass all evaluations to approve the training program. Trainees needed to pass the knowledge and skill test, showed a good RAI and performance pattern, and submitted the FAQ every week during the semester to continue working for AT Labs. The training program was improved during its execution and at the end of every semester with an overall evaluation (Figure 1). During the execution, the satisfaction survey helped to improve details of lectures and activities from one session to the next; the performance evaluation detected trainees with low performance and the counseling sessions corrected them. At the end of the semester, the results of all evaluation instruments and the FAQ were put together to assess the learning and evaluation process of the training program regarding to: recognize errors, identify weak/strong areas, correct errors and weak areas, improve/update the content of each training session, and to determine if the objectives were achieved. Particularly, the FAQs were very helpful to add/delete training sessions, content of training methods, and edit evaluation instruments. The training program model helped to improve the training program from one semester to the next. Due to the improvements made at the end of each training program, all training programs from fall 2000 to spring 2008 were divided into three periods. Each period offered a set of different activities (Table 1). During Period I (fall 2000 - spring 2003), we presented two brainstorms, two role-plays, two single-topic, and two several-topic discussion sessions. Period II (summer 2003 – fall 2005) provided the same activities, but several-topic discussion session was replaced by single-topic. Period III (spring 2006 – spring 2008) included a re-organization of the content in Phase I and two new training sessions (printing and Dreamweaver).
|
2.4. Transfer of Training
- Transfer of training in AT Labs was defined as the degree trainees applied to their jobs the knowledge, skills, attitudes, and behaviors they acquired during the training program. This is Balwin and Ford’s transfer of training concept [24] with the addition of the behavior component [34]. We quantified the percentage of training transfer by adding the percentage of knowledge/skill applied per shift and the average of the performance pattern. The knowledge/skill applied per shift was calculated as the percentage of questions/procedures answered/performed correctly. We averaged all TCs’ training transfer immediately after training, six months, and one year after training. We quantified training transfer from spring 2010 to spring 2011. From fall 2000 to fall 2009, managers did not allow us to evaluate TCs because of the time, effort, and money involved achieving this task. Furthermore, AT Labs had a replacement rate between 25% and 30% every semester during this interval of time.
2.5. Statistical Analysis
- All statistical analyses were carried out by using SAS 9.3. The repeated measured analysis was applied with general mixed linear models and the Tukey-Kramer’s multiply pairwise comparison for: (a) comparing least-squares mean (lsmean) satisfaction scores between lectures and activities within each period of the training program, and (b) finding the best training method (the method with the highest significant lsmean satisfaction score). We used the Wilcoxon Signed Rank Test to compare mean scores between pretest and posttest from fall 2000 to fall 2004. Level of significance was equal to 0.05 for all tests.
3. Results
3.1. The Best Training Method
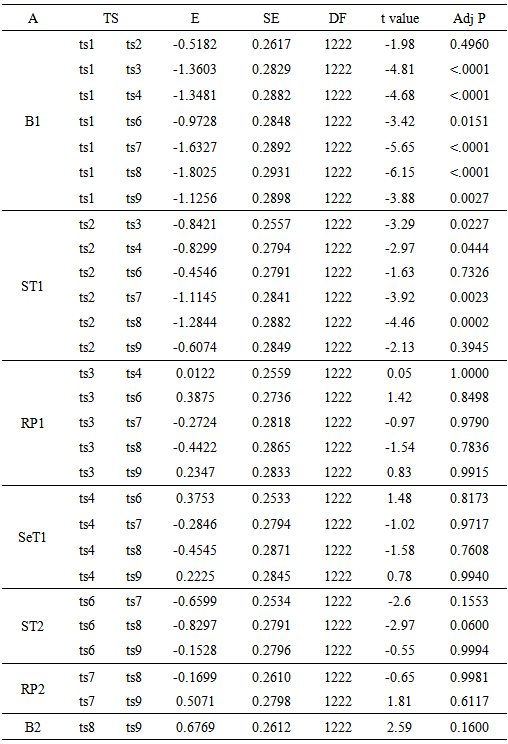
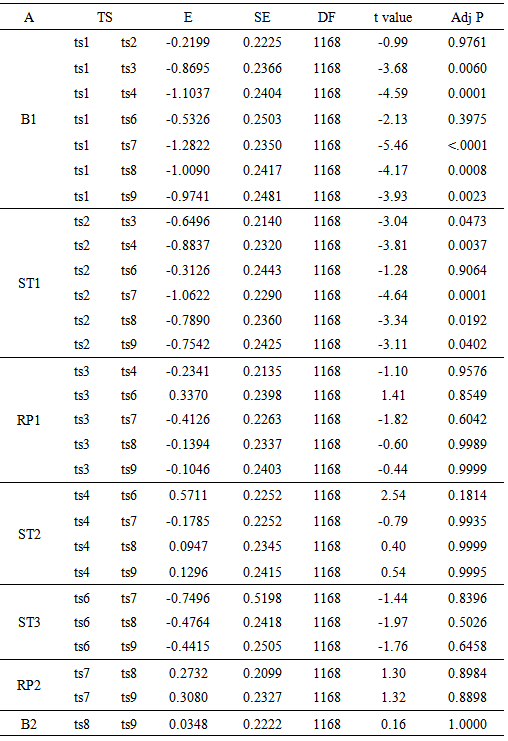
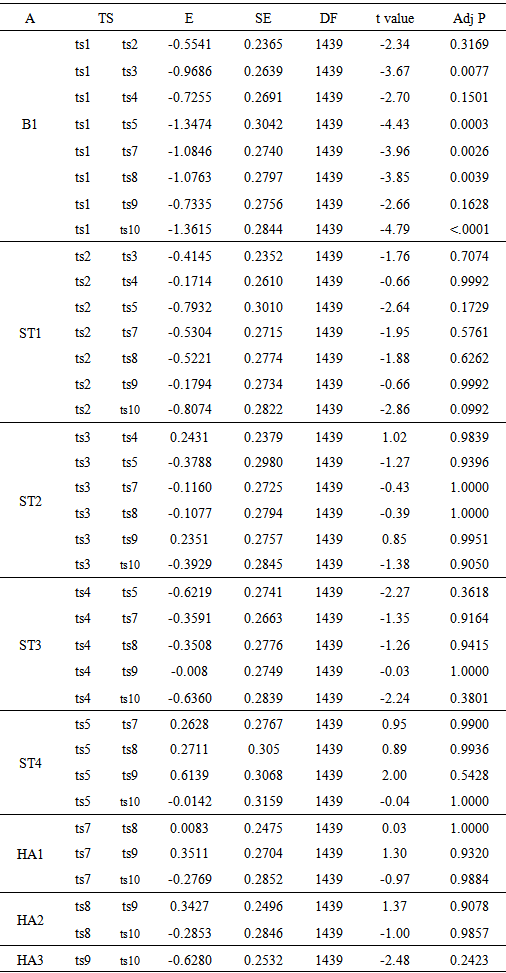
- Figure 2 displays the lsmean satisfaction scores for lectures and activities during the three periods. Lectures and activities followed approximately a similar pattern. This was because trainees gave similar scores to both lectures and activities per training session influenced by the degree of entertainment obtained during those sessions. Role-play was the preferred activity during Periods I and II (Table 2). From fall 2000 to fall 2005, the majority of trainees selected role-play as the best activity carried out in all training programs. Role-plays were fun and entertaining, particularly role-play 2. This was the main reason of having two peaks in the activities during Periods I and II (Figure 2). This fact also explained that the two peaks in lectures during both periods matched the two activity peaks. Even though the survey requested trainees to score lectures and activities independently, trainees extended their satisfaction from the activity toward the lecture. This issue introduced an error in the way trainees scored lectures and activities in the surveys. For instance, in Period II, Photoshop (ts8) and Dreamweaver (ts9) lectures were more interesting regarding the quality and quantity of the information than PowerPoint (ts7). However, since role-play 2 was the activity scheduled with PowerPoint, trainees gave a high score to the lecture too. Since this type of role-play introduced an error in the way trainees scored training methods, we decided to drop it from the training program after the overall evaluation in fall 2005.
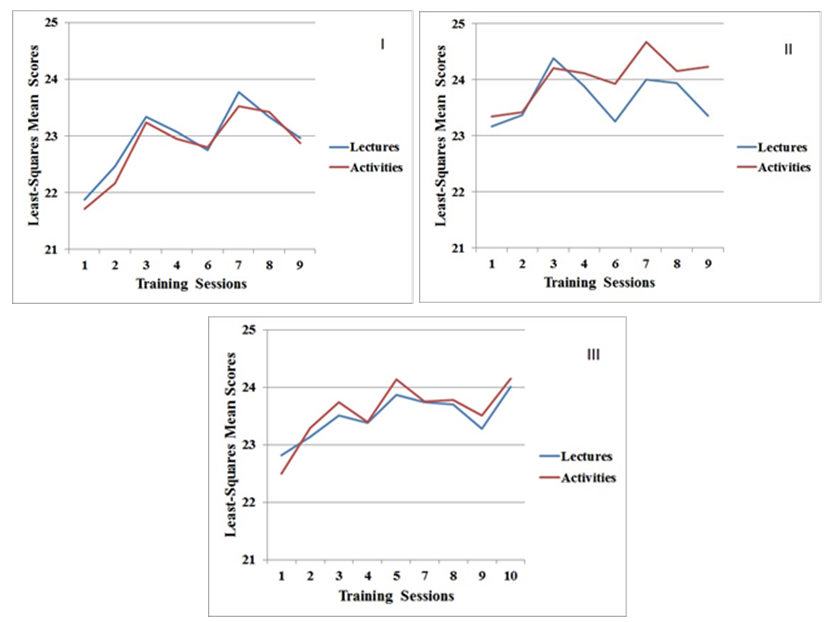 | Figure 2. Least-squares mean satisfaction scores for lectures and activities per training session during Period I (fall 2000 - spring 2003), Period II (summer 2003 - fall 2005), and Period III (spring 2006 - spring 2008) |
|
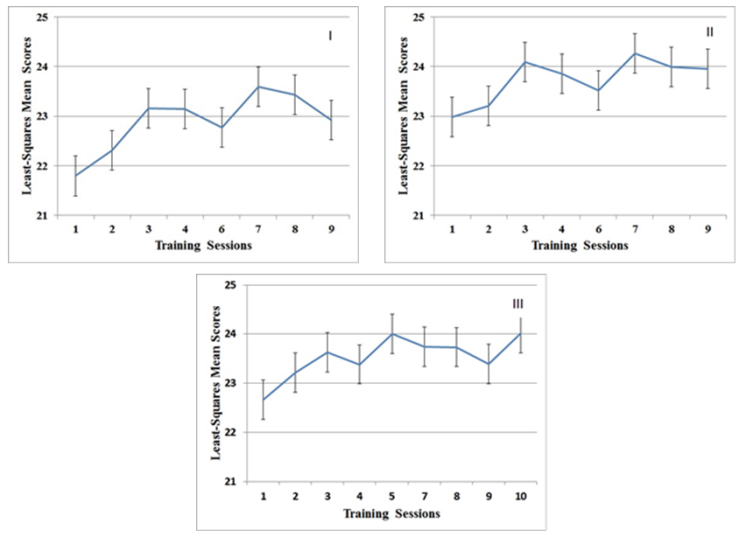 | Figure 3. Combined (lectures and activities) least-squares mean satisfaction scores with 95% confidence intervals over the training sessions for Period I (fall 2000 - spring 2003), Period II (summer 2003 - fall 2005), and Period III (spring 2006 - spring 2008) |
3.2. Evaluating Training Program Effectiveness
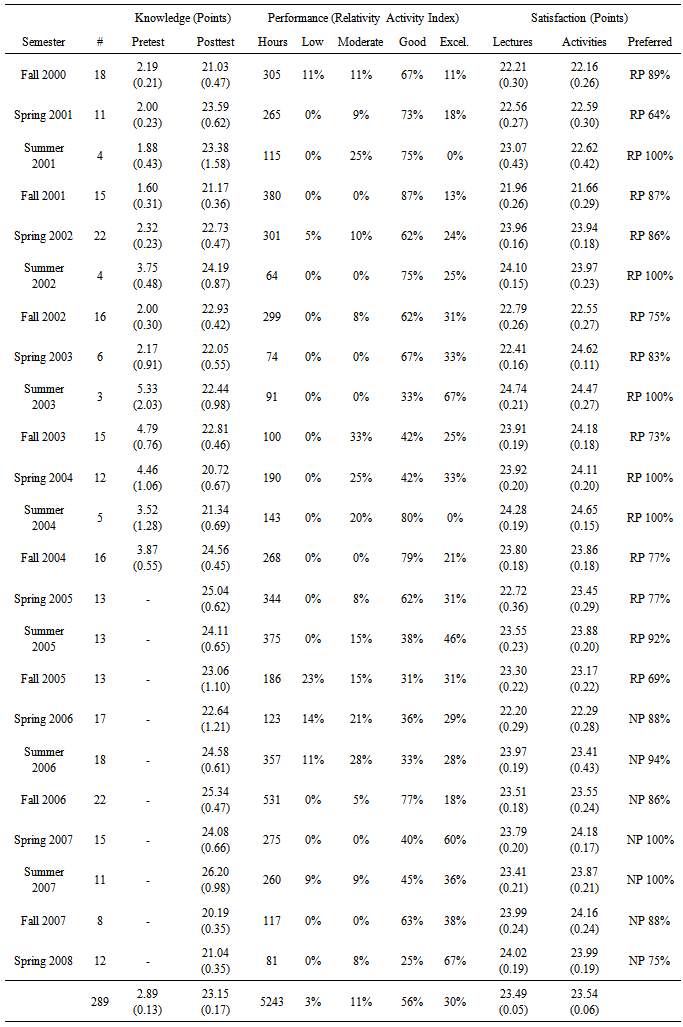
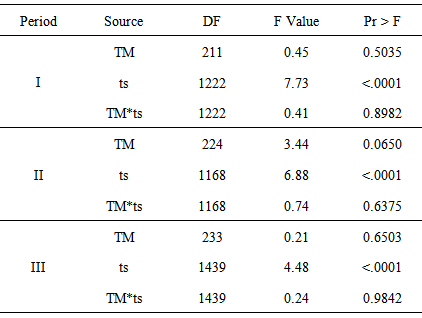
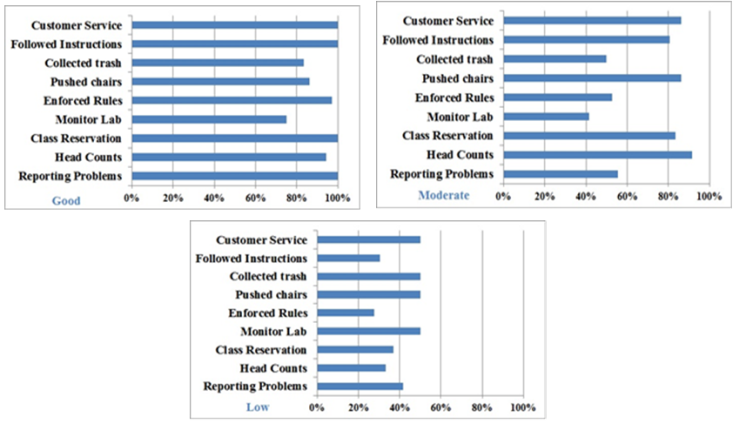
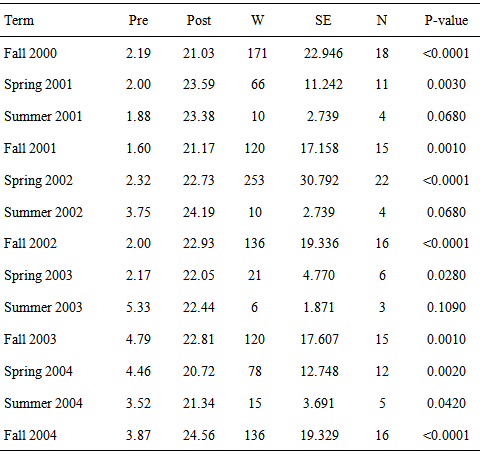
- Each training program from fall 2000 to spring 2008 was effective because they fulfill our criteria. Mean pretest and mean posttest were significantly different (Table 7), indicating the learning process. The exceptions were summer 2001, 2002, and 2003 because of the small sample size (N ≤ 4). This comparison only applied for the training programs fall 2000 - fall 2004, and the reasons are explained later in this section. All trainees per training program obtained a satisfactory score in the skill evaluation. We evaluated 289 trainees for 5,243 hr from fall 2000 to spring 2008 (Table 2). The RAI and the RII were good indicators of how active and inactive trainees were during the training program, respectively. In each training program and for the entire dataset, the percentage of trainees with good and excellent performance was greater than the combined categories low and moderate. This was an indication that trainees did a good job in the labs as corroborated with the performance pattern bar graph (Figure 4). This chart gave a good picture of trainees’ performance and indicated whether it was good (duties over 70%), moderate (duties between 40% and 90%), or low (duties under 50%). These patterns changed from the beginning to the end of the semester for the majority of trainees. Trainees with low performance changed to good performance after coaching/counseling sessions.
 | Figure 4. Example of Technology Consultant with Good, Moderate, and Low Performance Pattern |
|
|
|
|
3.3. Training Transfer
- Testing TC’s knowledge/skill applied per shift plus the performance pattern bar chart were accurate estimators of the transfer of training. Quantifying knowledge/skill displayed per shift provided an accurate percentage of correct answers/procedures per shift by the time TCs were helping users. Assessed duties such as reporting problems, class preparation procedures, monitoring the labs, enforcing rules, pushing chairs, and collecting trash, were good indicators to verify an attitude shift or/and a behavioral change. Each group of TCs had a proportion that required coaching / counseling because they frequently missed these duties. We could observe their attitude shift and behavioral change after coaching/counseling, which was a feedback that also influenced the transfer of training. In AT Labs, TCs’ transfer of training was 82% immediately after training, 67% after six months, and 53% after one year.
4. Discussion
4.1. The Need to Evaluate Training Methods for IT Programs
- Few studies have been conducted to test traditional training methods in computer labs. Carrol et al. [1] surveyed 200 training directors of the top 500 corporations in the United States to test nine training methods. The most effective methods for knowledge acquisition were programmed instruction, case study, and group discussion. The least effective were lecture, sensitivity training, and role-play. The most effective for participants’ acceptance of training methods were group discussion, case study, and business game. The least effective were TV lecture, lecture, and programmed instruction. Newstrom and Scannell [2] conducted a survey with 50 of the 200 training directors of the largest firms in the USA and replicated the previous study. The most effective methods for knowledge acquisition were group discussion, role-play, and programmed instruction. The least effective were TV lecture, lecture, and sensitivity training. The most effective for participants’ acceptance were case study, business game, and role-play. The least effective were programmed instruction, lecture, and TV lecture. These two studies showed similar results. Silva-Lugo [3] found that national park staff ranked lectures higher than role-play, group discussion, performance, and assignments, but lectures were only significantly different from assignment. In AT Labs, lectures were relevant to trainees; however, the first two previous studies found that lectures did not have a positive influence upon knowledge and were the least accepted in training programs. Perhaps, lectures were important for trainees and park staff because it was one of the main methods of instruction at the University of Florida and Venezuela, respectively. If lectures are carefully delivered, they can be an appropriate training method [35]. Even though it was not significant, the majority of trainees chose role-play as the preferred method during five years; and it was one of the most effective for knowledge and participant’s acceptance in Newstrom and Scannell’s study. The combination of computer skill demonstration with hand-on activities (behavior modeling) have been reported as the most widely used, well-researched, and effective training method [36, 37]. Gist et al. [38, 39] reported that trainees’ performance with the behavior-modeling method was higher than with the computer-aided instruction. Compeau and Higgins [40] compared behavior modeling with lectures and found out that behavior modeling was more effective in spreadsheet training. Simon & Werner [41] and Simon et al. [42] also reported that behavior modeling was more effective than lectures and self-study programs. Yi and Davis [36] researched further and combined behavior modeling with retention enhancement, which involves changing key elements of modeled activities into a pattern of verbal symbols and mentally practicing the modeled activities. They randomly assigned 111 trainees to one of these training methods for spreadsheets: retention enhancement, practice, and retention enhancement plus practice. They found that retention enhancement plus practice had a significant higher learning outcome than practice alone. Taylor et al. [37] evaluated 117 studies regarding the effects of behaviour modeling on training outcomes and characteristics of training designs. Training outcomes had the largest effects followed by job behavior and results outcomes. There is no doubt that behavior modeling by itself or in combination with other methods is a good training method. However, the training program model in the current study used behavior modeling in Phase III, but it was not significantly different from other training methods. Since the current study is in the IT field, maybe this field has a different outcome on how behavior modeling affects trainees’ cognitive learning.More research is necessary to provide additional information about the effect of training method on IT training programs. The reviewed literature indicated few studies and no specific trend. Although a particular set of methods work with a group of people, it might not work for others. Since human nature is diverse and complex, training programs in IT have the challenge of finding effective methods. For a comprehensive review and qualitative analysis of different training methods, see Martin et al. [43]. Therefore, the current research contributes to the knowledge and understanding of how different training methods affect adult education in IT. This is important because the more we know about how training methods influence cognitive and skill domains in adult learners, the better we can structure and organize IT training programs in order to meet cognitive and skill goals and to make training programs more effective.
4.2. The Significance of Evaluating Training Program Effectiveness in IT Programs
- AT Labs used a training program model for collecting data through evaluation instruments with the purpose of determining its effectiveness and assessing/improving the program through time. Knowledge and skill evaluations clearly helped to measure knowledge and skill obtained during training. Performance evaluations are difficult to carry out and even more difficult to see in the literature [44, 45, 46]. Our method is unique and can be easily applied in any environment similar to AT Labs. It demands time, effort, and responsibility, and it is a good method because it provides instant feedback that would help the employee to improve his/her performance the next shift. The cost associated with the amount of hours needed (30 h) to conduct a good performance evaluation should not be a constraint. Thirty hours in a semester can be accomplished in regular shifts where the evaluator can carry out other duties at the same time. Trainees had a high degree of satisfaction toward the training program, and they did not have any significant preference toward a particular training method. The statistical analysis indicated no significant difference between lectures vs activities and independently of the bias introduced by role-plays, they did not have significant lsmean scores among other activities. Training methods for computer-based training programs will vary with the objective of the training sessions. If one is interested in achieving conclusions after testing several procedures or applications regarding a particular problem, perhaps brainstorms or single topic group discussions are more suitable. Nevertheless, hands-on activities are the best when several tools of a particular application are taught, and employees need practice to get familiar with them. This is the best method for developing skills. The evolution of a training program relies on the overall assessment. Evolution implies changes to fit the new environmental conditions. Since academic technology changes so fast with time, changes are required to adapt to the new hardware and software. Any change made to a computer lab will affect the training involved in the institution. Therefore, careful assessment of the overall training program in combination with the evaluations instruments and FAQs are needed to guarantee good decisions, changes, and effective training programs. Only a small percentage of institutions have been successful in executing an evaluation process that feeds back into the training design [13]. Below, it is an example of what happened after spring 2008.The training program continued with the same model from spring 2008 to spring 2011. The training program continued changing and evolving following its own design. Nonetheless, it did not incorporate any research and there were changes in the schedule, structure, and content after spring 2008. For example, a new training website was created with better navigation tools and search engine for the FAQs. The FAQ was interactive. We offered orientation, 1st, and 2nd training session in a single packet of 12 h before starting to work the first shift. In Phase I, we removed burning procedures because students were not burning CDs and DVDs after the introduction of jump drives. In Phase II, training sessions were on Word, Excel, PowerPoint, Photoshop, and Dreamweaver and increased to 3 hr; 2 hr for lectures and 1 hr for hands-on activities. In addition, we added a training session on advanced Word 2010 and Adobe Photoshop due to the results of the surveys conducted in the labs and the need to provide more tools in Photoshop, respectively. An important change was that we started to evaluate TCs’ performance in spring 2010. This evaluation immediately showed its benefits because it was fair, objective, and quantitative for all employees. Since the training program after spring 2008 did not include research and the schedule, the structure, and the content were very different from the previous program (before spring 2008), we did not compare the results of the evaluations before and after spring 2008. No information is provided after spring 2011 because the author was promoted to another position.Several models have been presented in the literature to evaluate training program effectiveness [13, 17, 19. 20, 21, 22, 23]. Because our evaluation instruments applied to AT Labs involve knowledge, skill, performance, and satisfaction, we will compare our approach with Kirkpatrick’s model, which it is composed of four levels. Level 1, reaction quantifies how trainees react to the training program. Level 2, learning measures what was learned from the training experience. Level 3, behavior/application evaluates the level to which trainees apply what was learned on the job. Level 4, results assesses if the program achieve the expected outcomes. Kirkpatrick’s model simplicity has been criticized by Holton [46] and by Alliger and Janak [47] regarding its assumptions: (a) the four evaluation levels are arranged in ascending order of the information provided, (b) the four levels are causally linked; and (3) the levels are positively inter-correlated. Even though the critiques are valid, this is one of the models most generally accepted by academics [44-51], and it continues to be the most popular [52-54]. AT Labs training measured satisfaction (reaction toward training methods), knowledge/skill (learning), performance (behavior/application), and carried out the overall assessment to determine if the training program achieved the expected outcomes (results). These four levels in combination with the FAQ helped us to improve our program during and after implementation and assess accurately its effectiveness. In this regard, our training program has been formative (improvement during delivery), summative (improvement after completion) following Scriven [55] and Beyer [56], and highly effective. These four levels of evaluation can be considered any time a training program for computer labs is evaluated and when the objectives include formative and summative improvements. This is a robust way to understand the total effect of the training program [57, 58], to determine its effectiveness, and to verify if the transfer of training started to take place.Evaluations and transfer of training are rarely linked. These concepts are seldom joined in the literature, and they are presented separately most of the time. The only paper found addressing this issue was published by Saks and Burke [53], where they surveyed 150 members of a training and development association in Canada. They found that the frequency of the training evaluation explained a significant amount of the variance in transfer of training and was stronger immediately after training (R2 = 0.23, p < 0.001), than six months after training (R2 = 0.14, p < 0.001) and one year after training (R2 = 0.13, p < 0.001). In addition, following Kirkpatrick’s evaluation criteria, only behavior and results were significantly related to transfer of training. Authors also reported that organizations that evaluate their training programs more frequently in terms of behavior and results report higher rate of transfer of training. However, the results found by Saks and Burke should not be generalized. Institutions that evaluate their training programs more frequently at all Kirkpatrick’s levels should have training programs that are more likely to be transferred. AT Labs is an example.The evaluation of training program effectiveness in IT programs needs more research. According to the American Society of Training and Development (ASDT) [59, 60] 92% of training evaluation uses Kirkpatrick’s Level 1, 11% of training is evaluated at Level 3, and 4% is measured at Level 4. In the Industry field, ASTD revealed that only 32% of all trainings are evaluated at Level 2 and 12% at Level 3 [61]. A survey carried out on IT training reported that organizations evaluate less than 10% of the training at Level 3 [62]. The impact of technology training is largely unknown and the lack of job transfer evaluation is a major issue that IT training confront today [63]. A second major challenge facing IT training is the difficulty of determining the effectiveness of training [64]. A study conducted at the University of Mauritiues and published in 2010 evaluated an IT training course by using Level 1 and 2. Authors claimed that this was the first evaluation training program conducted at the university level [65]. These studies clearly indicate that there is a strong need of research in the IT field regarding evaluating the effectiveness of training programs. The current study presents a simple model but efficient and accurate for measuring training program effectiveness. However a new approach is required to fulfill the complexity of evaluating training in IT programs.An integral model for measuring training program effectiveness is necessary in IT programs. Unfortunately, since we do not have enough research in the IT training field, we have to look at studies carried out in other fields such as Psychology and human resource development. Speaking in general, training program effectiveness have been assessed by using one or more of Kirkpatrick’s criteria [19-22]. Even though other approaches to evaluate training programs have been reported [66-68], most of the time training success has been measured by using Level 1 and 2 [45, 52, 54, 69], Level 3 [70, 71], and in rare studies Level 1, 2, and 3 [72]. The majority of the online training only evaluates Level 1, which it is by itself a poor predictor of training success [73]. The use of a multidimensional criteria for evaluating training effectiveness have been suggested in the literature [66, 74]. Some authors have started by splitting Kirkpatrick’s criteria into subcategories. Alliger and Tannenbaum [75] divided the reaction criterion into three subcategories: affective, utility, and a combination of the two. Alliger et al. [48] decomposed the learning criterion into three components: immediate posttraining knowledge, knowledge retention, and behavior and skill demonstration. Other variables that have been proposed such as trainee perceptions of job relevance and instructor’s skill, which they were not significantly correlated with participants’ posttest scores [76], trainee motivation to learn was significantly related to both declarative knowledge and skill acquisition [77], and learning goal orientation and trainee intention were significantly correlated with post-training behavior [78]. Particularly, intentions show the effort that trainees are doing to perform the expected behavior. Hence, intentions might be an important variable for understanding transfer of training. Burke and Hutchins [79] used participant characteristics, trainer characteristics, design and delivery, and work environment in the model to measure transfer of training. Alvarez et al. [80] presented the most integrated theoretical model in the literature so far. Authors developed an integrated model of training evaluation and effectiveness after a literature review. The model has four levels. The 1st level is need analysis that covers the other three levels. The 2nd and 3rd level combine six evaluation measures such as reaction, change in learners (posttraining self-efficacy, cognitive learning, training performance), transfer performance, and results. The 4th level has training effectiveness variables: individual characteristics (motivation) related to reactions; individual and training characteristics (learning principles) are related to all three measures of changes in learners; and individual training and organizational characteristics (positive transfer environment) are related to transfer performance. This model could be implemented in IT training research for measuring training program effectiveness by using the same variables and/or testing new ones. The variables in the models were selected after a literature review. For example, group of learning principles was introduced in the model after several researchers found out that they contributed to learning and transfer performance in several disciplines. Therefore, more research is needed in IT training to select the best variables for this model. Specifically, transfer of training due to its strong outcome at the organization level.
4.3. The Critical Importance of Training Transfer
- Transfer of training was facilitated with practice, the diversity of techniques offered, the level of complexity, and coaching/counseling sessions. Practice and repetition were a good learning exercise. After the training program, TCs continue using several types of scanners, printers, and CD/DVD burners and their respective software on both PC and Mac platforms in combination with the questions received in the labs about Word, Excel, PowerPoint, Photoshop, and Dreamweaver. These activities helped TCs to practice and to experiment the diversity of techniques / procedures and the levels of complexity taught during the training program. In addition, coaching/counseling sessions helped TCs to correct technical mistakes or attitude/behavior issues and to improve their general performance. Some studies have found that providing feedback on employee’s performance following a training program is positively correlated to perceptions of transfer of training [81, 82]. This factor has an important influence in training transfer [83]. AT Labs offered a realistic training environment, support, and an opportunity to perform, which are key factors for the transfer of training [30].The high transfer of training found in AT Labs can be justified. In the literature, transfer of training has been estimated as low as 10% [24, 84, 85], or a little more conservative as approximately 40% immediately after training, 25% after six months, and 15% after one year [86], and 62%, 44%, and 34% immediately, six months, and one year after training, respectively [87]. AT Labs recorded the highest transfer of training ever reported so far in the literature. Technology Consultants remembered knowledge and skills learned during Phase I because they practiced them daily or weekly. In addition, they had the Policy and Procedures Manual, the training website, and the FAQs available for consultation. If TCs did not know the answers to new questions, they contacted the chain of command. Therefore, knowledge and skill were always available to them. However, since the knowledge and skills learned during Phase II were not practiced daily or weekly, they tended to be forgotten because TCs did not review the lesson plans. It is important to highlight that the amount of knowledge being transferred varies among groups within and between organizations. Independently of the amount that is transferred, in general, there is a consensus that it is not high and decreases through time. This is the challenge that organizations have with their training programs because of the money, human effort, and time involved planning, executing, and evaluating them. US companies spend more than $50 billion annually on formal training [88]. As a result, organizations and training researchers have high interest in obtaining more knowledge and understanding about transfer of training and how to improve it.
4.4. Face-to-Face vs. On-Line Training
- Face-to-face training vs. online training deserves a review. AT Labs Training Program has mainly worked with undergraduate students by using the traditional training approach. This face-to-face training provides more than one evaluation opportunity to assess trainees’ progress during and after the training program. Knowledge, skill, performance, satisfaction, training effectiveness, and transfer of training can be evaluated accurately. In this regard, online training only offers the possibility to evaluate knowledge and satisfaction and constraints the evaluation of training effectiveness and transfer of training. In general, online quizzes and exams are easy, and there is no monitoring during the application of the tests. During Period III, we included online tutorials offered by Microsoft IT Academy in Microsoft Office to compare trainees’ learning with our face-to-face training sessions. Trainees’ feedback was that the online tutorials were boring, quizzes were too easy, and they did not complete them for these reasons. Hence, these on-line tutorials were removed from the training material after two months. Would trainees have learned more if they had completed the on-line tutorials?Regarding learning outcomes, the literature mainly indicates no difference between face-to-face and on-line learning. Although previous studies have found that e-learning can encourage deep learning [89, 90] or a superior performance [91], other studies have demonstrated no difference in learning outcomes between the face-to-face and the online group [92-96]. Just providing materials and online discussions do not necessarily increase learning [97]. In addition, online groups spent more time in the learning process [94] and students preferred to complete activities face-to-face rather than online [96]. In general, students preferred group discussion to be conducted face-to-face because they felt more engaged and received faster feedback [96, 98].Live training is still an excellent approach to guarantee well-trained employees in computer labs. The majority of the universities in the United States are currently using online training. This strategy saves money because it reduces training staff members, time, and effort carrying out the training program. In addition, it allows trainees to review training documentation as many times are needed and in any place where Internet service is provided. However, there is a cost introduced by purchasing the software licenses. The cost/benefit balance needs to be established depending of the number of employees and licenses needed. Furthermore, if the institution is concerned about well-trained technology consultants or computer operators, the learning outcomes, skill, performance, and transfer of training must be monitored and evaluated. Transfer of training has the likelihood of being more successful in a face-to-face training program. On-line training tutorials could be used as supplemental material.
5. Conclusions
- Although we did not find any activity that statistically represented the best training method, the training program model allowed us to measure the effectiveness of the training program and to assess training methods accurately. The model also permitted to evaluate each training program during and after implementation, including structural and content changes. Because we facilitated practice, diversity of techniques, and coaching/counselling on a daily basis, the model achieved the highest transfer of training ever reported in the literature.
ACKNOWLEDGEMENTS
- I want to thank Academic Technology for all the help and support that I have received during 15 years. Particularly, my gratitude to Mark McCallister, Jim Albury, Sarah Still, Daniel Delgado, Adam Brown, and all the Training Specialists and Supervisors who helped me to carry out the training program.
References
| [1] | Carrol, S. J., Payne, F. T., and Ivancevich, J. J., 1972, The relative effectiveness of training methods, Personnel Psychology, 25, 495-509. |
| [2] | Newstrom, J. W., and Scannell E. E., 1980, Games trainers play, New York, NY, McGraw Hill Book Company. |
| [3] | Silva-Lugo, J. L., 1998, A training program for hunter education in Venezuelan national parks, M.S. Thesis, University of Florida, Gainesville, Florida, 148 p. |
| [4] | Burke, M. J., and Day, R. R., 1986, A cumulative study of the effectiveness of managerial training, Journal of Applied Psychology, 71, 232–245. |
| [5] | Callahan, J. C., Kiker, D. S., and Cross, T., 2003, Does method matter? A meta-analysis of the effects of training method on older learner training performance, Journal of Management, 29, 663-680. |
| [6] | Danziger, J., and Dunkle, D., 2005, Methods of training in the workplace. Center for Research on Information Technology and Organizations, School of Social Sciences, University of California, Irvine, CA. Retrieved from: http://www.crito.uci.edu/papers/2005/DanzigerDunkle.pdf. |
| [7] | Gits, M., Rosen, B., and Schwoever, C., 1988, The influence of training method and trainee age on the acquisition of computer skills, Personnel Psychology, 41, 255-265. |
| [8] | Assaf, A. R., Cummings, K. M., Graham, S., Mettlin, C., and Marshall, J. R., 1985, Comparison of three methods of teaching women how to perform breast self-examination, Health Education and Behavior, 12, 259-272. |
| [9] | Koponen, J., Pyoral, E., and Isotalus, P., 2012, Comparing three experiential learning methods and their effects on medical students’ attitudes to learning communication skills, Medical Teacher, 34, 198-207. |
| [10] | Paradise, A., (2007). State of the industry: ASTD’s annual review of trends in workplace learning and performance, Alexandria, VA, ASTD. |
| [11] | AL-Ajlouni, M. M., Athamneh, S. M. H., and Jaradat, A. A., 2010, Methods of Evaluation: Training Techniques, International Research Journal of Finance and Economics, 37, 56-65. |
| [12] | Bober, C. F., and Bartlett, K. R., 2004, The utilization of training program evaluation in corporate universities, Human Resource Development Quarterly, 15, 363–383. |
| [13] | Galanou, E., and Priporas, C., 2009, A model for evaluating the effectiveness of middle managers’ training courses: evidence from a major banking organization in Greece, International Journal for Training and Development, 13, 221-246. |
| [14] | Goldstein, I., 1993, Training in organizations: Needs assessment, development, and evaluation, 3rd ed., Pacific Grove, CA, Brooks/Cole. |
| [15] | Hu Lien, B. Y., Yuan Hung, R. Y., and McLean G. N., 2007, Training evaluation based on cases Taiwanese benchmarked high-tech companies, International Journal of Training and Development, 11, 35-48. |
| [16] | Noe, R., 2000, Invited reaction: development of generalized learning transfer system inventory. Human Resource Development Quarterly 11, 361–366. |
| [17] | Swanson, R. A., 1994, Analysis for improving performance: tools for diagnosing organizations and documenting workplace expertise, San Francisco, CA, Berrett Koehler. |
| [18] | Swanson, R. A., and Holton, E. F. 1999, Results: how to assess performance, learning, and perceptions in organizations, San Francisco, CA, Berrett-Koehler. |
| [19] | Kirkpatrick, D. L., 1959a, Techniques for evaluating training programs, Journal of ASTD, 13, 3-9. |
| [20] | Kirkpatrick, D. L., 1959b, Techniques for evaluating training programs, Part 2 – Learning. Journal of ASTD, 13, 21-26. |
| [21] | Kirkpatrick, D. L., 1960a, Techniques for evaluating training programs: Part 3 – Behavior, Journal of ASTD, 14, 13-18. |
| [22] | Kirkpatrick, D. L., 1960b, Techniques for evaluating training programs: Part 4 – Results, Journal of ASTD, 14, 28-32. |
| [23] | Phillips, J. J., 2003, Return on investment in training and performance improvement programs, San Francisco, CA, Butterworth-Heinemann. |
| [24] | Baldwin, T. T., and Ford, J. K., 1988, Transfer of training: a review and directions for future research, Personnel Psychology, 41, 63–105. |
| [25] | Baldwin, T. T., Ford, K. J., and Blume, B. D., 2009, Transfer of training 1988–2008: an updated review and agenda for future research, International Review of Industrial and Organizational Psychology, 24, 41–70. |
| [26] | Blume, B. D., Ford, J. K., Baldwin, T. T., and Huang, J. L., 2010, Transfer of training: a meta-analytic review. Journal of Management, 39, 1065–1105. |
| [27] | Burke, L. A., and Hutchins, H. M., 2007, Training transfer: an integrative literature review, Human Resource Development Review, 6, 263–296. |
| [28] | Cheng, E. W. L., and Hampson, I., 2008, Transfer of training: a review and new insights, International Journal of Management Reviews, 10, 327–341. |
| [29] | Cheng, E., and Ho, D., 2001, A review of transfer of training studies in the past decade, Personnel Review, 30, 102–118. |
| [30] | Grossman, R., and Salas, E., 2011, The transfer of training: what really matters, Training and Development Journal, 15, 103–120. |
| [31] | Merriam, S. B., and Leahy, B., 2005, Learning transfer: a review of the research in adult education and training, PAACE Journal of Lifelong Learning, 14, 1–24. |
| [32] | Cascio, W. F., 2000, Costing human resources: The financial impact of behavior in organizations, 4th ed., Cincinnati, OH, South-Western. |
| [33] | Dowling, P. J., and Welch, D. E., 2005, International human resource management: Managing people in a multinational context. 4th ed. Mason, OH, Thomson South-Western. |
| [34] | Weiss, H. M., 1990, Learning theory and industrial and organizational Psychology, Pp. 171–221, In M. D. Dunnette and L. M. Hough eds., Handbook of Industrial and Organizational Psychology, Vol. 1, Palo Alto, CA, Consulting Psychologists Press. |
| [35] | Donaldson, L., and Scanell, E., 1987, Human resource development: The new trainers guide. 2nd ed., New York, Addison-Wesley Publishing. |
| [36] | Yi, M. Y., and Davis, F. D., 2001, Improving computing training effectiveness for decision technologies: behavior modeling and retention enhancement, Decision Sciences, 32, 521-544. |
| [37] | Taylor, P. J., Russ-Eft, D., and Chan, D. W. L., 2005, A Meta-Analytic review of behavior modeling training, Journal of Applied Psychology, 90, 692–709. |
| [38] | Gist, M. E., Rosen, B., and Schwoerer, C., 1988, The influence of training method and trainee age on the acquisition of computer skills, Personnel Psychology, 41, 255-256. |
| [39] | Gist, M. E., Schwoerer, C., and Rosen, B., 1989, Effects of alternative training methods on self-efficacy and performance in computer software training, Journal of Applied Psychology, 74, 884-891. |
| [40] | Compeau, D. R., and Higgins, C. A., 1995, Application of social cognitive theory to training for computer skills, Information Systems Research, 6, 118-143. |
| [41] | Simon, S., and Werner, J., 1996, Computer training through behavior modeling, self-paced, and instructional approaches: A field experiment, Journal of Applied Psychology, 81, 648-659. |
| [42] | Simon, S., Grover, V, Teng, J., and Whitcomb, K., 1996, The relationship of information system training methods and cognitive ability to end-user satisfaction, comprehension, and skill transfer: A longitudinal field study, Information Systems Research, 7, 466-490. |
| [43] | Martin, B. O., Kolomitro, K., and Lam, T. C. M., 2013, Training methods: a review and analysis, Human Resource Development Review, 20, 1-25. |
| [44] | Blanchard, P.N., Thacker, J.W., and Way, S. A., 2000, Training evaluation: perspectives and evidence from Canada, International Journal of Training and Development, 4, 295-304. |
| [45] | Geber, B., 1995, Does Your Training Make a Difference? Prove It!, Training, March, 27–34. |
| [46] | Holton, E. F. III, 1996, The Flawed Four-Level Evaluation Model, Human Resource Development Quarterly, 7, 5–21. |
| [47] | Alliger, G. M., and Janak, E. A., 1989, Kirkpatric’s levels of training criteria: thirty years later, Personnel Psychology, 42, 331-342. |
| [48] | Alliger, G. M., Tannenbaum, S., Bennett, W. Jr., Traver, H., and Shotland, A., 1997, A meta-analysis of the relations among training criteria, Personnel Psychology, 50, 341-358. |
| [49] | Blanchard, P.N., and Thacker, J.W., 1999, Effective training: Systems, strategies, and practice, Upper Saddle River, NJ, Prentice Hall. |
| [50] | Dionne, P., 1996, The Evaluation of Training Activities: A Complex Issue Involving Different Stakes, Human Resource Development Quarterly, 7, 279–286. |
| [51] | Phillips, J.J., 1997, A Rational Approach to Evaluating Training Programs Including Calculating ROI, Journal of Lending and Credit Risk Management, 79, 43–50. |
| [52] | Salas, E., and Cannon-Bowers, J. A., 2001, The science of training: a decade of progress, Annual Review of Psychology, 52, 471–499. |
| [53] | Saks, A. M., and Burke, L. A., 2012, An investigation into the relationship between training evaluation and transfer of training, International Journal of Training and Development, 16, 118-127. |
| [54] | Van Buren, M. E., and Erskine, W., 2002, The 2002 ASTD state of the industry report. Alexandria, VA, American Society of Training and Development. |
| [55] | Scriven, M., 1991, Evaluation Thesaurus, 4th ed., Thousand Oaks, CA, Sage. |
| [56] | Beyer, B. K., 1995, How to conduct a formative evaluation. Alexandria, VA, Association for Supervision and Curriculum Development. |
| [57] | Hamblin, A. C., 1974, Evaluation and control of training, New York, NY, McGraw-Hill. |
| [58] | Newstrom, J., 1978, Catch 22: The Problems of Incomplete Evaluation of Training, Training and Development Journal, 32, 22–24. |
| [59] | American Society for Training and Development. (1996). Benchmarking Survey. Retrieved from:http:/www.astd.org/virtual_community/research/bench/96stats/graph1.gif |
| [60] | American Society for Training and Development. (1997). Executive Survey. Retrieved from:http:/www.astd.org/virtual_community/research/nhrd_exe cutive_survey_97me.htm. |
| [61] | Bassi, L., and Van Buren, M., 1999, Sharpening the leading edge, Training and Development, 53, 23-22. |
| [62] | ASTD National HRD Executive Survey Information Technology Training, 1998, Second Quarterly Survey Report, Washington, DC, American Society for Training and Development. |
| [63] | Okurowski, M. E., and Clark, R., 2008, The use of level III evaluation data to assess the impact of technology training on work performance, Performance Improvement Quarterly, 14, 57-76. |
| [64] | Weller, J., 1997, Return on investment of IT training: Realities, Research Note Tutorials, Stamford, CT, Gartner Group. Document #TU-390-162. |
| [65] | Pudaruth, S., Nagowah, L., Sungkur, R. K., Chiniah, A., 2010, An evaluation of a practical training course in IT at university level, International journal of Advanced Research in Computer Science, 1, 140-144. |
| [66] | Kraiger, K., Ford, J. K., and Salas, E., 1993, Application of cognitive, skill-based, and affective theories of learning outcomes to new methods of training evaluation, Journal of Applied Psychology, 78, 311–328. |
| [67] | Day, E. A., Arthur, W. Jr., and Gettman, D., 2001, Knowledge structures and the acquisition of a complex skill, Journal of Applied Psychology, 85, 678–707. |
| [68] | Moore, R. W., Blake, D. R., Phillips, G. M., and McConaughy, D., 2003, Moving beyond “The Four Levels”: A systems evaluation model for training programs, paper presented at the 44th annual conference of the Western Academy of Management, Palm Springs, CA. |
| [69] | Saari, L. M., Johnson, T. R., McLaughlin, S. D., and Zimmerle, D. M., 1988, A survey of management training and education practices in U.S. companies. Personnel Psychology, 41, 731–743. |
| [70] | Harrel, K. D., 2007, Level III training evaluation: Consideration for today’s organization. Performance Improvement, 40, 26-29. |
| [71] | Okurowski, M. E., and Clark, R., 2008, The use of level III evaluation data to assess the impact of technology training on work performance, Performance Improvement Quarterly, 14, 57-76. |
| [72] | Lipper, R. M., Radhakrishna, R., Plank, O., and Mitchell, C. C., 2001, Using different evaluations tools to assess a regional Internet inservice training, International Journal of Instructional Media, 28, 237-248. |
| [73] | Tan, J. A., Hall, R. J., and Boyce, C., 2003, The role of employee reaction in predicting training effectiveness, Human Resource Development Quarterly, 14, 397-411. |
| [74] | Campbell, J. P., McCloy, R. A., Oppler, S. H., and Sager, C. E., 1993, A theory of performance, Pp. 35-70, In N. Schmitt and W. C. Borman eds., Personnel selection in organizations, San Francisco, Jossey-Bass. |
| [75] | Alliger, G. M., and Tannenbaum, S. I., 1995, A meta-analysis on the relations among training criteria. Pp. 45-36, In M. Teachout (Chair), Meta-analytic investigations of training effectiveness, Symposium conducted at the annual convention of the American Psychological Association, New York. |
| [76] | Dixon, N. M., 1990, The relationship between trainee responses on participant reaction forms and posttest scores. Human Resource Development Quarterly, 1, 129–137. |
| [77] | Colquitt, J. A., LePine, J. A., and Noe, R. A., 2000, Toward an integrative theory of training motivation: A meta-analytic path analysis of 20 years of research. Journal of Applied Psychology, 85, 678–707. |
| [78] | Tan, J. A., 2002, The role of planned behavior and goal orientation theory in a training context, Dissertation Abstracts International, 62, 3409. |
| [79] | Burke, L. A., and Hutchins, H. M., 2008, A study of best practices in training transfer and proposed model transfer, Human Resource Development Quarterly, 19, 107-128. |
| [80] | Alvarez, K., Salas, E., and Garofano, C. M., 2014, An integrated model for training evaluation and effectiveness, Human Resource Development Review, 3, 385-416. |
| [81] | Van den Bossche, P., Segers, M., and Jansen, N., 2010, Transfer of training: the role of feedback in supportive social networks, International Journal of Training and Development, 14, 81–94. |
| [82] | Velada, R., Caetano, A., Michael, J. W., Lyons B. D., and Kavanagh, M. J., 2007, The effect of training design, individual characteristics and work environment on transfer of training, International Journal of Training and Development, 11, 282-294. |
| [83] | Olsen, J. H., 1998, The evaluation and enhancement of training transfer, International Journal of Training and Development, 2, 61-75. |
| [84] | Fitzpatrick, R., 2001, The strange case of the transfer of training estimate, Industrial-Organizational Psy-chologist, 39, 18–19. |
| [85] | Georgenson, D. L., 1982, The problem of transfer calls for partnership, Training and Development Journal, 36, 75–78. |
| [86] | Wexley, K. N., and Latham, G. P., 2002, Developing and training human resources in organizations, Englewood Cliffs, NJ, Prentice Hall. |
| [87] | Saks, A. M., and Belcourt, M., 2006, An investigation of training activities and transfer of training in organizations, Human Resource Management, 45, 629-648. |
| [88] | Dolezalek, H., 2004, Training annual industry report. Training Magazine, 42, 10. |
| [89] | Ramsden, P., 1992, Learning to teach in higher education, London, Routledge. |
| [90] | Robinson, C.C., and Hullinger, H., 2008, New benchmarks in higher education: Student engagement in online learning, J. Educ. Bus., 84, 101–109. |
| [91] | Kekkonen-Moneta, S. and Moneta, G. B., 2002, E-learning in Hong Kong: comparing learning outcomes in online multimedia and lecture versions of an introductory computer course, British Journal of Educational Technology. 33, 423 – 434. |
| [92] | Straus, S. G., 1996, Getting a clue: The effects of communication media and information distribution on participation and performance in computer-mediated and face-to-face groups, Small Group research, 27, 115 – 141. |
| [93] | Hiltz, S. R., 1998, Collaborative learning in asynchronous learning networks: Building learning communities, In Proceedings: WebNet 98 World Conference of the WWW, Internet and Intranet, Orlando, FL, (ERIC Document Reproduction Service ED 427 705). |
| [94] | Dennis, J. K., 2003, Problem-based learning in online vs face-to-face environments, Education for Health, 16, 198-209. |
| [95] | Dillon, K., Dworkin, J., Gengler, C., and Olson, K., 2008, Online or Face to Face? A Comparison of Two Methods of Training Professionals, Journal of Family and Consumer Sciences, 100, 28-33. |
| [96] | Kemp, N. and Grieve, R., 2014, Face-to-face or face-to-screen? Undergraduates' opinions and test performance in classroom vs. online learning, Frontiers Research Foundation, 5, 1-11. |
| [97] | Davies, J., and Graff, M., 2005, Performanceine-learning: online participation and student grades, Br. J. Educ. Technol., 36, 657–663. |
| [98] | Braun, V., and Clarke, V., 2006, Using the maticanalysis in psychology. Qual. Res. Psychol., 3, 77–101. |