-
Paper Information
- Previous Paper
- Paper Submission
-
Journal Information
- About This Journal
- Editorial Board
- Current Issue
- Archive
- Author Guidelines
- Contact Us
Education
p-ISSN: 2162-9463 e-ISSN: 2162-8467
2014; 4(4): 88-94
doi:10.5923/j.edu.20140404.02
The Effects of Item Difficulty and Examinee’s Ability on the Effectiveness of ECIZ4 Appropriateness Index
 Abstract
 Reference
 Full-Text PDF
 Full-text HTML
Korir Daniel K.
Department of Educational Psychology, School of Education, Moi University, P O Box 3900, Eldoret – Kenya
Correspondence to: Korir Daniel K., Department of Educational Psychology, School of Education, Moi University, P O Box 3900, Eldoret – Kenya.
| Email: |  |
Copyright © 2014 Scientific & Academic Publishing. All Rights Reserved.
This study examined the effectiveness of ECIZ4 appropriateness index in detecting aberrant response patterns under nine combinations of item difficulty and examinee’s ability distributions, type of aberrance, and level of aberrance. Data was generated in nine combinations of item difficulty and examinee ability to simulate the responses of 2000 non-aberrant examinees’ response patterns to a 60-item test according to three-parameter model. Three uniform distributions of item difficulty were used. Two samples each consisting of 500 normal response vectors (one for spuriously low and one for spuriously high modifications) were also generated in each of the nine combinations and subjected to spurious treatment. An examinee with a spuriously high test score was simulated by selecting 20% or 10% of the examinee's original responses without replacement and changing incorrect answers to correct, but they were left unchanged if correct. An examinee with a spuriously low test score was simulated by first randomly selecting 20% or 10% of the examinee's original responses without replacement and changing correct responses to incorrect, but they were left unchanged if incorrect. ECIZ4 appropriateness indices were then computed for the aberrant response vectors. The effectiveness of ECIZ4 index was evaluated by examining the extent to which it separated normal and aberrant response vectors solely on the basis of appropriateness index scores. The percentile estimates obtained for each index at each false positive rate were used as cutoff scores. The ECIZ4 index identified higher proportions of aberrant response patterns in the 20% spuriously low treatment samples than in the 20% spuriously high treatment samples. Ten percent spuriously low aberrant response samples were also found to be more than the 10% spuriously high aberrant response patterns. The detection rates of the 20% and the 10% spuriously high aberrant response patterns by ECIZ4 index were found to be higher under high item difficulty parameters, and were found to be low under the low item difficulty parameters. This is not surprising as it is expected that more responses are changed from incorrect to correct and fewer responses are changed from correct to incorrect under high item difficulty parameters. The 20% and the 10% spuriously low aberrant response patterns were also more detectable under the low item difficulty parameters because more responses are changed from correct to incorrect and fewer are changed from incorrect to correct under the low item difficulty parameters.
Keywords: Appropriateness index, Person-fit index, Caution Index, Validity, Effectiveness
Cite this paper: Korir Daniel K., The Effects of Item Difficulty and Examinee’s Ability on the Effectiveness of ECIZ4 Appropriateness Index, Education, Vol. 4 No. 4, 2014, pp. 88-94. doi: 10.5923/j.edu.20140404.02.
Article Outline
1. Introduction
- A test is a systematic procedure for measuring a sample of examinee’s behavior. In the strictest sense, a test measures only test taking behavior, that is, the responses a person makes to the test items. A person is not measured directly; rather a person's characteristics (traits) are inferred from his or her responses to a test. If the behaviors exhibited on the test adequately mirror the construct being measured, the test will provide useful information. If the test does not adequately reflect the underlying characteristics, inferences made from test scores are inappropriate. A test score in a multiple choice test can only be useful in estimating person ability if the person's pattern of responses to the items corresponds to his or her expected response pattern. For instance, if the test consists of k dichotomous items arranged in ascending order of difficulty (from easy to difficult), then someone who gets x of the items right is expected to have answered the first x items correctly and the last k-x items incorrectly. If it is the easy items that he or she gets wrong, his or her pattern is regarded as deviating from the expected pattern. Therefore, a score with such a response pattern is said to be inappropriate in estimating the person's ability. There are many factors that can make a person's response inappropriate. Among them is how clearly the instructions are understood by the examinee, familiarity with test materials and with the concepts used, previous experience with test tasks or with similar tasks and with working under pressure, and motivational factors [1]. Birenbaum [2] notes different causes of aberrant (unexpected) response patterns; misconceptions concerning the subject matter, cultural bias, test anxiety, exceptional creativity, lack of concentration resulting in carelessly reading the questions, guessing, and occasional copying a more able neighbour's work. Wright [3] mentions tendencies such as sleeping, fumbling, and plodding as causes of unusual response patterns. He defines sleeping as those examinees that get bored with a test and do poorly in the beginning because of confusion with test format. Examinees who never get to the latter items on the test are plodders. Unusual response patterns can also result from technical problems such as answer sheet alignment. However, these factors jeopardize the validity of the response patterns and they are not directly reflected by a total test score. Checking the validity of the response pattern therefore becomes a necessity for ensuring an accurate assessment of performance. This validity check of response patterns is done with the help of appropriateness indices which provide automated means for identifying response patterns where total test score may provide misleading information.
2. Review of the Literature
- Several indices for detecting aberrant (unusual) response patterns have been developed. These indices describe the degree to which an individual's pattern of item responses is unusual. These indices can be classified into two groups. One group consists of indices based solely on the actual observed response patterns of the group of examinees. Examples of these indices include Sato's caution index [4], Van der flier's U''' index [1], Donlon and Fischer’s personal biserial [5], Tatsuoka and Tatsuoka's norm conformity index [6] , and Harnish and Linn's modified caution index [7]. The other group consists of indices based solely on Item Response Theory (IRT) models. Examples of these indices are the fit indices developed by Wright and his associates [3], the appropriateness indices developed by Levine and Rubin [8], and the group of extended caution indices developed by Tatsuoka and Linn [7]. The first group of these indices is group dependent; the second group is IRT based. IRT based appropriateness indices can be sub divided into:(1) unstandardized and standardized extended caution indices, (2) maximum likelihood indices, and (3) Person fit indices. Most of the previous researchers in appropriateness measurement have compared the effectiveness of appropriateness indices [8, 9, 10, 2, 11, 12, 13, 14, and 15]; others have investigated the distribution of appropriateness indices under different conditions of item and ability parameters [16, 17, 11]. Recent studies in appropriateness measurement have investigated the distributions and effectiveness of IRT based indices in varying conditions of testing. In this study, the effects of item difficulty and examinee ability on the effectiveness of the fourth standardized extended caution index (ECIZ4) was investigated. Extended caution indices have been developed from Sato's caution index. In the extended caution indices, the ideal response curves are replaced by examinee response curves theoretically derived from IRT. The response curve for examinee is obtained by holding a (item discrimination) constant and considering b (item difficulty) as a continuous variable in the logistic function. Intuitively, the examinee response curve at a fixed level of corresponds to a step function whose values equal one for b and zero for b. The six extended caution indices which have been developed are ECI1, ECI2, ECI3, ECI4, ECI5, and ECI6.However, the effectiveness of unstandardized extended caution indices were found to be related to examinee’s ability level. Hence, Tatsuoka & Tatsuoka [18] standardized the extended caution indices by subtracting their expected values and then dividing by their standard errors. These indices are denoted by ECIZ1, ECIZ2, ECIZ3, ECIZ4, ECIZ5, and ECIZ6. The fourth standardized extended caution index can be computed relatively easily. Let Өi denote the one, two or three parameter logistic maximum likelihood estimate of Ө for the ith person in the test norming sample of N examinees, and let Pij(Ө) be the probability of a correct response to item j by this ith examinee. ECIZ4 is then defined as follows:
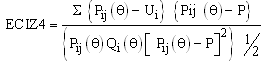
 Where the distribution of the fourth standardized extended caution index (ECIZ4) have been reported to approximate a normal distribution and to be least related linearly or curvilinearly to the total test score, an indication that it provides non-redundant information [11, 12, 19, 14].
 3. Methods
- Simulated data were used in this study. Data were generated according to the three parameter model to simulate the responses of examinees to 60 multiple choice items using Datagen, a fortran computer program developed by Hambleton and Rovinelli [20]. In previous research, the three parameter logistic model has been found to be adequate for modeling the multiple choice items on the Scholastic Aptitude Test Verbal section [11, 8, 19, 9], Graduate Record examination Verbal Section [11, 19] and simulated data [14, 15]. The LOGIST computer program [21, 22] was used to estimate item parameters.To evaluate the effectiveness of appropriateness indices, most researchers have used the design devised by Levine and Rubin [8]. In this design, a study begins with the test norming sample that consists of N examinees' responses (either real or simulated) to n items. Item parameters for a test model are estimated using the test norming sample. These item parameter estimates are then used to estimate examinee's ability and to compute appropriateness indices. A similar design was employed in this study and a FORTRAN77 program written by Drasgow [11] was used to compute ECIZ4 scores. In this study, the effects of item difficulty and examinee‘s ability distributions on the effectiveness of ECIZ4 appropriateness index was investigated. Hoijtink [17] using the Rasch model, reported that examinees ability and item difficulty distributions affect the effectiveness of appropriateness indices. Molenaar and Hoijtink [23], using the Rasch model, reported that examinees ability distributions affect the effectiveness of ECIZ4 index. Three distributions of item difficulty were used. These distributions were those which are usually found in real life situations and they were generated to simulate the distributions of items typical of diagnostics tests (items used to identify students who need remedial courses), power (placement) tests, and certification and licensing tests. Items typical of diagnostic tests were generated to have uniform distributions in the interval -3.0 to + 1.2. These test items were expected to provide maximum information (differentiate) at the low ability range. Item difficulties typical of those found with power tests were generated to have a uniform distribution in the interval -3.0 to +3.0.These items were expected to provide equal information (differentiate) over the ability range [1]. Item difficulties typical of those found with certification and licensing examinations were generated in such a manner that they would provide maximum information at the high ability range. They were generated to have a uniform distribution in the interval +1.2 to +3.0. In summary, all the three distributions of item difficulties were generated to have uniform distributions. Uniform distribution of item difficulties is what to be expected for most tests. Since the objective of this study was to investigate the effects of item difficulty and ability distributions and not item discrimination or the guessing parameters, the same distributions of item discrimination and guessing parameters and within the same interval were used for each replication. In all the applications, the discrimination parameters were generated in such a manner that +0.60 to +1.50 and to have uniform distributions. The guessing parameters were generated in such a manner that 0.05 to 0.20 and to have uniform distributions. Such distributions of guessing parameters are typical of five option multiple choice tests. Three distributions of ability were considered. In each replication, a normal distribution of examinees’ ability with a standard deviation of 0.6 but with different means was used. Molenaar et al. [16] in a simulation study found that the distributions of appropriateness indices were affected by the position of the mean and the standard deviation of the examinees' ability distribution even when the examinees' ability distribution remained normal. The ability distributions used were those typical of low, medium, and high ability examinees. Thetas typical of low ability examinees were generated to have normal distributions with a mean of 1.2 with a standard deviation of 0.6. Medium ability thetas typical of medium ability examinees were generated to have a normal distribution with a mean of zero and a standard deviation of 0.6. High ability thetas typical of high ability examinees were generated to have a normal distribution with a mean of +1.2 and a standard deviation of 0.6. To examine the effects of item difficulty and examinee ability distributions on the effectiveness of ECIZ4 appropriateness index, data were generated in nine combinations of item difficulty and examinee ability distributions. In each replication, data were generated to simulate the responses of 2000 examinees to 60 test items according to the three-parameter model. LOGIST [21] was used to estimate item parameters. ECIZ4 appropriateness indices were computed for each examinee in each of the nine combinations of item difficulty and examinee ability distributions. The values of ECIZ4 at the 99th, 95th, 90th, and 75th percentile points were also computed. A total of 50 replications were used in each combination. The means and standard deviations were computed over the 50 replications for the four percentiles of each index. These statistics were used to determine the cutoff scores of ECIZ4 index under the varying conditions of item difficulty and examinee ability distributions. To examine the effectiveness of ECIZ4 appropriateness index in detecting aberrant response patterns under different combinations of item difficulty and examinee ability distributions, type of aberrance, and level of aberrance, response vectors were generated using Datagen. Two samples each consisting of 500 normal response vectors (one for spuriously low and one for spuriously high modifications) were also generated in each of the nine combinations and subjected to spurious treatment. An examinee with a spuriously high test score was simulated by selecting 20% or 10% of the examinee's original responses without replacement and changing incorrect answers to correct, but they were left unchanged if correct. An examinee with a spuriously low test score was simulated by first randomly selecting 20% or 10% of the examinee's original responses without replacement and changing correct responses to incorrect, but they were left unchanged if incorrect. ECIZ4 appropriateness indices were then computed for the aberrant response vectors. The effectiveness of ECIZ4 index was evaluated by examining the extent to which it separated normal and aberrant response vectors solely on the basis of appropriateness index scores. The percentile estimates obtained for each index at each false positive rate were used as cutoff scores.
4. Results
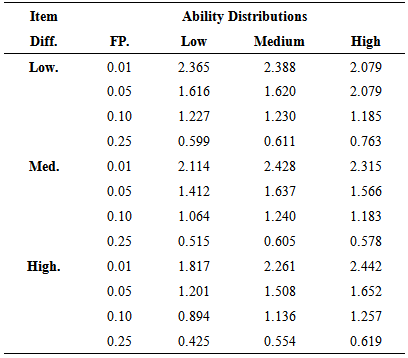
- Table 1 present the 99th, 95th, 90th, and 75th percentile estimates of ECIZ4 over 50 replications. As shown in table 1, the four percentile estimates of ECIZ4 were found to be different from the expected values. Except for very few cases, the 95th, 90th and 75th percentile estimates of ECIZ4 were less than the expected values 0f 1.65, 1.29 and 0.68 respectively. The 99th percentile estimates did not show any pattern in terms of its magnitude. The results also showed that the percentile estimates of ECIZ4 deviated most when the item difficulty parameters did not match the ability distributions. For example, very low percentile estimates were observed under combinations of low item difficulty and high ability distributions and under combinations of high item difficulty and low ability distributions, suggesting that item difficulty and ability distributions have some impact on the percentile estimates.
|
|

5. Discussion
- The results of the detection rates of ECIZ4 appropriateness indices in this study are consistent with the results reported by researchers such as Drasgow et al. [11], Rudner [9], Noonan [14], and Candell and Levine [15]. In particular, the high detection rates of ECIZ4 confirm the findings of Noonan [14]. The power of the ECIZ4 index and the tendency to identify larger proportions of aberrant response patterns with spuriously high scores is also consistent with the findings of Rudner [9]), Birenbaum [2], and Drasgow et al. [11]. The ECIZ4 index identified higher proportions of aberrant response patterns in the 20% spuriously low treatment samples than in the 20% spuriously high treatment samples. Ten percent spuriously low aberrant response samples were also found to be more than the 10% spuriously high aberrant response patterns. The detection rates of the 20% and the 10% spuriously high aberrant response patterns by ECIZ4 index were found to be higher under high item difficulty parameters, and were found to be low under the low item difficulty parameters. This is not surprising as it is expected that more responses are changed from incorrect to correct and fewer responses are changed from correct to incorrect under high item difficulty parameters. The 20% and the 10% spuriously low aberrant response patterns were also more detectable under the low item difficulty parameters because more responses are changed from correct to incorrect and fewer are changed from incorrect to correct under the low item difficulty parameters. The detection rates of ECIZ4 index were found to increase as a function of both ability distributions and item difficulty parameters. Under combination of low ability distributions and high item difficulty parameters, ECIZ4 could detect 23%, 43%, 54%, and 71% at the corresponding false alarm rates of 1%, 5%, 10% and 25% respectively. Under the same ECIZ4 could detect 6%, 18%, 28% and 50% of the 10% spuriously high response patterns at the corresponding false alarm rates of 1%, 5%, 10% and 25% respectively. This suggests that ECIZ4 index performs better in detecting aberrant response patterns in the spuriously high treatment samples. For the case of the 20% spuriously low aberrant response patterns, ECIZ4 had high detection rates of 36%, 56%, 64% and 78% under the combination of low item difficulty parameters and high ability distributions at the corresponding false alarm rates of 1%, 5%, 10% and 25% respectively. The corresponding detection rates of 10% spuriously low aberrant response patterns were 13%, 30%, 39% and 57% for. The ECIZ4 index had very low detection rates of spuriously low treatment samples under the combination of high item difficulty and low ability distributions. It is quite difficult to compare the detection rates obtained in this study with those obtained by other researchers because of a number of reasons. First, previous researchers used different experimental conditions from the ones considered in this study. Majority of them assumed that the examinee ability distributions are always normal (0, 1), a situation which is not always true. They also assumed that tests are always constructed to cover a wide range of item difficulty parameters. But different needs demand different tests. Hence, in this study, item difficulty and ability distributions were manipulated. Secondly, most previous reseachers used different levels of aberrance. Noonan [14] used 30%, 15% and 10%; Drasgow et al. [11] used 10%, 20% and 30%. In this study only two levels of aberrance (10% and 20%) were considered. However, the high detection rates found in this study are consistent with the previous reported results.
6. Recommendations to Practitioners
- Considering the results of the present study, the following recommendations can be made: 1. ECIZ4 index could be used to detect spuriously low and spuriously high aberrant response patterns if a test consists of items with low and moderate item difficulties. 2. Cutoff scores should be established using a large population. However, this study has shown that cutoff scores can vary according to the side conditions of testing. Therefore, test users should see to it that cutoff scores are reviewed regularly.
7. Limitations of the Study
- The first limitation of this study is that simulated data were used. Future researchers can replicate the study using real data. The second limitation is that it was assumed in this study that all the examinees reached and attempted all the questions. However, this doesn’t usually happen in real life. Future researchers can use data matrix containing omits. Thirdly is that only one distribution of item difficulties (uniform) with varying intervals was considered. Future researchers could use skewed or normal distributions of item difficulties.Fourth is that examinee ability distributions were restricted to normal distributions with different means but with the same standard deviation. However, it is possible to have other types of ability distributions in real life situations. The fifth limitation is that data were generated according to the three parameter model. One and two parameter models could also be used for future research. Further, spuriously high and spuriously low scores were analysed separately. In real life, a sample may have some examinees with spuriously high scores and others with spuriously low scores. This would presumably affect the detection rates. Finally, the combined effects of test length, item difficulty and examinee ability on the distributions and effectiveness of LZ and ECIZ4 should be investigated [2]. Comparing the effectiveness of several IRT based appropriateness measures in detecting unusual response patterns.