Education

p-ISSN: 2162-9463    e-ISSN: 2162-8467

2013;  3(1): 43-67

doi:10.5923/j.edu.20130301.07

Comparative Analysis on Reaction of Students on Computer Assisted Instruction for Teaching Arithmetic with Different Modes

Pramila Ramani 1, Harsha Patadia 2

1Navrachana University, School of Science and Education B.Sc., B.Ed Programme Vasna Road, Vadodara, 391410 ,Gujarat, India

2Department of Education, CASE, The M.S.University of Baroda, Vadodara, 390002,Gujatat, India

Correspondence to: Pramila Ramani , Navrachana University, School of Science and Education B.Sc., B.Ed Programme Vasna Road, Vadodara, 391410 ,Gujarat, India.

Email:

Copyright © 2012 Scientific & Academic Publishing. All Rights Reserved.

Abstract

Investigators have conducted a true experimental study to compare the academic performance of students of class VIII in one of the English medium school of Vadodara, India. A comparison was made among traditional instruction, only Computer Assisted Instruction (CAI) and Computer Assisted Instruction with simultaneous discussion. The design used in this study was post-test only control group design. Three sections of class VIII were selected and the groups were randomly assigned. Students studied in their respective methods till the completion of the selected units. Reaction Scale was developed and administered to the students to know the effectiveness of the developed CAI. Data was analysed using Chi Square and percentage. From the comparative analysis of the reaction scale it was found that students liked their respective ways of learning. Investigators observed that students enjoyed learning mathematics through CAI.

Keywords: Computer Assisted Instruction, Effectiveness, Self-Learning Material and Auto Instruction

Cite this paper: Pramila Ramani , Harsha Patadia , Comparative Analysis on Reaction of Students on Computer Assisted Instruction for Teaching Arithmetic with Different Modes, Education, Vol. 3 No. 1, 2013, pp. 43-67. doi: 10.5923/j.edu.20130301.07.

1. Introduction

Education gives skill and competency to the individual for a successful living. It is an instrument of social change, modernization, development, economic and social development of a country. The 21st century world can be called a scientific world, advancing rapidly in information technology, medicine, engineering, space communication, astronomy, astrophysics, artificial intelligence, robotics and many other disciplines.
Our country requires technically skilled manpower. For all disciplines mathematics is the base. India has a rich Mathematical heritage. An Instrument was actually used for drawing circles in the Indus valley as early as 2500 BC. Several significant contributions to the world of mathematics have been made during the last two millennia, for example, by Aryabhata I(475 AD), Brahma Gupta(7th Century), Mahavira(850AD), Bhaskara II(1150), Madhava(14th Century), Ramanujan(1887-1920).[1] also emphasizes that mathematics should be visualized as the vehicle to train a child to think, reason, analyze and articulate logically, apart from being a specific subject it should be treated as concomitant to any subject involving analysis and reasoning. Yet many school students find difficulty with learning of mathematics and fail in mathematics. A major reason for the failure is that the teachers quite often pay no attention to the basic concepts and generally adopt methods of solving questions with crammed up formulae. In order to overcome the difficulties faced by the students, teacher should adopt different methodology in teaching of mathematics like drill method, using different audio visual aids, computer aided instruction, mathematical club etc. One of the methods is auto-instructional method. It is a method of individualized instruction. One of its forms is CAI (Computer Assisted/Aided Instruction) auto instructional teaching. It is very useful to the teachers and the students as it lessens the burden of teaching and learning and it makes teaching and learning interesting. It also helps the students to learn at their own pace and at their own convenience. It motivates the students and increases the enthusiasm of the students. In this method students read different frames and answer the questions that follow and by this way they learn automatically. Even the learning that takes place through CAI is accurate and untiring. The most beneficial part of CAI is it provides the mixture of wide range of visual, graphics and pictures to make the teaching learning more interesting. Researchers have developed the Computer Assisted Instruction for teaching and learning mathematics for class VIII students in arithmetic part and tested the reaction of students on the developed material.

2. Importance of Mathematics

Epistemologically mathematics means mathema- explaining and understanding, tics-techniques such as counting, ordering, sorting, and measuring. Right from pre historic period there have been problems to solve. Problems may be over basic requirements like food, water, shelter or accomplishment like constructing multi-storied building. Mathematics is part and parcel of daily life. Mathematics is used in learning almost all subjects. We cannot imagine learning engineering disciplines without mathematics. Biology, medicine, computer, science, economics etc. all use mathematics. The revolution in information and technology is due to advancement in mathematics. Statistics uses mathematics for analyzing of data. Different commissions have given different views on the place of mathematics. Arithmetic is an important part of mathematics. Its forms the base of algebra so we can conclude that learning arithmetic thoroughly helps students to learn algebra easily. In this modern era we cannot think of a field, where calculation or computation is not used. Knowingly or unknowing we use mathematics in our day to day life. It ranges from household to industries, business, education, science and technology, art and craft and even in music, dance etc.

3. Computer Assisted Instruction in Learning Mathematics

ICT (Information and Communication Technology) has great potential for teaching and learning process at all levels. The use of ICT has enriched the teaching learning process with the help of computer. It has brought a great change, innovativeness, and creativity in teachers in teaching learning process. Mathematics and computer are both important in today’s life as they open the gate of ample opportunities in this modern world. Mathematics is widely used in computers both in hardware and software. Computer helps in improving the knowledge of mathematics. Computer helps in making classroom teaching lively.
Computer can play vital role in learning process as it can work with the imagination of students. Any concept in mathematics can be explained with the help of pictures and this visual image can help in understanding the concept at ease. In paper pencil method student can get bored easily and can find it difficult to practice the sum again and again. CAI works as a change and increases the curiosity of students and they can learn interestingly without any difficulty. Also whatever is learnt through computer aided instructions, the contents can be retained for longer time as they use more senses of the students.[2] CAI brings with it several potential benefits as a teaching/learning medium. These include self-paced learning, self-directed learning, the exercising of various senses and the ability to represent content in a variety of media. Humans are multi-sensory animals. Certain chapters like Profit and loss, Simple and compound interest can be explained very easily using CAI. Varity of exercises can be provided and this ensures active involvement of the students. The material can be provided according to the needs of the students.

4. Rationale of the Study

Many studies have been conducted on low achievements in mathematics. [3]Author has studied the low results in mathematics at Secondary Examination in Rajasthan and found that the cause of failure was non-availability of mathematics teachers due to late appointments and frequent teacher transfers; lack of appropriate classrooms. [4]Author has found that the causes responsible for under achievements were gaps in knowledge of concepts, difficulties in understanding of mathematics language. These studies clearly show that students find difficulty in learning mathematics and there is a need to develop some self learning material to make learning easy. Many studies have been conducted to find out the effectiveness of CAI in terms of achievement of the students in learning. [5]Author found that experimental group performed better on post test. The studies conducted by [6-16] authors showed that CAI was effective than conventional method. [17] Author in his study found that mathematics learning through CAI with Peer Instruction (CAIPI) was effective on post-test. [18] Author found that there was no statistically significant difference in the post-test scores of students receiving traditional instruction and traditional instruction supplemented with computer assisted instruction.
Results of the present study may initiate changes in teaching and learning mathematics, in the instructional modes in order to enhance mathematical achievement for all students. With information about the potential impact of computer assisted instruction, institutions can invest their resources wisely. In addition, it may lead to investigation on students’ highest achievement in the various delivery formats.

5. Methodology of the Study

5.1. The Present Study Entitles

Comparative Analysis on Reaction of Students on Developed Computer Assisted Instruction for Teaching Arithmetic。

5.2. Objectives of the Study

1). To study the effectiveness of the developed CAI in terms of Experimental Group A (only CAI) (Exp A) students’ response to the reaction scale.
2). To study the effectiveness of the developed CAI in terms of Experimental Group B (CAI with simultaneous Discussion) (Exp B) students’ response to the reaction scale.
3). To study the relative effectiveness of the developed CAI in terms of Experimental Group A (only CAI) students’ response to the reaction scale and that of Experimental Group B(CAI with simultaneous Discussion).

5.3. Hypotheses of the Study

H0: There is no significant difference between Experimental group A and Experimental group B towards effectiveness of the developed CAI.

5.4. Delimitation of the Study

The present study was delimited to standard VIII English Medium GSHSEB students and only arithmetic unit of the mathematics textbook in the year 2010 was covered during experimentation of the present study.

5.5. Design of the Study

The study adopts the post test only control group design.

5.6. Population of the Study

There are 61 grant-in-aid schools in the city of Vadodara, functioning under the Gujarat State Board of secondary and Higher Secondary Education (GSHSEB) following the rules and regulations laid by the Ministry of Human Resources of the Government of India. The population of the study consists of all the Standard VIII English medium students of GSHSEB of Vadodara city in the year 2010.

5.7. Sample and Procedure of the Study

One school in the urban area was selected on the basis of the computer facilities available in their campus for conducting the experiment. Random sampling technique was used to select groups by the researchers in this study. The experimental group A consisted of 28 students and experimental group B consisted of 25 students. Experimental Group A studied through the developed CAI. Experimental Group B studied through the developed CAI along with simultaneous discussions. The total sample for the experiment consisted of 53 students. Students in both the groups learned the same topics viz ‘Profit and Loss’ and ‘Simple and Compound Interest' through the respective instructional strategy. Experiment time duration was 30 periods for both the groups.

5.8. Tools for Data Collection

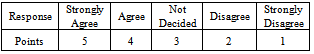
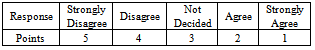
1) Computer Assisted Instruction developed by the Investigator and modified according to the comments given by experts in mathematics, mathematics education, English and Computer Science
2) Reaction Scale developed by the Investigator and modified according to the comments given by the expert in English.

5.9. Plan and Procedure of Data Collection

Step 1: One of the English medium school of Vadodara, India following GSHSEB syllabus class VIII students were selected purposively having the required facility to conduct the experiment.
Step 2: Students were divided randomly into three groups control group taught by usual conventional method, Experimental Group A (only CAI) and Experimental Group B( CAI with simultaneous discussion).
Step 3: Students were taught in their respective methods for a month for the completion of the selected arithmetic unit.
Step 4: Reaction scale was administered to the students and their response was collected and analysed.

6. Data Analysis

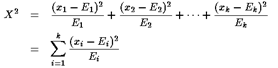
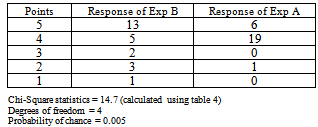
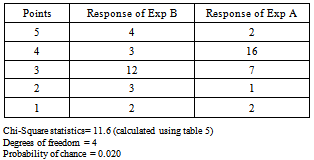
Data was analysed through the statistical technique χ2.The Chi Square statistic compares the tallies or counts of categorical responses between two (or more) independent groups.
[19] Chi-square is a statistical test commonly used to compare observed data with data we would expect to obtain according to a specific hypothesis. Then we might want to know about the "goodness to fit" between the observed and expected. Were the deviations (differences between observed and expected) the result of chance, or were they due to other factors. How much deviation can occur before you, the investigator, must conclude that something other than chance is at work, causing the observed to differ from the expected? The chi-square test is always testing what scientists call the null hypothesis, which states that there is no significant difference between the expected and observed result. 
Most common application for chi-squared is in comparing observed counts of particular cases to the expected counts.
We can calculate X2:

6.1. Comparative Analysis of Reaction Scale

Table 1. Positive Polarity Statements are given Points as follows
     
Table 2. Negative polarity statements are given points as follows
     
Statement 1: I enjoyed this class compared to normal classroom teaching because this method is more interesting to understand than lectures.
Table 3. Response for Statement 1
     
Table value of Chi Square at 3df at .05 significance level is 7.815. Calculated value of Chi Square is less than the table value therefore, Null hypothesis is not rejected. This reveals that there is no significant difference observed between Experimental group A and Experimental group B towards effectiveness of the developed CAI for the given statement.
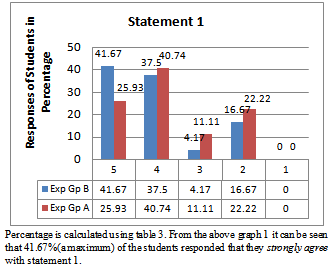
Graph 1. Graphical Representation of analysis of statement 1
Statement 2: I like illustrations given in the slides, which actually made me learn the lesson.
Table 4. Response for Statement 2
     
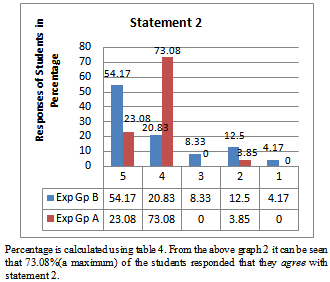
Graph 2. Graphical Representation of analysis of statement 2
Table value of chi square at 4df at .05 significance level is 9.488. Calculated value of Chi Square is more than the table value therefore, Null hypothesis is rejected. This revealed that there is significant difference observed between Experimental group A and Experimental B towards effectiveness of the developed CAI for the given statement.
20.83% students’ of Exp B ‘agree’ where as 73.08% students’ of the Exp A ‘agree’ with the statement 2. More load is on ‘agree’ of the Exp A which implies that they found CAI more effective than the Exp B.
Statement 3: Illustrations didn’t help me to relate what we learned in mathematics to real life situation.
Table 5. Response for Statement 3
     
Table value of chi square at 4df at .05 significance level is 9.488.Calculated value of Chi Square is more than the table value therefore, Null hypothesis is rejected. This revealed that there is significant difference observed between Experimental group A and Experimental B towards effectiveness of the developed CAI for the given statement.
12.50% students’ of Exp B ‘agree’ where as 57.14% students’ of the Exp A ‘agree’ with the statement 3. More load is on ‘agree’ of the Exp A which implies that they found CAI more effective than the Exp B.
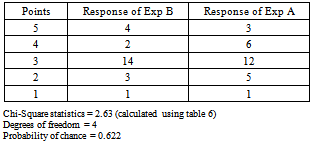
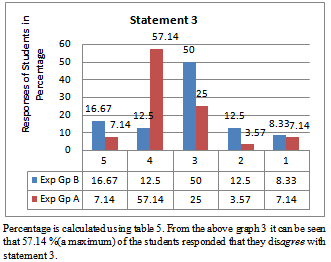
Graph 3. Graphical Representation of analysis of statement 3
Statement 4: CAI is effective way of presentation because there is little stress in learning situation.
Table 6. Response for Statement 4
     
Table value of Chi Square at 4df at .05 significance level is 9.488.Calculated value of Chi Square is less than the table value therefore, Null hypothesis is not rejected. This revealed that there is no significant difference observed between Experimental group A and Experimental group B towards effectiveness of the developed CAI for the given statement.
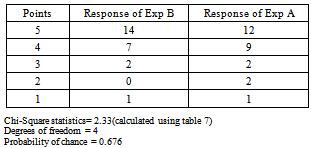
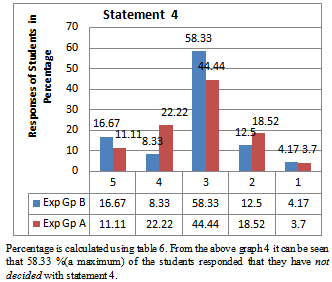
Graph 4. Graphical Representation of analysis of statement 4
Statement 5: I can learn with my own speed.
Data: contingency table.
Table 7. Response for statement 5
     
Table value of chi square at 4df at .05 significance level is 9.488.Calculated value of Chi Square is less than the table value therefore, Null hypothesis is not rejected. This revealed that there is no significant difference observed between Experimental group A and Experimental B towards effectiveness of the developed CAI for the given statement.
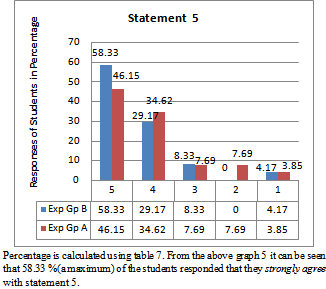
Graph 5. Graphical Representation of Analysis of Statement 5
Statement 6: I can immediately test myself because there is lot of practice exercise.
Table 8. Response for statement 6
     
Table value of Chi Square at 3df at .05 significance level is 7.815. Calculated value of Chi Square is less than the table value therefore, Null hypothesis is not rejected. This revealed that there is no significant difference observed between Experimental group A and Experimental B towards effectiveness of the developed CAI for the given statement.
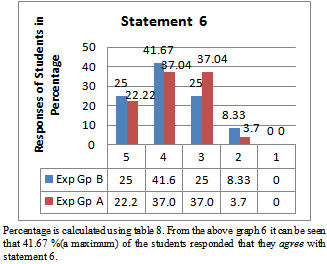
Graph 6. Graphical Representation of analysis of statement 6
Statement 7: This method is having more freedom to learn.
Table 9. Response for statement 7
     
Table value of chi square at 4df at .05 significance level is 9.488.Calculated value of Chi Square is less than the table value therefore, Null hypothesis is not rejected. This revealed that there is no significant difference observed between Experimental group A and Experimental B towards effectiveness of the developed CAI for the given statement.
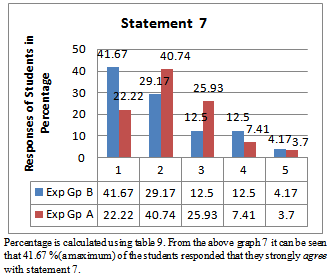
Graph 7. Graphical Representation of analysis of statement 7
Statement 8: CAI didn’t focus on more freedom situation.
Table 10. Response for statement 8
     
Table value of chi square at 4df at .05 significance level is 9.488.Calculated value of Chi Square is less than the table value therefore, Null hypothesis is not rejected. This revealed that there is no significant difference observed between Experimental group A and Experimental B towards effectiveness of the developed CAI for the given statement.
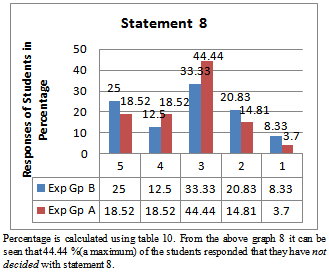
Graph 8. Graphical Representation of analysis of statement 8
Statement 9: Learning mathematics is fun in this CAI method.
Table 11. Response for statement 9
     
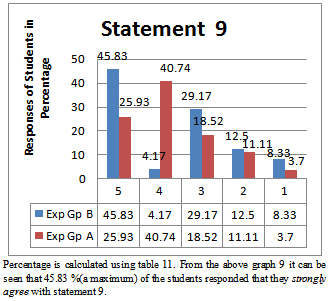
Graph 9. Graphical Representation of analysis of statement 9
Table value of chi square at 4df at .05 significance level is 9.488.Calculated value of Chi Square is more than the table value therefore, Null hypothesis is rejected. This revealed that there is significant difference observed between Experimental group A and Experimental group B towards effectiveness of the developed CAI for the given statement.
45.83% students’ of Exp B ‘strongly agree’ where as 25.93% students’ of the Exp A ‘strongly agree’ with the statement 9. More load is on ‘strongly agree’ of the Exp B which implies that they found CAI more effective than the Exp A.
Statement 10: This method is not good in learning mathematics because my doubts are not cleared.
Table 12. Response for statement 10
     
Table value of chi square at 4df at .05 significance level is 9.488.Calculated value of Chi Square is less than the table value therefore, Null hypothesis is not rejected. This revealed that there is no significant difference observed between Experimental group A and Experimental group B towards effectiveness of the developed CAI for the given statement.
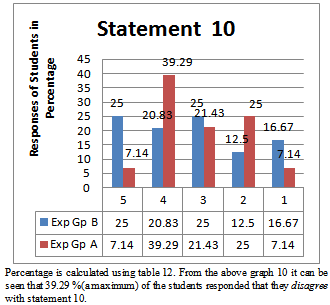
Graph 10. Graphical Representation of analysis of statement 10
Statement 11: In CAI I can teach myself (self-study) without the help of others.
Table 13. Response for statement 11
     
Table value of chi square at 4df at .05 significance level is 9.488.Calculated value of Chi Square is less than the table value therefore, Null hypothesis is not rejected. This revealed that there is no significant difference observed between Experimental group A and Experimental group B towards effectiveness of the developed CAI for the given statement.
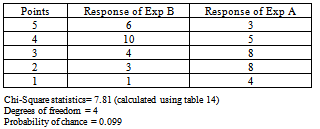
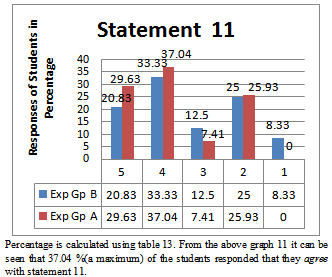
Graph 11. Graphical Representation of analysis of statement 11
Statement 12: Matter presented in CAI is not very clear.
Table 14. Response for statement 12
     
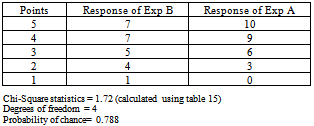
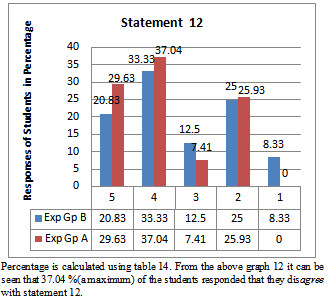
Graph 12. Graphical Representation of analysis of statement 12
Table value of chi square at 4df at .05 significance level is 9.488.Calculated value of Chi Square is less than the table value therefore, Null hypothesis is not rejected. This revealed that there is no significant difference observed between Experimental group A and Experimental group B towards effectiveness of the developed CAI for the given statement.
Statement 13: CAI is easy to understand.
Table 15. Response for statement 13
     
Table value of chi square at 4df at .05 significance level is 9.488.Calculated value of Chi Square is less than the table value therefore, Null hypothesis is not rejected. This revealed that there is no significant difference observed between Experimental group A and Experimental B towards effectiveness of the developed CAI for the given statement.
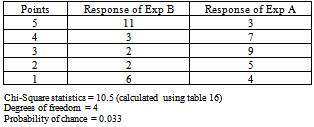
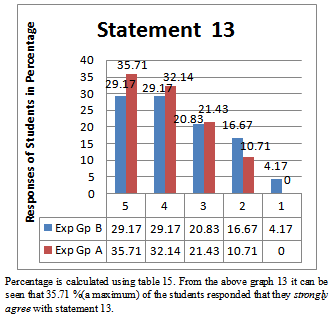
Graph 13. Graphical Representation of analysis of statement 13
Statement 14: Animations are distracting in understanding the concept.
Table 16. Responses for statement 14
     
Table value of chi square at 4df at .05 significance level is 9.488.Calculated value of Chi Square is more than the table value therefore, Null hypothesis is rejected. This revealed that there is significant difference observed between Experimental group A and Experimental B towards effectiveness of the developed CAI for the given statement.
45.83% students of Exp B ‘Strongly Disagree’ where as 10.714% students of the Exp A ‘Strongly Disagree’ with the statement with the statement viz Animations are distracting in understanding the concept. More load is on ‘strongly disagree’ of the Exp B which implies they found CAI more effective than the Exp A.
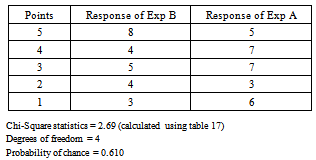
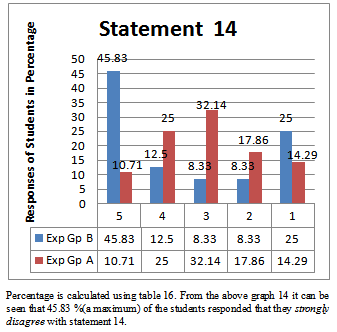
Graph 14. Graphical Representation of analysis of statement 14
Statement 15: CAI took more time to understand the concept than usual classroom teaching.
Table 17. Responses for statement 15
     
Table value of chi square at 4df at .05 significance level is 9.488.Calculated value of Chi Square is less than the table value therefore, Null hypothesis is not rejected. This revealed that there is no significant difference observed between Experimental group A and Experimental group B towards effectiveness of the developed CAI for the given statement.
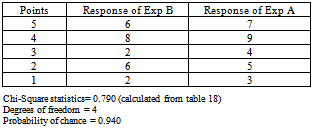
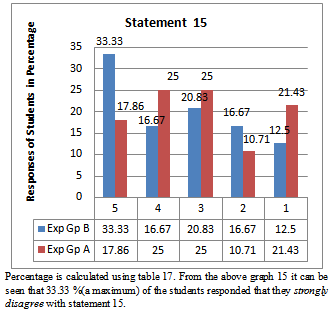
Graph 15. Graphical Representation of analysis of statement 15
Statement 16: Illustrations given in CAI are enough to understand the concept clearly.
Table 18. Responses for statement 16
     
Table value of chi square at 4df at .05 significance level is 9.488.Calculated value of Chi Square is less than the table value therefore, Null hypothesis is not rejected. This revealed that there is no significant difference observed between Experimental group A and Experimental Group B towards effectiveness of the developed CAI for the given statement.
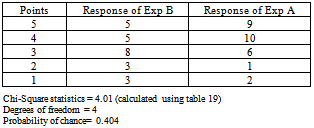
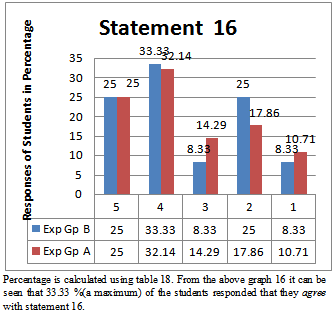
Graph 16. Graphical Representation of analysis of statement 16
Statement 17: Matter presented in CAI was logically arranged.
Table 19. Responses for statement 17
     
Table value of chi square at 4df at .05 significance level is 9.488.Calculated value of Chi Square is less than the table value therefore, Null hypothesis is not rejected. This revealed that there is no significant difference observed between Experimental group A and Experimental B group towards effectiveness of the developed CAI for the given statement.
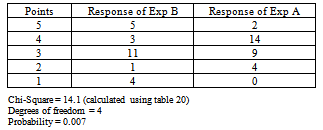
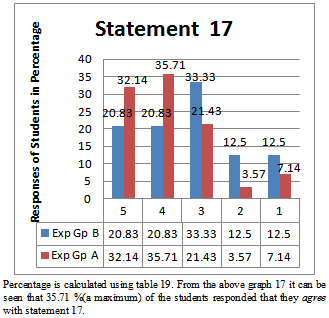
Graph 17. Graphical Representation of analysis of statement 17
Statement 18: Learning through CAI was waste of time.
Table 20. Responses for statement 18
     
Table value of chi square at 4df at .05 significance level is 9.488.Calculated value of Chi Square is more than the table value therefore, Null hypothesis is rejected. This revealed that there is significant difference observed between Experimental group A and Experimental group B towards effectiveness of the developed CAI for the given statement.
12.5% students of Exp B ‘Disagree’ where as 48.28% students of the Exp A ‘Disagree’ with the statement ‘Learning through CAI was waste of time’. More load is on ‘disagree’ of the Exp A which implies that Exp A found CAI more effective than the Exp B.
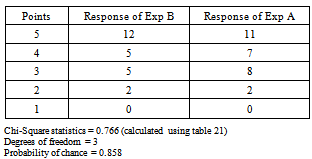
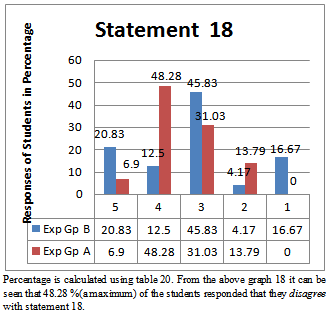
Graph 18. Graphical Representation of analysis of statement 18
Statement 19: Illustrations given in CAI are related to day today life experiences.
Table 21. Responses for statement 19
     
Table value of chi square at 4df at .05 significance level is 9.488.Calculated value of Chi Square is less than the table value therefore, Null hypothesis is not rejected. This revealed that there is no significant difference observed between Experimental group A and Experimental B towards effectiveness of the developed CAI for the given statement.
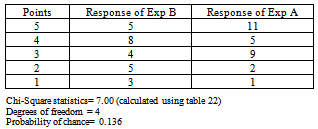
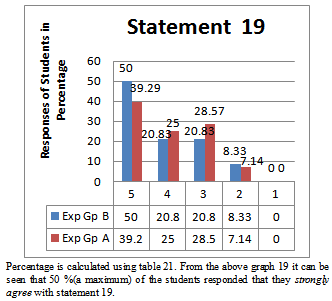
Graph 19. Graphical Representation of analysis of statement 19
Statement 20: Classroom teaching is more enjoyable.
Table 22. Responses for statement 20
     
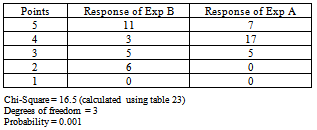
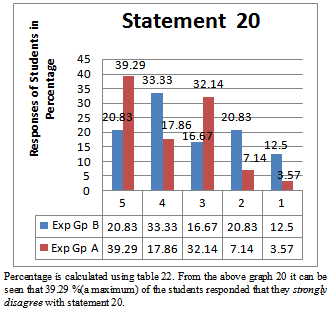
Graph 20. Graphical Representation of analysis of statement 20
Table value of chi square at 4df at .05 significance level is 9.488.Calculated value of Chi Square is less than the table value therefore, Null hypothesis is not rejected. This revealed that there is no significant difference observed between Experimental group A and Experimental group B towards effectiveness of the developed CAI for the given statement.
Statement 21: The language used in CAI is easy and simple to understand.
Table 23. Responses for statement 21
     
Table value of Chi Square at 3df at .05 significance level is 7.815. Calculated value of Chi Square is more than the table value therefore, Null hypothesis is rejected. This revealed that there is significant difference observed between Experimental group A and Experimental group B towards effectiveness of the developed CAI for the given statement.
12% students of Exp B ‘agree’ where as 58.62% students of Exp A ‘agree’ with the statement ‘The language used in CAI is easy and simple to understand.’ More load is on ‘agree’ of Exp A which implies that they found CAI more effective than the Exp B.
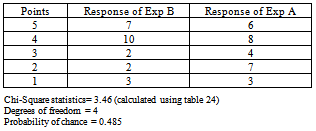
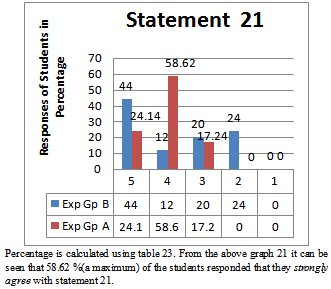
Graph 21. Graphical Representation of analysis of statement 21
Statement 22: The exercises given in each chapter is adequate.
Table 24. Responses for statement 22
     
Table value of chi square at 4df at .05 significance level is 9.488. Calculated value of Chi Square is less than the table value therefore, Null hypothesis is not rejected. This revealed that there is no significant difference observed between Experimental group A and Experimental group B towards effectiveness of the developed CAI for the given statement.
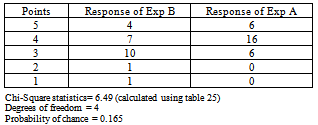
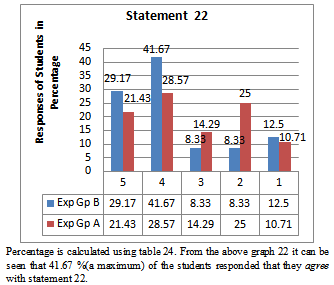
Graph 22. Graphical Representation of analysis of statement 22
Statement 23: CAI takes care of previous knowledge in the subject.
Table 25. Responses for statement 23
     
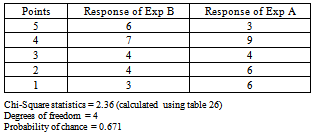
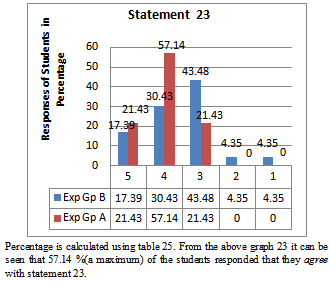
Graph 23. Graphical Representation of analysis of statement 23
Table value of chi square at 4df at .05 significance level is 9.488.Calculated value of Chi Square is less than the table value therefore, Null hypothesis is rejected. This revealed that there is no significant difference observed between Experimental group A and Experimental group B towards effectiveness of the developed CAI for the given statement.
Statement 24: The solution to the problem is not easy to understand.
Table 26. Responses for statement 24
     
Table value of chi square at 4df at .05 significance level is 9.488.Calculated value of Chi Square is less than the table value therefore, Null hypothesis is not rejected. This revealed that there is no significant difference observed between Experimental group A and Experimental group B towards effectiveness of the developed CAI for the given statement.
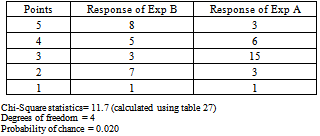
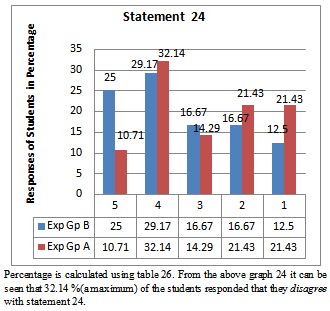
Graph 24. Graphical Representation of analysis of statement 24
Table 27. Responses for statement 25
     
Statement 25: The exercises helped in understanding the chapter in depth.
Table value of chi square at 4df at .05 significance level is 9.488.Calculated value of Chi Square is more than the table value therefore, Null hypothesis is rejected.
This revealed that there is significant difference observed between Experimental group A and Experimental group B towards effectiveness of the developed CAI for the given statement.
12.5% students of Exp B ‘not decided’ where as 53.571% of the Exp A ‘not decided’ with the statement ‘The exercises helped in understanding the chapter in depth. More load is on ‘not decided’ of the Exp A which implies they found CAI more effective than the Exp B.
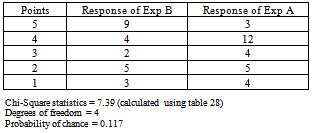
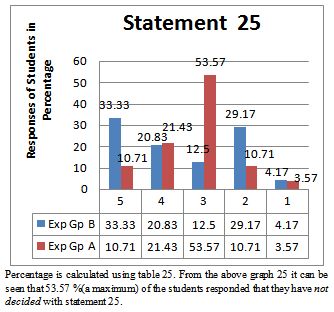
Graph 25. Graphical Representation of analysis of statement 25
Statement 26: Solutions didn’t help me whenever I was not able to solve the problem.
Table 28. Responses for statement 26
     
Table value of chi square at 4df at .05 significance level is 9.488.Calculated value of Chi Square is less than the table value therefore, Null hypothesis is not rejected. This revealed that there is no significant difference observed between Experimental group A and Experimental group B towards effectiveness of the developed CAI for the given statement.
Statement 27: Break given in CAI helped me to refresh my mind.
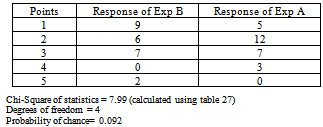
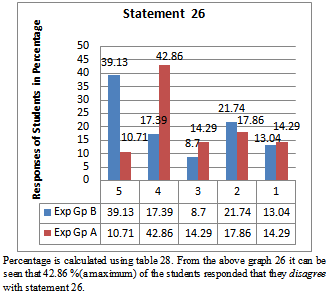
Graph 26. Graphical Representation of analysis of statement 26
Table 29. Responses for statement 27
     
Table value of chi square at 4df at .05 significance level is 9.488.Calculated value of Chi Square is less than the table value therefore, Null hypothesis is not rejected. This revealed that there is no significant difference observed between Experimental group A and Experimental groupB towards effectiveness of the developed CAI for the given statement.
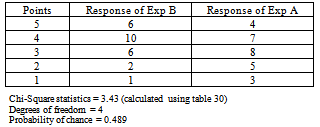
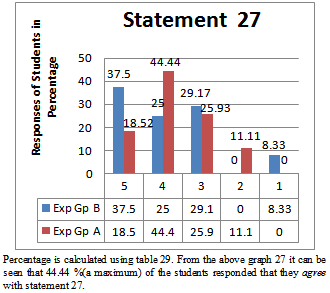
Graph 27. Graphical Representation of analysis of statement 27
Statement 28: I am feeling tired while going through the slide.
Table 30. Responses for statement 28
     
Table value of chi square at 4df at .05 significance level is 9.488.Calculated value of Chi Square is less than the table value therefore, Null hypothesis is not rejected. This revealed that there is no significant difference observed between Experimental group A and Experimental group B towards effectiveness of the developed CAI for the given statement.
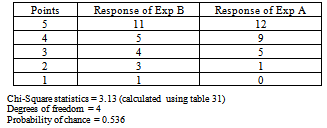
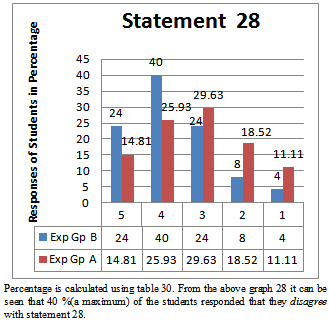
Graph 28. Graphical Representation of analysis of statement 28
Statement 29: Animation shown in CAI is appropriate to help me in understanding the concept.
Table 31. Responses for statement 29
     
Table value of chi square at 4df at .05 significance level is 9.488.Calculated value of Chi Square is less than the table value therefore, Null hypothesis is not rejected. This revealed that there is no significant difference observed between Experimental group A and Experimental group B towards effectiveness of the developed CAI for the given statement.
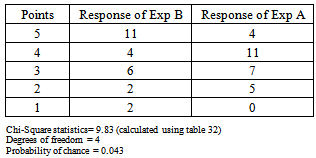
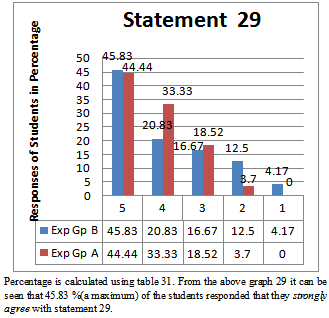
Graph 29. Graphical Representation of analysis of statement 29
Statement 30: Topic is not introduced properly.
Table 32. Responses for statement 30
     
Table value of chi square at 4df at .05 significance level is 9.488.Calculated value of Chi Square is more than the table value therefore, Null hypothesis is rejected. This revealed that there is significant difference observed between Experimental group A and Experimental group B towards effectiveness of the developed CAI for the given statement.
44% students of the Exp B ‘strongly disagree’ whereas 14.81% students of Exp A ‘strongly disagree’ with the statement ‘Topic is not introduced properly. More load is on ‘strongly disagree’ of the Exp B than Exp A.
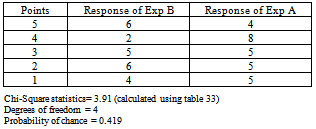
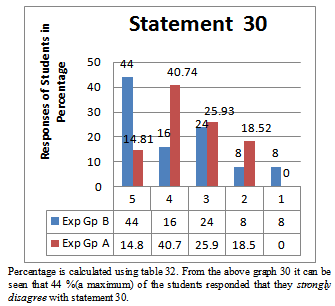
Graph 30. Graphical Representation of analysis of statement 30
Statement 31: CAI does not take care of previous knowledge (percentage) needed to understand the present concept.
Table 33. Responses for statement 31
     
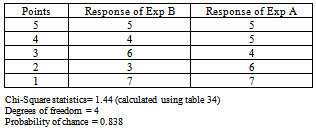
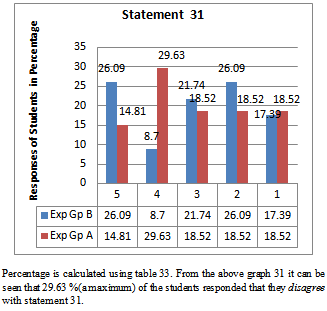
Graph 31. Graphical Representation of analysis of statement 31
Table value of chi square at 4df at .05 significance level is 9.488.Calculated value of Chi Square is less than the table value therefore, Null hypothesis is not rejected. This revealed that there is no significant difference observed between Experimental group A and Experimental group B towards effectiveness of the developed CAI for the given statement.
Statement 32: Enough revision is not done in CAI after the topic simple interest.
Table 34. Responses for statement 32
     
Table value of chi square at 4df at .05 significance level is 9.488.Calculated value of Chi Square is less than the table value therefore, Null hypothesis is not rejected. This revealed that there is no significant difference observed between Experimental group A and Experimental group B towards effectiveness of the developed CAI for the given statement.
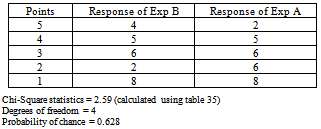
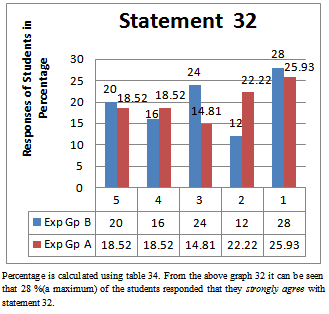
Graph 32. Graphical Representation of analysis of statement 32
Statement 33: Enough revision is not done in CAI after the topic compound interest.
Table 35. Responses for statement 33
     
Table value of chi square at 4df at .05 significance level is 9.488.Calculated value of Chi Square is less than the table value therefore, Null hypothesis is not rejected. This revealed that there is no significant difference observed between Experimental group A and Experimental group B towards effectiveness of the developed CAI for the given statement.
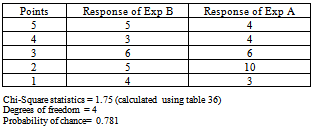
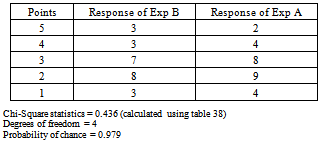
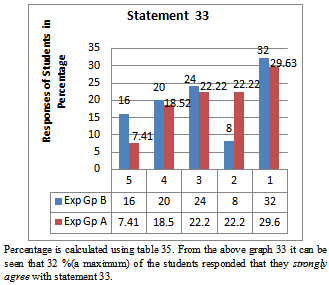
Graph 33. Graphical Representation of analysis of statement 33
Statement 34: Enough revision is not done in CAI after the topic profit and loss.
Table 36. Responses for statement 34
     
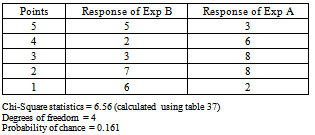
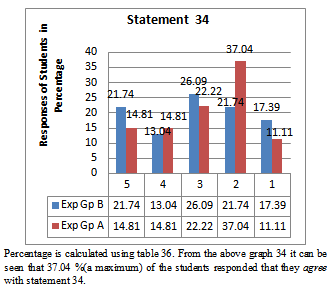
Graph 34. Graphical Representation of analysis of statement 34
Table value of chi square at 4df at .05 significance level is 9.488.Calculated value of Chi Square is less than the table value therefore, Null hypothesis is not rejected. This revealed that there is no significant difference observed between Experimental group A and Experimental group B towards effectiveness of the developed CAI for the given statement.
Statement 35: Remedial (re teaching the difficult concept which is not understood by you) teaching is not done.
Table 37. Responses for statement 35
     
Table value of chi square at 4df at .05 significance level is 9.488.Calculated value of Chi Square is less than the table value therefore, Null hypothesis is not rejected. This revealed that there is no significant difference observed between Experimental group A and Experimental group B towards effectiveness of the developed CAI for the given statement.
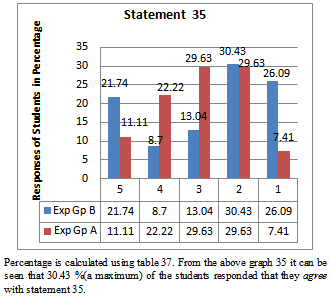
Graph 35. Graphical Representation of analysis of statement 35
Table 38. Responses for statement 36
     
Statement 36: I had to read the slide many times to understand what is being said as there was no clarity in understand.
Table value of chi square at 4df at .05 significance level is 9.488.Calculated value of Chi Square is less than the table value therefore, Null hypothesis is not rejected. This revealed that there is no significant difference observed between Experimental group A and Experimental group B towards effectiveness of the developed CAI for the given statement.
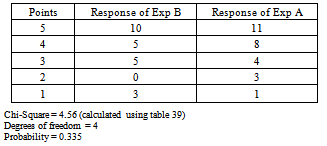
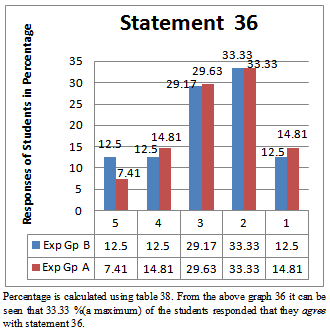
Graph 36. Graphical Representation of analysis of statement 36
Statement 37: Number of questions at the end of the slides for the topic profit and loss is adequate for providing practice.
Table 39. Responses for statement 37
     
Table value of chi square at 4df at .05 significance level is 9.488.Calculated value of Chi Square is less than the table value therefore, Null hypothesis is not rejected. This revealed that there is no significant difference observed between Experimental group A and Experimental group B towards effectiveness of the developed CAI for the given statement.
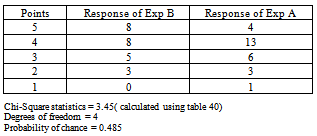
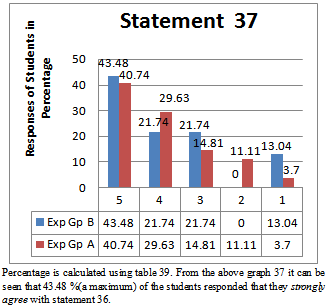
Graph 37. Graphical Representation of analysis of statement 37
Statement 38: Number of questions at the end of the slides for the topic simple interest is adequate for providing practice.
Table 40. Responses for statement 38
     
Table value of chi square at 4df at .05 significance level is 9.488.Calculated value of Chi Square is less than the table value therefore, Null hypothesis is not rejected. This revealed that there is no significant difference observed between Experimental group A and Experimental group B towards effectiveness of the developed CAI for the given statement.
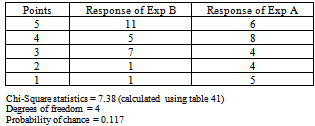
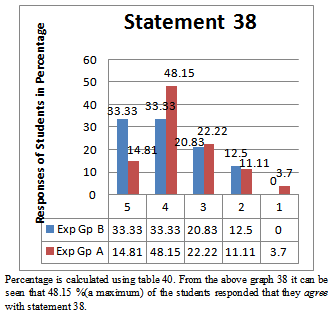
Graph 38. Graphical Representation of analysis of statement 38
Statement 39: Number of questions at the end of the slides for the topic compound interest is adequate for providing practice.
Table 41. ponses for statement 39
     
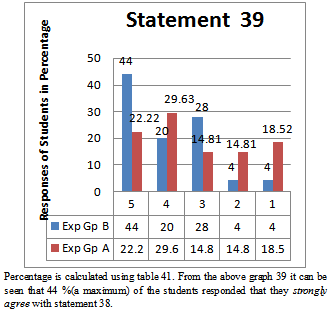
Graph 39. Graphical Representation of analysis of statement 39
Table value of chi square at 4df at .05 significance level is 9.488.Calculated value of Chi Square is less than the table value therefore, Null hypothesis is not rejected. This revealed that there is no significant difference observed between Experimental group A and Experimental group B towards effectiveness of the developed CAI for the given statement.
Statement 40: CAI is not enough in understanding the concept very clearly.
Table 42. Responses for statement 40
     
Table value of chi square at 4df at .05 significance level is 9.488.Calculated value of Chi Square is less than the table value therefore, Null hypothesis is not rejected. This revealed that there is no significant difference observed between Experimental group A and Experimental group B towards effectiveness of the developed CAI for the given statement.
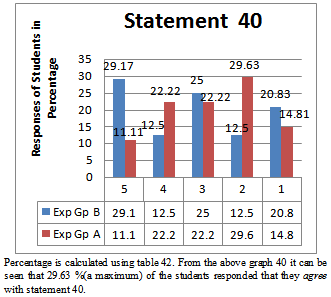
Graph 40. Graphical Representation of analysis of statement 40
Statement 41: Independent learning is not possible through CAI.
Table 43. Responses for statement 41
     
Table value of chi square at 4df at .05 significance level is 9.488.Calculated value of Chi Square is more than the table value therefore, Null hypothesis is rejected. This revealed that there is significant difference observed between Experimental group A and Experimental group B towards effectiveness of the developed CAI for the given statement.
12.5% students of Exp B ‘disagree’ where as 40.74% students of Exp A ‘Disagree’ with the statement ‘Independent learning is not possible through CAI’. More load is on ‘disagree’ of the Exp A than Exp B.
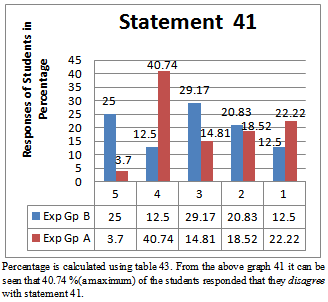
Graph 41. Graphical Representation of analysis of statement 41
Statement 42: Evaluation is done objectively (objective questions) so no partiality is involved in scoring.
Table 44. Responses for statement 42
     
Table value of chi square at 4df at .05 significance level is 9.488.Calculated value of Chi Square is more than the table value therefore, Null hypothesis is rejected. This revealed that there is significant difference observed between Experimental group A and Experimental group B towards effectiveness of the developed CAI for the given statement.
50% students of Exp B ‘strongly agree’ where 14.286 as % students of Exp A ‘strongly agree’ with the statement ‘Evaluation is done objectively (objective questions) so no partiality is involved in scoring’. More load is on ‘strongly agree’ of the Exp B than Exp A.
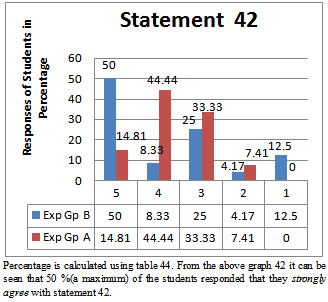
Graph 42. Graphical Representation of analysis of statement 42
Statement 43: Evaluation done at the end of the topic “simple interest” is not suitable measure to know my understanding about that topic.
Table 45. Responses for statement 43
     
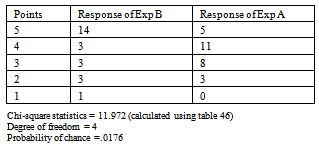
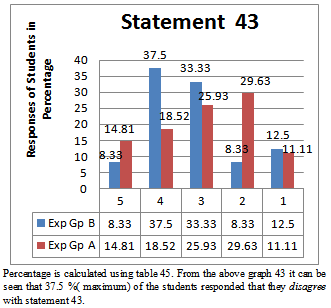
Graph 43. Graphical Representation of analysis of statement 43
Table value of chi square at 4df at .05 significance level is 9.488.Calculated value of Chi Square is less than the table value therefore, Null hypothesis is not rejected. This revealed that there is no significant difference observed between Experimental group A and Experimental group B towards effectiveness of the developed CAI for the given statement.
Statement 44: Instruction given in each slide of CAI is easy and clear to follow.
Table 46. Responses for statement 44
     
Table value of chi square at 4df at .05 significance level is 9.488.Calculated value of Chi Square is more than the table value therefore, Null hypothesis is rejected. This revealed that there is significant difference observed between Experimental group A and Experimental group B towards effectiveness of the developed CAI for the given statement.
58.33% students of the Exp B ‘strongly agree’ where as 17.86% students of Exp A ‘strongly agreewith the statement ‘Instruction given in each slide of CAI is easy and clear to follow with the statement.’ More load is on ‘strongly agree’ of the Exp B than Exp A.
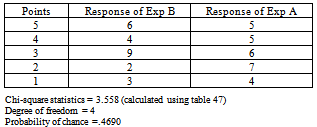
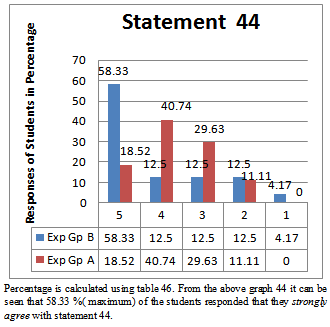
Graph 44. Graphical Representation of analysis of statement 44
Statement 45: Evaluation done at the end of the topic profit and loss is not suitable measure to know my understanding about that topic.
Table 47. Responses for statement 45
     
Table value of chi square at 4df at .05 significance level is 9.488.Calculated value of Chi Square is less than the table value therefore, Null hypothesis is not rejected. This revealed that there is no significant difference observed between Experimental group A and Experimental group B towards effectiveness of the developed CAI for the given statement.
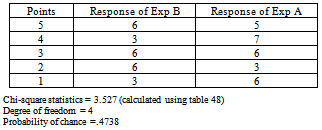
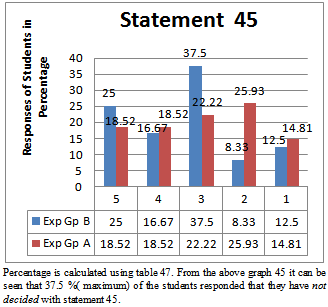
Graph 45. Graphical Representation of analysis of statement 45
Statement 46: Interaction with mathematics teacher is not possible while using this CAI.
Table 48. Responses for statement 46
     
Table value of chi square at 4df at .05 significance level is 9.488.Calculated value of Chi Square is less than the table value therefore, Null hypothesis is not rejected. This revealed that there is no significant difference observed between Experimental group A and Experimental group B towards effectiveness of the developed CAI for the given statement.
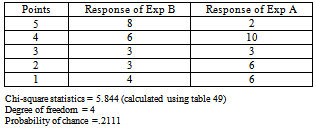
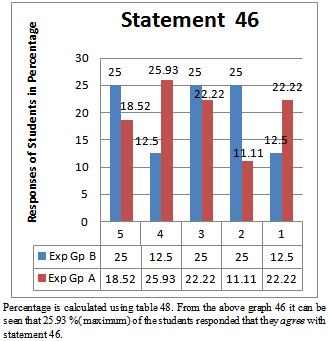
Graph 46. Graphical Representation of analysis of statement 46
Statement 47: To get the correct answer I had to go back to the slide/s many times for topic simple interest.
Table 49. Responses for statement 47
     
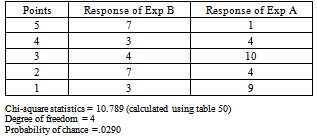
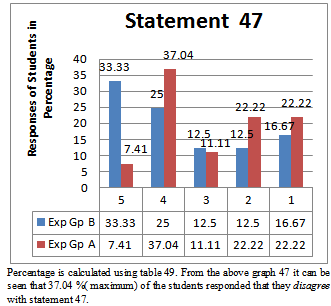
Graph 47. Graphical Representation of analysis of statement 47
Table value of chi square at 4df at .05 significance level is 9.488. Calculated value of Chi Square is less than the table value therefore, Null hypothesis is not rejected. This revealed that there is no significant difference observed between Experimental group A and Experimental group B towards effectiveness of the developed CAI for the given statement.
Statement 48: To get the correct answer I had to go back to the slide/s many times for topic Compound interest.
Table 50. Responses for statement 48
     
Table value of chi square at 4df at .05 significance level is 9.488.Calculated value of Chi Square is more than the table value therefore, Null hypothesis is rejected. This revealed that there is significant difference observed between Experimental group A and Experimental group B towards effectiveness of the developed CAI for the given statement.
16.67% students of Exp B ‘not decided’ whereas 35.71% students of the Exp A ‘not decided’ with the statement ‘To get the correct answer I had to go back to the slide/s many times for topic Compound interest.’. More load is on ‘not decided’ of the Exp A than Exp B.
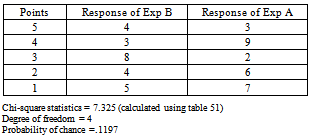
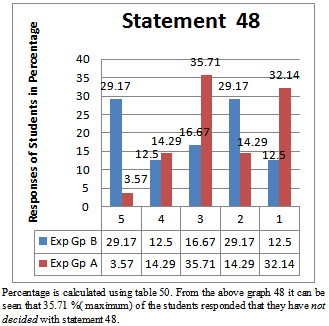
Graph 48. Graphical Representation of analysis of statement 48
Statement 49: To get the correct answer I had to go back to the slide/s many times for topic profit and loss.
Table 51. Responses for statement 49
     
Table value of chi square at 4df at .05 significance level is 9.488.Calculated value of Chi Square is less than the table value therefore, Null hypothesis is not rejected. This revealed that there is no significant difference observed between Experimental group A and Experimental group B towards effectiveness of the developed CAI for the given statement.
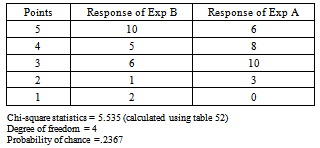
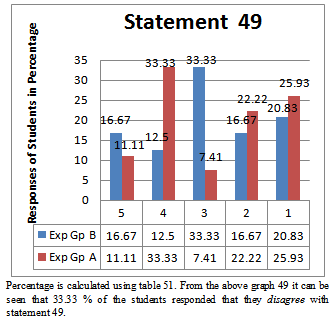
Graph 49. Graphical Representation of analysis of statement 49
Table 52. Responses for statement 50
     
Statement 50: Scores obtained by me at the end of each exercise gives me feedback about my learning in each topic through CAI.
Table value of chi square at 4df at .05 significance level is 9.488.Calculated value of Chi Square is less than the table value therefore, Null hypothesis is not rejected. This revealed that there is no significant difference observed between Experimental group A and Experimental group B towards effectiveness of the developed CAI for the given statement.
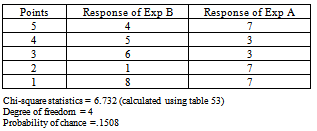
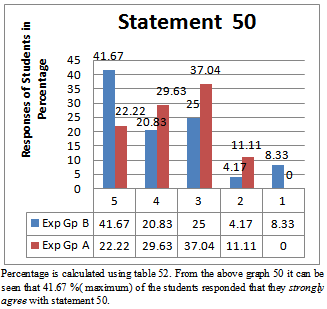
Graph 50. Graphical Representation of analysis of statement 50
Statement 51: Discussion with mathematics teacher is needed along with CAI.
Table 53. Responses for statement 51
     
Table value of chi square at 4df at .05 significance level is 9.488.Calculated value of Chi Square is less than the table value therefore, Null hypothesis is not rejected. This revealed that there is no significant difference observed between Experimental group A and Experimental group B towards effectiveness of the developed CAI for the given statement.
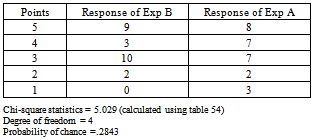
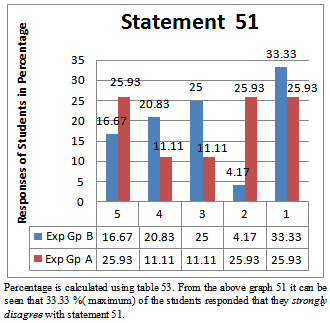
Graph 51. Graphical Representation of analysis of statement 51
Statement 52: Evaluation done at the end of the topic profit and loss is suitable measure to know my understanding about that topic.
Table 54. Responses for statement 52
     
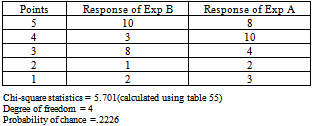
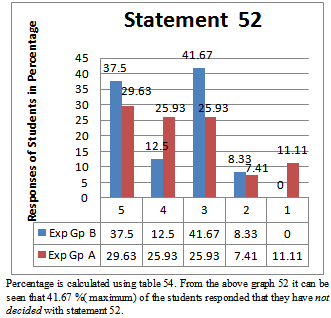
Graph 52. Graphical Representation of analysis of statement 52
Table value of chi square at 4df at .05 significance level is 9.488.Calculated value of Chi Square is less than the table value therefore, Null hypothesis is not rejected. This revealed that there is no significant difference observed between Experimental group A and Experimental group B towards effectiveness of the developed CAI for the given statement.
Statement 53: Evaluation done at the end of the topic “simple interest” is suitable measure to know my understanding about that topic.
Table 55. Responses for statement 53
     
Table value of chi square at 4df at .05 significance level is 9.488. Calculated value of Chi Square is less than the table value therefore, Null hypothesis is not rejected. This revealed that there is no significant difference observed between Experimental group A and Experimental group B towards effectiveness of the developed CAI for the given statement.
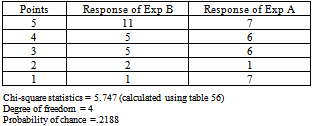
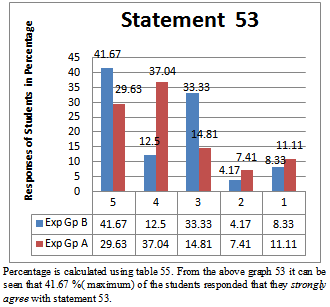
Graph 53. Graphical Representation of analysis of statement 53
Statement 54: Evaluation done at the end of the topic compound interest is suitable measure to know my understanding about that topic.
Table value of chi square at 4df at .05 significance level is 9.488.Calculated value of Chi Square is less than the table value therefore, Null hypothesis is not rejected. This revealed that there is no significant difference observed between Experimental group A and Experimental group B towards effectiveness of the developed CAI for the given statement.
Table 56. Responses for statement 54
     
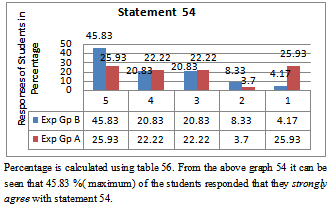
Graph 54. Graphical Representation of analysis of statement 54

7. Findings of the Study

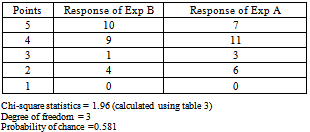
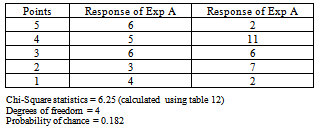
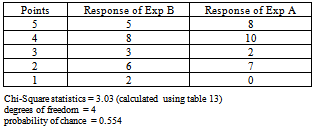
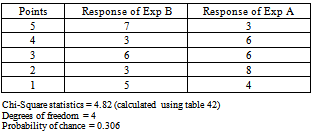
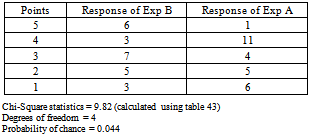
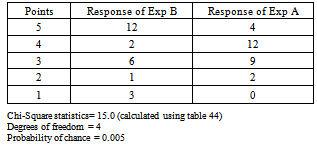
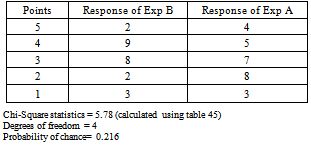
Out of 54 statements for twelve statements (2,3, 9,14,18,21,25,30,41,42, 44 and 48) the chi square value is found to be significant. This means that significant difference was observe between the response of Experimental group A and that of Experimental group B. However for the remaining 42 statements chi square value is not found to be significant.

8. Discussion

The literature and the findings of the current study reveal several interesting observations concerning class VIII mathematics and computer-assisted instruction. The results of this study indicate that students learn equally well with the help of computer assisted instruction with or without the presence of teacher. Computers have the potential to be useful tools to improve learning. As supported by reaction scale responses, students displayed interest in using CAI for a variety of reasons. Educators can tap into this interest by using CAI to deliver instruction and assess learning. Technological advances have made computers more powerful and less expensive, which has resulted in more students having access to computers. Computer learning systems provide educators the opportunity to present topics in a variety of alternative forms as compared to the traditional lecture in order to address the different learning styles and preferences of students. Educators using the traditional method of teaching may consider supplementing their method of teaching with the help of CAI so as to enhance students learning and motivation.

9. Educational Implication of the Present Study

Students enjoyed learning mathematics through CAI and it helped students as a supplementary material. Self learning material should be developed in mathematics where ever possible for all classes and should be used along with the conventional method to make learning an enjoyable and pleasant experience.

10. Conclusions

[20–22] Authors concluded that CAI offers students an opportunity to be actively engaged in the learning process, to receive instruction through a variety of multimedia, to choose the place and time to learn, to work at their own pace, and to receive immediate and accurate feedback. [23-25] Authors have studied the effectiveness of using CAI in teaching and learning mathematics. In the current study judging from the overall response of the students and from observations of the investigators it was found that students enjoyed learning mathematics through CAI. So it can be concluded that CAI is one of the effective ways to teach and learn mathematics.

References

[1]  NCERT (1971) Education and National Development. Report of the Education Commision 1964-66. New Delhi: NCERT
[2]  Chapter 2: Computer Assisted Instruction and Learning issues date :21.7.12http://www.computing.dcu.ie/~mward/mthesis/chapter2.pdf
[3]  Jain, S.L.; Burad. G.L. “Low Results in Mathematics at Secondary Examination in Rajasthan”, Independent Study. Udaipur: State Institute of Educational Research and training, India, 1988.
[4]  Chel, M.M. “Diagnosis and remediation of under achievement in compulsary Maths of Madynamic examination in W
[5]  Jeyamani, P. “Effectiveness of simulation modes of teaching through CAI.” In NCERT (1992). Fifth Survey of Research in Education, New Delhi: NCERT, India, 1991.est Bengal.” In NCERT(1992). Fifty Survey of Research in Education, New Delhi: NCERT,India, 1990.
[6]  Rose Antony Stella V. “Effectiveness of Computer Assisted Instruction with Special reference to underachievers.” In NCERT(1992). Fifth Survey of Research in Education, New Delhi: NCERT, India, 1992.
[7]  Adhikari, R. “Development of Computer Aided Instruction Material on cell and cell reproduction for class IX”. In Goel, D. R. (2000). Educational Media in India. Delhi: Bharatiya Kala Prakashan, India, 1992.
[8]  Barot, H. “To study the effectiveness of CAI in Sanskrit for std. VIII students”. An unpublished M.Ed. dissertation. Vadodara: CASE. The Maharaja Sayajirao University of Baroda, India, 2005.
[9]  Dalwadi, N. “Development of Computer Assisted Instruction in science for the students of standard IX.”An unpublished M.Ed. dissertation. Vadodara:CASE. The Maharaja Sayajirao University of Baroda, India, 2001.
[10]  Helaiya, S. “Developing and Implementation of CAI package for teaching statistics to B.Ed. Students.” An unpublished M.Ed. dissertation. Vadodara:CASE. The Maharaja Sayajirao University of Baroda, India, 2004.
[11]  Khirwadkar, A. “Development of Computer software for learning chemistry at standard XI.” An unpublished Ph.D, Thesis, Vadodara: CASE, The M.S.University of Baroda, India, 1998.
[12]  Rathwa, M. “Development and Implementation of Multimedia Package for teaching Gujarati subject.” An unpublished M.Ed. dissertation. Vadodara: CASE. The Maharaja Sayajirao University of Baroda, India, 2007.
[13]  Sharma, D. “A study of the effectiveness of Computer Assisted Learning (CAL) in chemistry for the students of standard XI.” An unpublished M.Ed. dissertation. Vadodara: CASE. The Maharaja Sayajirao University of Baroda, India, 2003.
[14]  Singh, R.D. “To study the effectiveness of teaching mathematics through Computer Assisted Instruction and conventional method of cognitive and non cognitive variables.” In NCERT.(ed.) fifth Survey of Research in Education, New Delhi : NCERT, India, 1992.
[15]  Yadav, S. “A study of the effectiveness of the Computer Software for students of standard I”. An unpublished M.Ed. dissertation. Vadodara: CASE. The Maharaja Sayajirao University of Baroda, India, 2000.
[16]  Zyoud, M.M. “Development of Computer assisted English language teaching of VIII standard students.” An unpublished Ph.D. Thesis. Vadodara: CASE. The Maharaja Sayajirao University of Baroda, India, 1999.
[17]  Vansia, F.S. “Effectiveness of Computer with Peer Interaction for Math's learning in urban area.” International Referred Research Journal, September, 2011, ISSN-0975-3486:Rajbil 2001/30097, Vol-II Issue 24 in http://www.ssmrae.com/admin/images/f76c407be2bb7e5c6eef3071f8c9abd5.pdf , date:13/7/12
[18]  Spradlin, Kathy Dye and Ackerman, Beth, "The Effectiveness of Computer- Assisted Instruction in Developmental Mathematics"(2010). Faculty Publications and Presentations. Paper195.http://digitalcommons.liberty.edu/educ_fac_pubs/195
[19]  http://www.physics.csbsju.edu/stats/chi-square.html date: 30.09.2012
[20]  Brown, K. L. From teacher-centered to learner-centered curriculum: Improving learning in diverse classrooms. Education, 124(1), 49-54, 2003.
[21]  Cotton, K. Computer-assisted instruction. Northwest Regional Educational Laboratory, School Improvement Research Series (Close-Up #10), Portland, OR: Education Northwest, 1991.
[22]  Kinney, D. P, & Robertson, D. E. Technology makes possible new models for delivering developmental mathematics instruction. Mathematics and Computer Education, 37(3),315-328, 2003.
[23]  Pramila,R & Patadia, H. Comparative Analysis of Reaction of Students on Final Version of Computer Assisted Instruction for Teaching Arithmetic with Different Modes. IOSR Journal of Humanities and Social Science (JHSS).5(3), 52-91, 2012.
[24]  Pramila,R & Patadia, H. The effectiveness of Computer Assisted Instruction in Teaching Arithmetics. International Journal of Scientific and Research Publications.2(11), 52-91, 2012.
[25]  Pramila,R & Patadia, H. Reaction of Students on Developed Computer Assisted Instruction For Teaching Arithmetic. Eduction. Vol.3, No.1, January 2013 in http://journal.sapub.org/edu