Nane Kratzke
Lübeck University of Applied Sciences, Department of Electrical Engineering and Computer Science, 23562, Lübeck, Germany
Correspondence to: Nane Kratzke , Lübeck University of Applied Sciences, Department of Electrical Engineering and Computer Science, 23562, Lübeck, Germany.
| Email: |  |
Copyright © 2012 Scientific & Academic Publishing. All Rights Reserved.
Abstract
Cost efficiency is an often mentioned strength of cloud computing. In times of decreasing educational budgets virtual labs provided by cloud computing might be therefore an interesting option for higher education organizations or IT training facilities. An analysed use case of a web technology lecture and a corresponding practical course of a computer science study programme shows that is not possible to answer the question in general whether cloud computing approaches are economical or not. The general implication of this finding for higher education is, that the application of cloud computing can be only answered from a course specific point of view. This contribution shows why. But also how universities, colleges or other IT training facilities can make profound and course specific decisions for or against cloud based virtual labs from an economic point of view. The presented approach is inspired by Weinmans “mathematical proof of the inevitability of cloud computing”. The key idea is to compare peak to average usage of virtual labs and relate this ratio to costs of classical dedicated labs. The ratio of peak and average usage indicates whether a use case (from a pure economical point of view) is cloud compatible or not. This contribution derives also some findings when cloud computing in higher education has economical advantages or disadvantages. Regarding the analysed use case it turned out that virtual labs are able to provide a more than 25 times cost advantage compared to classical dedicated approaches. Virtual labs can be applied frictionless to classical as well as distance study programmes and virtual labs provide a convenient infrastructure for project as well as problem based learning in computer science. Nevertheless provider of virtual labs should always consider usage and resulting cost characteristics. This article shows how to do this.
Keywords:
Virtual Lab, Higher Education, Cloud Computing, Computer Science, Practical Course, Lecture, Project Based Learning, Problem Based Learning, Cloud Economics
Cite this paper:
Nane Kratzke , "Virtual Labs in Higher Education of Computer Science Why they are Valuable? How to Realize? How much will It Cost?", Education, Vol. 2 No. 7, 2012, pp. 239-246. doi: 10.5923/j.edu.20120207.04.
1. Introduction
Cloud computing is one of the latest developments within the business information systems domain and describes a delivery model for IT services based on the Internet[1]. Cloud computing involves the provision of dynamically scalable and often virtualized resources. Cloud computing is used in e-learning scenarios as well because it fits very well to e-learning requirements. When e-learning has a distinctive remote aspect why delivering necessary educational re- sources like labs has to be delivered still in a classical and on-premise manner?Accompanying the increasing relevance of cloud computing in research literature and media there arise manifold publications covering the application of cloud computing to e-learning. E.g.[2] present a training and education cloud. But only some publications concentrate on aspects how to use cloud computing to provide virtual labs.Oberg et al.[3] present a “virtual lab” system architecture for academic high-performance computing but without educational purposes. And a lot of other authors reflect about to use cloud computing as technical infrastructure for providing e-learning systems[4],[5],[6] digital campus systems[7] or personalized learning environment systems[8] but this has nothing to do with virtual laboratories in the understanding of this contribution. Only Thiébaut et al.[9] show a very interesting problem based education example of processing Wikipedia dumps by applying cloud computing technologies and compare them to dedicated cluster solutions in practical college courses. This approach could be named a ”virtual lab” but this is not done due to another intent of the publication. So this contribution is about a case study how to use cloud computing in computer science study programs providing virtual IT labs for practical courses. Influenced by Barr[10] we define:A Virtual Lab is a collection of compute, storage and networking resources provided by an educational organization for educational or research purposes. A virtual lab can be provided to a single or a small group of students to support student(s) in solving practical problems by providing a necessary IT infrastructure. Provided resources are available for short-term use, accessible via internet only and are billed by actual resource consumption generated by educational or research activities. Typically all provided resources are rented by the educational organization from a cloud service provider.Beside use cases like hosting websites, support software development cycles, short-term system demonstrations, data storage, disaster recovery and business continuity, media processing and rendering, overflow processing or large-scale scientific data processing Barr mentions training use cases as very cloud compatible and economical use cases[10]. This paper does not denial this postulation in general but advocates a more critical view like[11] or[12]. Ongoing research[13],[14],[15] show that cost advantages of cloud computing are deeply use case specific and cloud customers have to be highly aware of comparing non comparable use cases.
2. Research Methodology
Therefore this contribution adopts the approach of Weinman for cloud computing decision making[12]. This decision making model has been applied in a case study.The analysed case study was a web technology lecture for computer science students (bachelor) being held at the Lübeck University of Applied Sciences in summer 2011. The lecture and practical courses were repeated in winter 2011/2012 as well as summer 2012 with varying problems of comparable complexity to solve. During the practical courses of this lecture students formed groups of 5 or 6 students in order to build up a website for a scientific conference on robotic sailing (project 1) or establish a Google map based automatic sailbot tracking service (project 2) for the same conference. All groups were assigned cloud service accounts provided by Amazon Web Services (AWS). The resource consumption of all groups were measured by analysing billing as well as usage data provided by the cloud service provider AWS.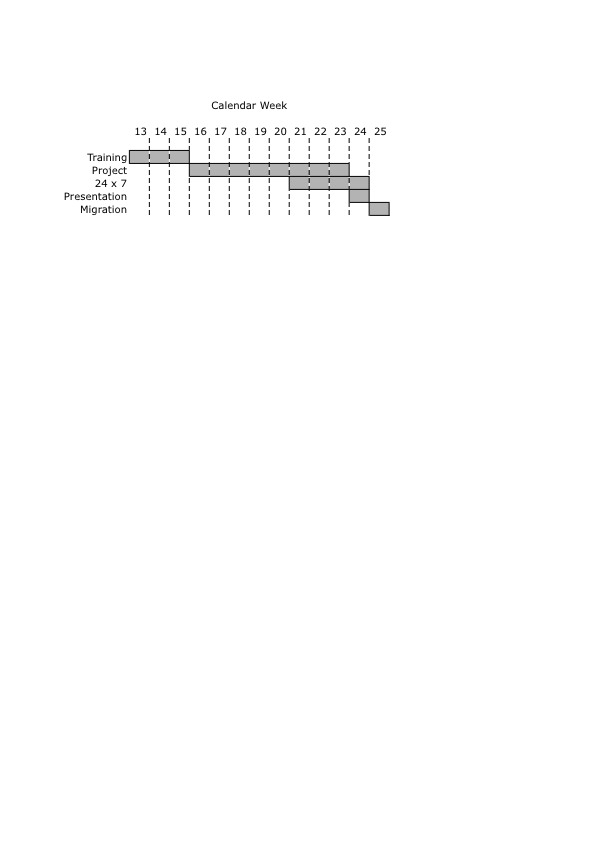 | Figure 1. Project Phases |
All projects had three main phases (see figure 1). The training phase (calendar week 13 to 15) was about to get all students into touch with the cloud service provider tool suite. In the project phase (calendar week 16 to 23) all groups had to develop a cloud based solution for project 1 or project 2. All groups had to proof that their solutions were adequate for a 24x7 operation (calendar week 21 to 24). So project and 24x7 phase overlapped within period of three weeks. Calendar week 24 was used for the system presentations. The practical course of the lecture finished with a migration phase. The best solutions were used as website (project 1) or Google maps based automatic sailbot tracking service (project 2) for the conference and were migrated to the destination environment (which also was a cloud based environment) in calendar week 25.The project phases have been designed to generate peaky usage characteristics (training and project) as well as constant load scenarios (24x7, presentation and migration). It is very well understood that cloud economics prefer peaky usage characteristics but show disadvantages covering constant load scenarios[1],[10]. So the setting (see figure 1) was chosen to cover both relevant aspects of cloud economics. Both aspects should appear in pure (only peak loads, CW 13–20; only constant loads, CW 25) and in a combined manner (constant loads with additional peak loads, CW 21 - 24) in order to have the analytical opportunities to derive interesting aspects how to operate virtual labs efficiently.
3. Decision Making Model
Weinman[12] stresses the following interesting fact which is a crucial input for pragmatic decision making for or against cloud based system implementations especially on a IaaS level of cloud computing:“[...] a pure cloud solution also makes sense even if its unit cost is higher, as long as the peak-to-average ratio of the demand curve is higher than the cost differential between on-demand and dedicated capacity. In other words, even if cloud services cost, say, twice as much, a pure cloud solution makes sense for those demand curves where the peak-to- average ratio is two-to-one or higher.”[12]According to Weinman the peak-to-average ratio is the essential indicator whether a cloud based approach is economical reasonable or not. So it is not necessary to estimate costs per month of a cloud based solution exactly. It is sufficient to proof that cloud based costs are smaller than a dedicated system implementation. This can be figured out by analysing the peak usage as well as the average usage of a system.Due to page limitations we will use the average to peak ratio atp in a simplified form and refer to[16] where the decision making model is presented in more detail. | (1) |
In cloud computing it is common to be billed for service usage per hour. So let us name our dedicated costs per hour d and our cloud costs per hour c. Cloud costs c can be easily figured out because being provided as pricing information by cloud service providers. Dedicated costs per hour d are a little more complex to calculate. Nevertheless for estimations we can assume, that they can be defined by their regeneration intervals. If a dedicated instance can be procured for p value units their dedicated costs per hour within that regeneration interval can be calculated in the following way (for example for a typical 3 or 5 year interval):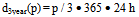 | (2) |
 | (3) |
So a 500$ server would generate approximately two cents of dedicated costs per hour regarding a regeneration interval of 3 years.d3year(500$) = 500$ / 3 • 365 • 24 h ≈ 0.019 $/hAccording to[12] the peak-to-average ratio pta should be greater than the relation between the variable costs c and the dedicated costs d which can be expressed in the following form: | (4) |
In other words this formula provides a clear decision criteria to decide for or against a cloud based approach. By knowing your average to peak ratio atp, your hardware procurement costs per instance p as well as your hardware regeneration timeframes (which are typically 3 or 5 years) it is possible to calculate a maximum of reasonable cloud costs cMAX. Whenever a cloud service provider can realize instance pricings below cMAX a cloud based approach is reasonable – in all other cases a cloud based approached should be avoided (just from an economical point of view, of course there might exist other higher order considerations). | (5) |
4. Analysed Case Study
In section 4.1 we will present our results from a cost perspective and in section 4.2 from a usage perspective. Let us have in mind, that our students had a virtually unlimited amount of servers they could use to solve their problem (see section 2). The following sections will analyse how this virtual unlimited amount of resources have been used over time and what this implicates to economical applicability of virtual labs in higher education.All data used in this section has been collected by the supporting cloud service provider AWS. The billing data as well as usage data was provided by AWS in CSV or XML format. Different cloud service providers may provide other but similar data formats. We used regular billing as well as EC2 usage data provided by AWS to all their customers. So anyone can run similar analytics by using a standard toolset (we used MySQL as a database and R as a analytical and visualization tool).
4.1. Cost Analysis
Table 1 shows all costs per group. In total the Lübeck University of Applied Sciences had to spend 847.01$ in providing (a virtual) unlimited amount of server instances to 49 students organized in 9 groups for a timeframe of 13 calendar weeks. This sounds impressive but says in fact nothing about how cost efficient the virtual lab approach was. Could have been reached the same result with a classical dedicated approach?Let us have a look at the cost analysis provided in figure 2. Figure 2(A) shows the costs per week and indicates that most of the costs were generated in 24x7 phase (calendar week 21 - 24). So 24x7 seems to be expensive.Figure 2(B) shows the main cost drivers. Almost 2/3 of the costs were generated by server uptime – that means running servers and being billed for per hour (server hours). Almost 1/3 of the costs were generated by data storage – that means all costs which have to do with the provision of server hard drives, backups or other data storage services. Other costs like network (requesting IP addresses, DNS names, etc.) or even data transfer had no relevant impact to the total costs. So the main cost driver was server uptime, the second relevant one was data storage. | | Group | Students | Project | Costs in $ | | A1 | 5 | WRSC Website | 88.39$ | | A2 | 6 | WRSC Website | 265.37$ | | A3 | 4 | WRSC Website | 88.14$ | | A4 | 6 | WRSC Website | 162.88$ | | B1 | 6 | Sailbot Tracking | 41.17$ | | B2 | 6 | Sailbot Tracking | 57.58$ | | B3 | 6 | Sailbot Tracking | 57.46$ | | B4 | 5 | Sailbot Tracking | 37.42$ | | B5 | 5 | Sailbot Tracking | 48.58$ |
|
|
Figure 2(C) show that analysed groups produced quite different costs. The expected value of cost responsibility would be 100%/9 ≈ 11.11%. Nevertheless the most cost efficient group (B 4) was only responsible for about 4% and the most cost ”lavish” group (A 2) was responsible for about 31% of the total costs. It turned out that the A groups (conference website) consumed more resources than the B groups (sailbot tracking groups). This is not so surprising: Different problems result in different costs! This is well accepted in cloud economics literature. Cloud generated costs are use case specific. Different problems result in different architectural solutions generating different cost behaviours[14],[15]. In other words cost (dis-)advantages are course or even task specific and therefore have to be figured out for each course.More surprising: It seems to turn out that groups with better grades produce significantly less costs. Nevertheless we did not have collected enough data to harden this correlation.
4.2. Usage Analysis
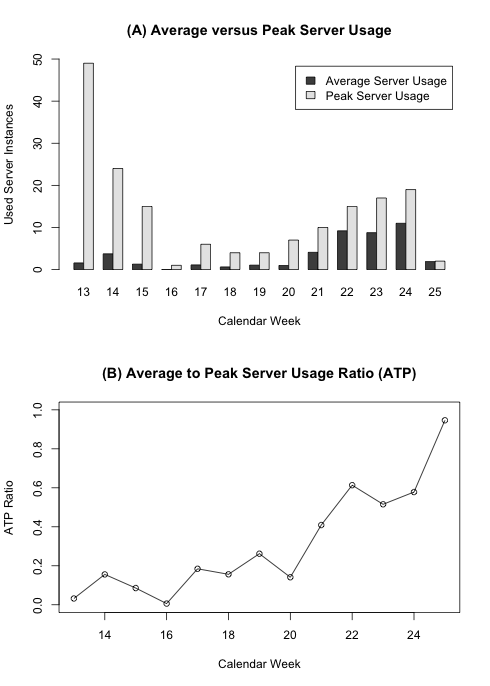
Figure 3(A) shows the peak and average server usage per calendar week measured within the analysed timeframe (calendar week 13 - 25). Figure 3(B) shows the average to peak ratio (atp) per calendar week. The atp is good indicator to measure how cloud compatible a solution is[12]. An atp ratio near 1.0 indicates non peaky usage characteristics which advantages classical dedicated approaches. An atp ratio near 0.0 indicates very peaky usage characteristics and therefore an appropriate cloud computing use case (you may want to step back to section 3 to figure this out). During the initial training phase (calendar week 13 - 15) the usage characteristic shows an extremely high maximum server usage but an astonishing low average server usage. This characterizes an extreme peak load situation and results in extreme low atp ratios (see figure 3(B)). According to equation 4 or the definition of cMAX this shows a very ideal cloud computing (peaky) situation. So training phases seems to be very economical interesting cloud computing use cases which is also postulated but not proven by Barr[10].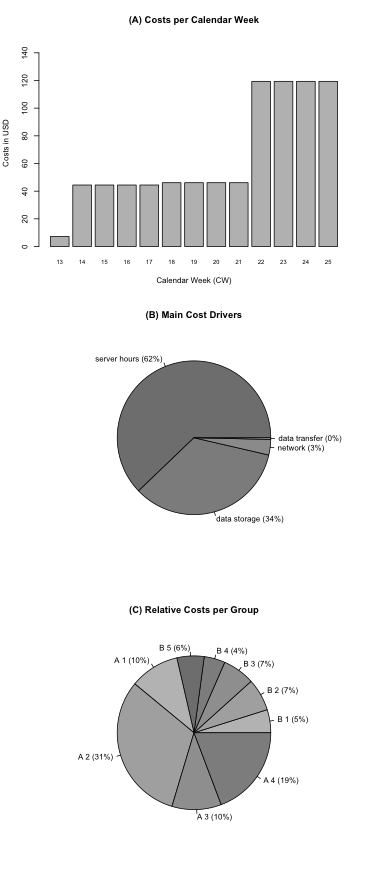 | Figure 2. Cost Analysis |
 | Figure 3. Usage Analysis |
During the project phase (calendar week 16 - 23) the usage characteristic shows dramatically reduced maximum as well as average box usages. Nevertheless the atp ratios (see figure 3(C)) stay in a very comfortable zone for cloud computing approaches. So we still have a peaky usage situation but on a significantly lower level. So also development phases seem to be very economical interesting cloud computing use cases being also postulated not also not proven by Barr[10].The 24x7 phase (calendar week 21 - 24) shows raised maximum as well as average box usages (see figure 3(A)). Also the atp ratios are higher – nevertheless the peaky usage characteristic remains but less distinctive. The migration phase (calendar week 25) was characterized by transferring the best solutions for the website and sailbot tracking service into the operational environment. During this phase the systems run in a constant load scenario as can be seen in figure 3(A) (almost the same average box as well as maximum usage) and in figure 3(B) (an atp ratio near 1.0). This shows an extreme uncomfortable situation for cloud computing economics – so constant loads seem to be no economical interesting virtual lab use cases.
4.3. Economical Decision Analysis
As we have seen in sections 4.1 and 4.2 we can identify different phases being more cloud compatible than others from an economical point of view. Training and development phases show very low atp ratios (see figure 3(B)) and therefore indicate peaky usage characteristics of resources which advantages cloud computing. Other phases with less peaky usage characteristics (like our 24x7 or migration phase) disadvantage cloud computing approaches. So we have identified pro and cons for a cloud based realization of educational labs. How to decide? Now we are going to apply our decision model presented in section 3.Step 1: Determine the atp Ratio Our analysis timeframe covered the calendar weeks 13 - 25. So an intuitive timeframe for average building would be 13 weeks – but this implicates a continual usage of an educational lab over a complete year (very uncommon). University or college educational labs are typically used one time per semester. Therefore an educational lab can be used only one time per semester (that means average building over 26 weeks) or even only one time per year (that means average building over 52 weeks). In our case 7612 hours of server usage were generated. So the average amount of servers to provide 7612 processing hours within a 26 or 52 weeks timeframe are:Now we can calculate our average to peak ratio. Maximum server usage was 49 servers per hour (see figure 3(A)). So we get the following atp ratios for a 26 or 52 week timeframe.atp26w = 1.74 / 49 ≈ 0.035atp52w = 0.87 / 49 ≈ 0.018Step 2: Determine dedicated costs First of all we have to find out how much would cost us a dedicated server. Let us assume for demonstration reasons that we could purchase an appropriate server for 500$. Equation 3 tells us to calculate our dedicated costs per hour in the following way for a three year regeneration interval:d3year(500$) = 500$ / (3 • 365 • 24 h) ≈ 0.019 $/hStep 3: Determine maximal cloud costs Furthermore equation 5 tells us to calculate our cMAX costs in the following way:cMAX(26w) = d3year(500$) / atp26w = 0.019 $/h / 0.035 ≈ 0.54 $/hcMAX(52w) = d3year(500$) / atp52w = 0.019 $/h / 0.018 ≈ 1.06 $/hIn other words: A cloud service provider (regarding a 3 year amortization time frame for servers) could be • 28.57 times more expensive in case of a one time per semester usable educational lab (1 / atp26w) or even • 55.56 times more expensive in case of a only one time per year usable educational lab (1 / atp52w) then own dedicated costs.Step 4: Determine appropriate cloud resourcesNow we know our maximal cloud costs and have to look if a cloud service provider can deliver appropriate resources. In our case this is Amazon Web Services, but it could be any other IaaS cloud service provider as well. We do this exemplarily for a 26 week timeframe. But it works absolutely the same for all other timeframes or IaaS cloud service providers.Table 2 shows all instance types of AWS and their allocated costs. Section 4.3 (step 3) told us, that all server instance types cheaper than 0.54 $/h result into cloud based solutions being more economical than dedicated approaches.As you can see in table 2, AWS provides several instance types in the US West Region being economical in the sense of section 3 and equations 4 and 5. The most appropriate instance types for the analysed course would be the Micro or Small (Standard) instance types. Both provide a significant cost advantage. But it would also be possible to realize exercises using XL (High Memory) server instances. Even server instances of this type would be economical reasonable for a cloud based approach.So in our analysed use case a virtual IT lab for education is much more economical than a dedicated approach.| Table 2. AWS Instance Types and Pricings, according to AWS pricing information on 23th Apr. 2012, US West Region, On-Demand Instances, Linux/UNIX Operating System |
| | AWS Instance Type | ECU | Memory | Price/h | Economical | | Micro | < 1 | 613 MB | $0,025 / h | Yes | | Small (Standard) | 1 | 1,7 GB | $0,090 / h | Yes | | Medium (Standard) | 2 | 3,75 GB | $0,180 / h | Yes | | Large (Standard) | 4 | 7,5 GB | $0,360 / h | Yes | | XL (Standard) | 8 | 15 GB | $0,072 / h | No | | XL (High Memory) | 6,5 | 17,1 GB | $0,506 / h | Yes | | 2 XL (High Memory) | 13 | 34,2 GB | $1,012 / h | No | | 4 XL (High Memory) | 26 | 68,4 GB | $2,024 / h | No | | Medium (Hi-CPU) | 5 | 1,7 GB | $0,186 / h | Yes | | XL (Hi-CPU) | 20 | 7 GB | $0,744 / h | Yes |
|
|
5. Conclusions
In section 5.1 we derive some general findings from our use case analysis useful to find interesting practical courses in higher education of computer science. These courses are likely to show similar cost characteristics compared to the analysed use case. Section 5.2 will show that the here presented approach is transferable to other lectures and related practical courses as well. Therefore some general advices are provided in section 5.3 for setting up cloud based virtual labs accompanied by some pragmatic cost control rules.
5.1. General Findings
Cloud computing economics are good for peak load scenarios being common in higher education practical courses. As equation 4 showed cloud computing becomes more and more economical as the peak to average ratio increases (or the atp decreases). This indicates that peaky as well as seldom usage of educational labs argue for cloud based virtual lab approaches, extreme continual usage of labs argue against cloud based approaches from an economical point of view. Nevertheless we always have to analyse the individual characteristic of a practical course by measuring its specific average to peak ratio.Cloud generated costs are use case specific. Different problems result in different realization architectures generating different costs as well as usage characteristics. So be aware of comparing non comparable use cases! You should run for each practical course the here mentioned cost analysis and decide for or against a cloud computing based virtual lab approach after you have figured out your practical course specific atp ratio.24x7 as well as constant load used cases seems to be expensive and of no economical interest for cloud computing if not associated with a peaky usage characteristic. So try to avoid 24x7 tasks in practical courses if possible. This will save a lot of money.One of the main cost driver is server uptime. Second relevant cost driver is data storage. Data transfer seems to have a minor impact to costs. This might be only valid for our analysed use case and should be handled with care. Please check out other publications (like Mazhelis et al.[11]) for communication intensive use cases if you plan to use communication/data transfer intensive use cases in your practical courses.
5.2. Transferability of the Approach
One interesting question is whether it is possible to transfer made experiences to other lectures and practical courses as well? Therefore all module descriptions of computer science (near) study programs of the Lübeck University of Applied Sciences were analysed. The following lectures and related practical courses showed potential being supported by virtual labs.• Industrial Networks and Databases• Information Technology• Web Technologies• Database Management (and Engineering)• Integrated Information Systems• Distributed Systems• Operating Systems (if Linux/UNIX based) Regarding all analysed module descriptions of according computer science related study programs it turned out that 8.33% to 23.10% of all practical courses are likely candidates to be supported by virtual labs. Whether these practical courses will show similar cost advantages is up for ongoing research. Nevertheless it seems very likely regarding made experiences. To identify virtual lab compatible lectures and practical courses it is helpful to know what the identified courses have in common. That is what we found out so far:• a course requires databases• a course has distributed processing requirements• a course requires web technologies on servers• a course requires Linux/Unix based servers• a course requires parallel processing capabilities• a course requires large-scale data processingWhenever there exist a practical course with one of the mentioned educational requirements a virtual lab might be a reasonable option.
5.3. Advices for setting up Virtual Labs
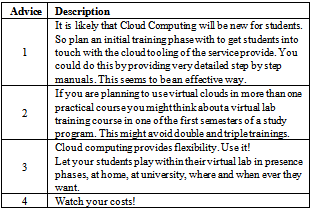
A lot can be learned about providing virtual labs to students via cloud computing means. Some of our made experiences are provided as advices for everyone planning similar approaches (see table 3).Table 3. Advices
 |
| |
|
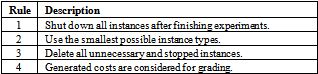
We further found out that costs are mainly generated by two or three main cost drivers. Everyone should concentrate on controlling these few cost drivers by applying simple rules. Table 4 provides some effective rules for computing intensive use cases.Table 4. Cost Control Rules for Virtual Lab Users
 |
| |
|
First cost driver is server uptime. Whenever a server is running money flows. This has to be made very clear to students by implementing Rule 1: Shut down all instances after finishing your experiments. Some cloud providers have APIs to control resources. You may think about developing garbage collector scripts shutting down every running instance at midnight? This will discipline even lazy students. Most cloud service providers provide different instance types, which can be formalised in another rule. Rule Nr. 2: Use the smallest instance types for experiments. It is always possible to upscale.Second most relevant cost driver is data. And every instance produces storage costs, cover this with Rule Nr. 3: Delete all unnecessary instances. Some cloud providers provide detailed access control settings. Use them to let no group (account) instantiate more than a limited amount of instances in parallel.And to increase a general cost awareness it is good to establish Rule Nr. 4: Generated costs are considered for grading. If two groups show the same performance, the one with less generated cost will get the better grade. So resource consumption will not become key criteria for grading. But our experiences show that the rules shown in table 4 discipline a lot and are practicable.
6. Summary
Not mentioned explicitly so far. Cloud based virtual labs are extremely scalable. The presented approach is working with 10 students. It is also working with 100 or even 1000 or more students and stays economical. Higher education organizations only have to provide more virtual labs but do not have to invest into dedicated hardware with a typical three or five year or even longer financial commitment (e.g. for buildings). That provides flexibility and options to manage periods with a significant increase or decrease of students.Nevertheless not all practical courses are virtual lab compatible. This might be of technical, functional or of economical reasons. This contribution presented a pragmatic model to decide for or against virtual labs from an economical point of view. We applied this decision making model (see section 3) in a concrete use case (see section 4) and it turned out that cloud based educational labs can have a more than 25 to 50 times cost advantage (see section 4.3) compared to classical dedicated approaches. But be aware. Cost advantages are course specific. There exist no general cost advantage of cloud computing.Furthermore this contribution refined some general findings to identify cloud compatible lectures and practical courses (see section 5.1) and showed that the approach of virtual labs is transferable to a significant amount of practical courses in computer science related study programs (see section 5.2). Other study programs have not been analysed but the presented virtual lab approach is not necessarily bound to computer science study programs. Transferability analysis showed that courses with requirements of providing databases, distributed processing capabilities, parallel processing or large-scale data processing are interesting candidates. These requirements might be also typical for practical courses in engineering study programs. The concept of a virtual lab can be applied frictionless to classical as well as distance study programmes and it provides a convenient (and often cost effective) infrastructure for project as well as problem based learning in computer science and other engineering related study programmes. In our case a virtual lab can be provided for approximately 18 USD per semester and student.
ACKNOWLEDGEMENTS
Thanks to Amazon Web Services for supporting our ongoing research with several research as well as educational grants. This paper is a streamlined version of a similar paper submitted to CSEDU2012 conference being accepted as a full paper. Thanks to all reviewers for their valuable comments how to improve this paper. I appreciated all the valuable discussions around this paper during the CSEDU2012 conference – especially the idea to make it easily accessible for everyone by using a free and online journal specialized on education. Thanks to my students and Michael Breuker for using cloud computing in practical education. This contribution would not exist without their engagement. Finally let me thank Alexander Schlaefer and Uwe Krohn for organizing the World Robotic Sailing Championship 2011 in Lübeck and their confidence in our students.
References
| [1] | Talukader, A. K., Zimmermann, L., and Prahalad, H. (2010). Cloud economics: Principles, costs and benefits. In Cloud Computing - Computer Communications and Networks, volume 4, pages 343–360. Springer. |
| [2] | Cayirci, E., Rong, C., Huiskamp, W., and Verkoelen, C. (2009). Snow leopard cloud: A multi-national education training and experimentation cloud and its security chalenges. In LNCS CloudCom 2009, pages 57 – 68. Springer. |
| [3] | Oberg, M., Woitaszek, M., Voran, T., and Tufo, H. M. (2011). A system architecture supporting high-performance and cloud computing in an academic consortium environment.Computer Science - Research and Development. |
| [4] | Dong, B., Zheng, Q., Qiao, M., Shu, J., and Yang, J. (2009). Bluesky cloud framework: An e-learning framework embracing cloud computing.In LNCS CloudCom 2009, pages 577–582. Springer. |
| [5] | Ko, C.-C. and Young, S. S.-C. (2011). Explore the next generation of cloud-based e-learning environment. In LNCS Edutainment 2011, pages 107–114. Springer. |
| [6] | Masud, A. H. and Huang, X. (2011). Esaas: A new education software model in e-learning systems. In Proceedings of ICCIC 2011, pages 468–475. Springer. |
| [7] | Li, N. and Li, G. (2011). Research on digital campus based on cloud computing. In Proceedings of CESM2011, pages 213–218. Springer. |
| [8] | Liang, P.-H. and Yang, J.-M. (2011). Virtual personalized learning environment (vple) on the cloud. In Proceedings of WISM 2011 (LNCS), pages 403–411. Springer. |
| [9] | Thiébaut, D., Li, Y., Jaunzeikare, D., Cheng, A., Recto, E. R., Riggs, G., Zhao, X. T., Stolpestad, T., and Nyguyen, C. L. T. (2011).Processing wikipedia dumps - a case-study comparing xgrid and mapreduce approaches. In Proc. of the 1st international Conference on Cloud Computing and Services Science (CLOSER2011). |
| [10] | Barr, J. (2010). Host your Web Site in the Cloud. sitepoint. |
| [11] | Mazhelis,O., Tyrvä̈inen,P., Eeik,T.K., and Hiltunen,J. (2011). Dedicated vs on-demand infrastructure costs in communications-intensive applications. In Proc. of the 1st international Conference on Cloud Computing and Services Science (CLOSER2011), pages 362–370. |
| [12] | Weinmann,J.(2011).Mathematical proof of the inevitability of cloud computing.http://www.JoeWeinman.com/Resources/JoeWeinman Inevitability Of Cloud.pdf. |
| [13] | Kratzke, N. (2011a). Cloud-based it management impacts. In Proceedings of CLOSER 2011, pages 145–151. |
| [14] | Kratzke, N. (2011b). Overcoming ex ante cost intransparency of clouds. In Proceedings CLOSER2011 (special session on Business Systems and Aligned IT Services - BITS 2011), pages 707–716. |
| [15] | Kratzke, N. (2012a). Cloud computing costs and benefits (to be published). In Ivanov, van Sinderen, and Shishkov, editors, Cloud Computing and Service Science, Lecture Notes in Business Information Processing. Springer. |
| [16] | Kratzke, N. (2012b). What cost us cloud computing? how to decide for or against iaas using the average to peak ratio atp. In Proceedings of CLOSER2012. |
 Abstract
 Reference
 Full-Text PDF
 Full-Text HTML