Prince Jessii
Research Scientist, Imo State, Nigeria
Correspondence to: Prince Jessii, Research Scientist, Imo State, Nigeria.
| Email: |  |
Copyright © 2026 The Author(s). Published by Scientific & Academic Publishing.
This work is licensed under the Creative Commons Attribution International License (CC BY).
http://creativecommons.org/licenses/by/4.0/

Abstract
This publication contains archival findings from Prince Jessii's 2022 discovery of Ultimate Relativity. This work proposes Stake Theory, the π theory footprints in economics, generally known as Ultimate Relativity (UR). In elementary education, numerous hypotheses and findings were presented without recognizing their foundational value or significance, regardless of whether they were erroneous or accurate. In economics, the influence of the universe's originator value (3.125) is observed to be as high as 98% and more. Utilizing cycles (circles) and curves for representations of demand and supply, gains and losses, and employing pie charts for statistical analysis, with percentages as a fundamental element, extending to concepts such as growth, trading, interests, and beyond. These footprints are the data that supports the establishment of a Default Economy Model backed up by the discovery of the true Pi value. Bypassing the appropriate procedures appeared to be customary in physics and mathematics; yet, what were the consequences of this approach? After steps are being omitted and recognizing the inability to find a solution, steps will eventually be retraced from the beginning, finding out that the constant (π) offers a general solution. With Ultimate Relativity, the value of Pi is now widely recognized as the entity representing the universe's origin; hence, every facet of existence, including economics, is interconnected with Pi, necessitating ongoing validation. UR spills the truth, this time to discuss economics and to present the true value of Pi and its theoretical implications in the field. Consequently, this study uncovers insights and identifies the fundamental principles of economics associated with the value, elucidating the underlying dynamics of the field.
Keywords:
Ultimate Relativity, Stake Ratio, Stake Formula, Interest, Stake rule
Cite this paper: Prince Jessii, Stake Theory: UR (π) II, American Journal of Economics, Vol. 16 No. 1, 2026, pp. 1-22. doi: 10.5923/j.economics.20261601.01.
Note: The reader is required to download and read [8] UR  I before this paper.
1. Introduction (Ultimate Relativity)
 | Figure 1. Pi cycle |
You were told that Economics is the social science that studies how individuals, businesses, governments, and nations make choices on allocating limited resources to satisfy unlimited wants. Perhaps I have no other subject other than Economics to present this theory to the world; this would add to your definition of Economics. If the Earth is all matter and we have different major kinds (plants, animals, humans, elements, etc.), there exists a guide to how they fit into the concept and purpose of the Universe. Just like putting a cat, a snake, and a lion in one room without management. This guide tells us how the kinds of matter can be managed, and this is what this aspect of Ultimate Relativity is about. Before diving into proper Economics. Let us revisit a time after the Earth's formation, characterized by the presence of humans, animals, fruits, trees (plants), and the elements. In this period, there are no currencies, no businesses, and nothing like investments, bonds, or shares; just the natural resources existing. It was only an uncomplicated and direct existence. The Earth (soil) can regenerate plants and trees, while humans and animals can reproduce. The Earth possessed concealed minerals dispersed throughout. Essentially, all of these are subject to human control. Humans derive sustenance from plants and animals, although a balance must be maintained. Consequently, their responsibility is to ensure the reproduction of these entities (flora and fauna). Pi generated all of them, yet to maintain equilibrium, the essential element is humanity. Trade arose from the existence of distinct animals and plants in various locations, contrasting with the offerings of other regions. Certain regions were devoid of human presence, while others were sufficiently populated. Certain regions possessed a certain mineral, while others were devoid of it. This is the origin of trading, based on the exchange of goods and services according to desires and necessities (Figure 1). Trading involves the acquisition and disposition of products and services to generate profits, facilitated primarily by human agents. If humans fail to restore or regenerate these resources after consumption or trade, a problem arises in the impacted area. There must be equilibrium, which I define as Economics, a science focused on humans establishing this balance. If Pi is mathematically the originator of all things, then the transfer of those creations from one location to another is regulated by Pi; this includes the increase and decrease of the kinds of matter. Figure 1 clearly illustrates the presence of a circumference. Ultimate Relativity posits that all entities in the Universe are interconnected by Pi. Theoretically, every theory or equation is associated with the value of Pi, because it forms the physical constants of the Universe. What occurrences in the Universe are not tied to Pi in some way? The presence of atoms and electrons in Pi geometry indicates that an answer to that topic will remain elusive. Pi generated the circle possessing a circumference. The circumference is the fundamental concept behind Pi geometry. If Pi is the progenitor of the universe, then geometry as circumference accounts for the morphology of atoms [11], planets and their rotation and revolution around a star, as well as the formation of fruits, trees, seeds, and eggs and the design of automobiles, airplanes, and other technology [9]. I could go on and on with this list all day. It is also the reason you can cook to eat; you know. How does stirring (turning, mixing, or blending your food) relate to Pi geometry, in your opinion? Therefore, we have something to learn about this topic, which is economics. Although there are currencies, companies, and investments in the modern era, the crucial phrase "Profit and Loss" encapsulates all of the originator's traces and has existed from the beginning of the universe. Gains and losses are universal in this; the birth and death of living things is a common example, aside from all other attributes and characteristics of this universe. You are either winning or losing in this world because the universe is designed to accept gains and losses (positive and negative growth). A nation can experience both gains and losses, which is actually crucial to its economy, just as the planet Earth itself can experience daily losses and gains. All of these, nevertheless, involve giving and receiving between two parties. There is always someone winning when you lose. The gain for Mr. B is the loss for Mr. A, and vice versa. Even so, it is referred to as "loss," which is beneficial to one person but detrimental to another. To put it simply, this entire process is known as giving and receiving. Hence, something is at stake. A Pi shape's special quality that sets it apart from other shapes is that it symbolizes the circumference which enables an object to move from one point and return back to that same point without reversing, which is where exponential growth was created. You may not realize it previously, but Pi governs these processes, which is why you can lose and still benefit from the same process (cycle). With the correct procedure, you could still recover your losses. Therefore, Figure 1 is the only way to illustrate this explanation of giving and receiving. Figure 1 depicts two individuals, one giving with one hand and receiving with the other. The point at which the other person is providing is also the receiving point, and vice versa. In actuality, the demonstration is the strength of the original (Pi) by forming a circumference representing continuity. Moving forward to learn more by revealing the first section.
2. Balance of Life (I)
Economics is the study of how people, businesses, and governments make choices about using limited resources (like time, money, land, or labour) to satisfy unlimited wants and needs. In my opinion, everything about economics is about control and regulations by humans to create a balance. Before satisfying the wants and needs, there must be a balance. Without the balance, this whole process could be insignificant. Pi created these entities (everything in the universe) [6], [7], [9]; hence, we need to understand the nature of these things and then ask Pi for help on how to control these resources. This section is divided into two parts, “Balance of life I and II.” The second part will be used to conclude the UR concept in this paper. I have always talked about the blueprint of the Universe and how to interpret it. With all we’ve known from [8], we should realize that the blueprint is basically the structure we see in Figure 7, but it is required to look deep and relate it to all branches of science.You also have to read and understand the seven maths scroll of the Universe; it helps to understand this paper better. Again, we turn to Pi for answers on how we can control the resources given to us.We need to take note of the following points for better understanding;• There are four numbers (1,2,3, and 5) forming the Pi value, responsible for a circle’s formation (circumference). This is the base of the blueprint.• All four numbers are prime which means they have something in common.• Out of the four numbers, only 2 is an even number, the others (1,3,5) are odd numbers.• Out of the four numbers, 1 doesn’t create multiples.• In Trigonometry root ratios aligned with TFZ in [8], only 1,2, and 3 formed the trigonometry ratios, 5 wasn’t present.• In Binary, which is the idea behind man creating the extraordinary things in the Universe (computer hardware/software, data storage, networking and communication, digital logic and circuits etc), the number 1,2, and 5 are behind its establishment.These are the main points, every other point involving the four numbers in UR are secondary in relation to Economics. If you understand these six points, we can now proceed for some discovery, but first we need to build the basics with these numbers as a task.
2.1. Root Identity of FZ numbers
The four zodiac numbers represent the entities in the universe, we don’t know yet. These numbers speak to us through their uniqueness, we just have to use the findings from [8] to interpret. The Earth is made up of different kinds of matter as we know. In this case, we have to group these different kinds of matter based on the nature of the four zodiac numbers described using the six points. We see the plants, humans, animals, water, sand, air and the rest of the natural things on Earth. So how do we group them? Let’s start with 1.One (1): 1 is the original form of all numbers. In UR physics [9], if a number is a Pi code and we continuously divide that number by any of the zodiacs 2, 3, and 5 or a combination, the final result of the continuous division is always 1. Not just that, if we divide a number by itself, we get 1. Hence, one will represent something that the other three (2, 3, and 5) depend on; 1 will be the original form of every other matter in a planet or universe. I hope the reader agrees with me. Thus, I reveal the identity of 1 as the Elements. Elements – Compounds (natural resources, minerals, everything from the surface downwards (beneath).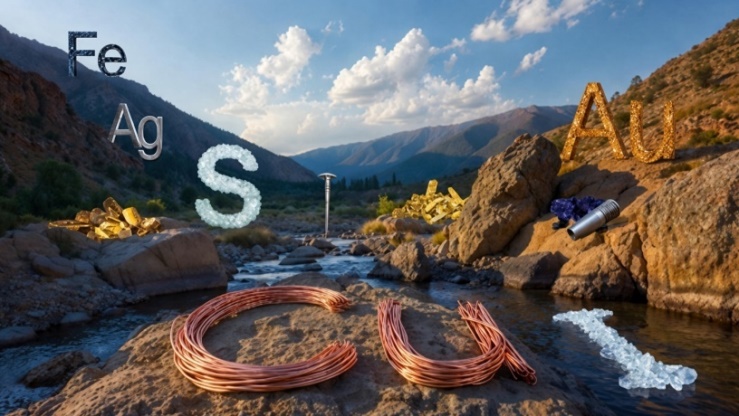 | Figure 2. Photo/-Elements |
We now see that they don’t multiply, just like 1 doesn’t multiply. Which means that the amount of air, water, sand, salt, crude oil, etc, on Earth doesn’t multiply. It can be used and reused and transformed, but it doesn’t create multiples. Two (2): There is a distinctive quality to the number 2, as it is the only "even" number among the trio of odd numbers (1, 3, 5). We ought to think about natural components that differ from other natural entities. This is really straightforward. In the field of Biology, all entities in the universe can be categorized as either biotic (life) or abiotic (non-living). The sole issue I encounter here pertains to the plants. The confusion is from the fact that scientists categorized plants as living things because they have cells, but cells are not the reason for being a living thing. The sole significant distinction between plants and creatures is that plants are immobile (do not walk, speak, etc.), whereas beings are capable of movement. Consequently, plants cannot be classified inside this category, as they do not inhabit both dimensions; this belongs to the realm of physics. When the UR III, IV, and V paper is out, you’ll understand better. The distinctiveness of 2 arises from the notion that beings include two components associated with two dimensions (inside and upon spacetime). Their presence in space-time enables them to navigate (travel) through space-time naturally without an external source of energy. What renders 2 even amidst the odds is its existence with a component from the alternate dimension. This necessitates an understanding of UR physics. Nonetheless, it is understood that beings possess distinctiveness as authentic living entities. Consequently, I am characterizing 2 as living creatures, and indeed, they possess the ability to reproduce. The human population on Earth 4000 years ago differs from the current population. Their quantities can increase and decrease.
 | Figure 3. Photo/-Humans, Creatures – Humans (animals, insects, bacteria etc) |
Three (3): This is somewhat not straightforward, although it serves as a continuation from the identification of 2. The sole clue available to us is 2. Therefore, we must revisit the blueprint for guidance [8]. The converging lines signify a combination, as the four segments interconnect, relying on one another for support. The direct connections (horizontal/vertical) between 1-5 and 2-3 indicate that 1 requires 5 directly and vice versa, whereas 2 necessitates 3 directly and vice versa. The inquiry is, what necessitates 2 to directly require 3? What is the significance of 3 to require 2 directly? We are now aware of the identity of 2, but what do they require from 3? I believe we are aware of this. Therefore, I am characterizing 3 as the vegetation. The living creatures require the vegetation for sustenance (food) and medicinal purposes for their growth and survival. They are capable of growing and replication, although they require 2 to facilitate their rapid multiplication and sustain their survival. We shall revisit this reality.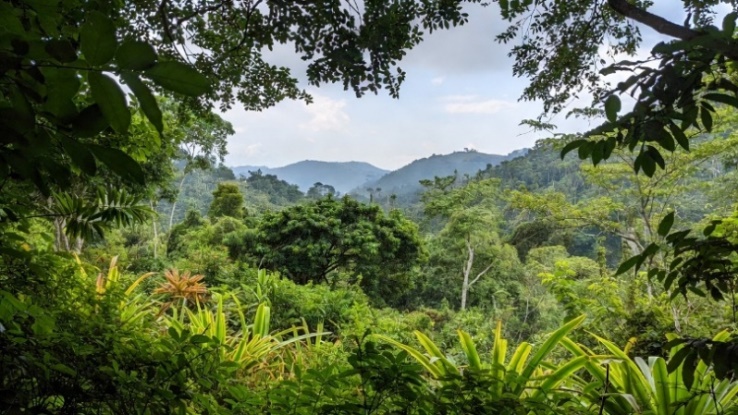 | Figure 4. Photo/-Vegetation, Vegetation – Plants, trees (fruits, leaves, seeds) |
Five (5): In the trigonometry-four zodiac section in [8], the ratios were shown, but the number 5 was missing, with only 1, 2, and 3 included. Let us examine. If 1 possesses a unique characteristic that prevents it from multiplying, if 2 has a distinctive quality that renders it even amidst the odd numbers, and if 3 simply exists. What is the reason for a fourth numeral? Is it intended for equilibrium (circle formation)? I believe equilibrium might be the answer, yet with 1, 2, and 3, we have grouped all possible natural components on a planet. One can comprehend the absence of 5 in the trigonometric-zodiac root ratios, particularly for those familiar with UR. Following the formation of a planet, every component was natural, represented by the three numbers (1, 2, and 3) found in trigonometry's four zodiac principles of the roots. It is intriguing that the cosmos was designed to accommodate a fourth component. It is now evident that the fourth component (5) responsible for achieving equilibrium is of artificial creations. This is the justification for the blueprint indicating; 1-5, 2-3. 5 is directly reliant on 1; we cannot fabricate man-made without elements 1, which encompasses natural resources, compounds, minerals, etc. 1 seek 5 for transformation. They cannot merely exist in their current state without being utilized and transformed to something remarkable; the essence of existence is to evolve from 1 to 5. Thus, 5 represents man-made. | Figure 5. Photo/-Man-made, Man-made – buildings, cars, aeroplane, robots, technology etc. |
2.2. Universe 1-2-3-5
When we refer to the "Universe," we often utilize a planet for discussion. The cosmos fundamentally consists of planets and those celestial bodies that didn’t solidify, namely the stars. The schematic applies to the Universe as a whole, as well as to the planets in particular. Notwithstanding the direct horizontal and vertical lines (1-5, 2-3), the crossing lines indicate that the four components are interdependent, as humans require air for respiration and water for hydration, both of which are included in the Elements (1), so 2 necessitates 1 in some manner. The vegetation requires the soil along with extra elements for development; hence, 3 need 1 as well. Certain artificial objects are constructed with timber sourced from trees, along with their foliage. 5 requires 3 in a particular manner. Consequently, the four factions (Figure 6) are interdependent in various respects, with 1 as the original form of the other three components. These four categories of matter constitute what a fully solidified planet encompasses, or what the Universe comprises. Economics, in essence, is also the discipline that establishes the equilibrium among these four categories appropriately; this summarizes my comprehension of the purpose of Economics. | Figure 6. Blueprint Layer 1, • 1-Elements; • 2-Creatures; • 3-Vegetation; • 5-Man-made |
Balance of Life II teaches us more.
3. Origin of Growth and Percentage
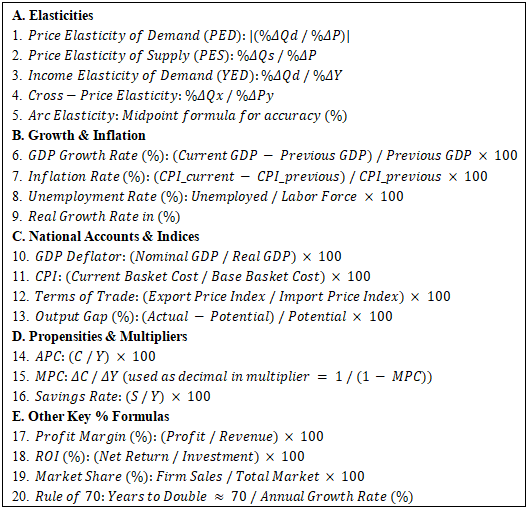
Before our comprehension of Economics, the original design was present, detailing percentage as a relative aspect of growth. A comprehensive analysis reveals that our whole knowledge of Economics is intrinsically connected to growth and percentage. It plays a crucial role in achieving balance. If we seek validation, we should just review the formulas. Table 1 includes just a minimal variety.Table 1
 |
| |
|
Economics as a science subject comprises up to 30 formulas that feature the percentage (100). Growth encompasses both an increase and reduction; it may also denote gain or deficit, suggesting the existence of both negative and positive growth. Growth is the second mathematical concept of the Universe. This signifies that a brief period after the emergence of the Universe and planets, expansion (growth) begins. Life forms and plant life commence their development.This chapter is also designed for those in the mathematical community and practitioners of mathematics. In the field of Mathematics, a percentage is defined as a ratio articulated as a fraction of 100. A person, presumably a mathematician, identified the importance and function of the number "100" in the computation of percentages. Within Economics, a significant number of operations utilize percentages, focusing on growth or variations, such as;• Profit and Loss• Demand and Supply• GDP growth• Inflation rates• Economic Growth rate• Market share etc.A number of aspects could be added to the preceding list; nevertheless, the critical question is, why is the percentage utilized in various economic scenarios? The solution is explicitly outlined in the explanation presented in chapter 1 (Introduction) regarding the dynamics of growth as they pertain to the originator of the cosmos. Every facet of Economics encompasses 1, 2, 3, and 5; hence, growth is the subsequent focus, pertinent to 2, 3, and 5.Each time a value exhibits considerable effectiveness, we should consistently question whether Pi is directly or indirectly responsible for the number's operational characteristics. Consequently, we should investigate more thoroughly. In the same manner that Pi was revealed to be integral to prime numbers, physical constants hold similar significance. It is authentically a catalyst for growth and proportion as indicated in [8].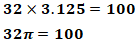 The digits 1, 2, 3, and 5 that constituted the Pi value (3.125) were disclosed as "Four Zodiac Numbers." I employed the term "Zodiac," prompting some people to assume I was referring to astrological signs. To clarify, my findings are unrelated to zodiac signs or astrology. Be attentive if you are confused; an alternative term for "zodiac" is "circle." Four zodiac numerals are simply the four numbers that dictate a circular configuration. Another revelation from the same four zodiac symbolic teachings pertains to the utilization of percentage to establish the growth rate, which illustrates the connection between percentage and growth. For instance;With 40%, the growth rate becomes;
 Financially, it is believed that an investment must result to either gains or losses, regardless of what you’re investing in or the material used for the investment. This brings us to the next chapter.
3.1. Growth Rate
People praise the Euler constant/number even though its concept and definition are clearly incorrect and insignificant as a definition. Euler fulfilled his role, motivated by his scepticism and curiosity, while future mathematicians were tasked with rectifying and enhancing the inaccuracies. I believe that there were many individuals posing as mathematicians who were unable to discern erroneous approaches. Based on [8], all amendments concerning the growth rate and e were executed, and the blueprint presented two forms of growth characterized by a straight line and a curve.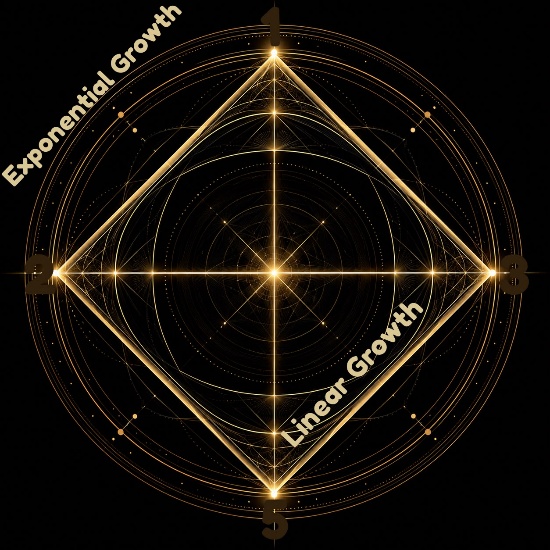 | Figure 7. Blueprint (Growth) |
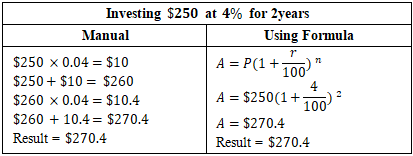
 This explains why instances of linear growth are rare in nature. Fundamentally, growth can be categorized as either linear growth, exponential growth, or a hybrid of the two. The fact that all existing natural things are in Pi shape would imply that linear growth would have very few examples in nature, or none at all.Definition of Linear Growth: The quantity increases by a fixed amount in each time period. The rate of change is constant.Example of Linear Growth is Simple Interest, we all know about simple interest;You invest $1,000 at 5% simple interest per year.• Fixed interest per year = $1,000 × 0.05 = $50Linear growth is very insignificant in the Universe.Definition of Exponential Growth: The quantity increases by a fixed percentage (or multiplies by a constant factor) in each time period. The result itself grows larger with time. As evidenced in [8], exponential development manifests as a curve, affirming its legitimacy in the natural world.An Example of exponential growth is Compound Interest.
Table 2
 |
| |
|
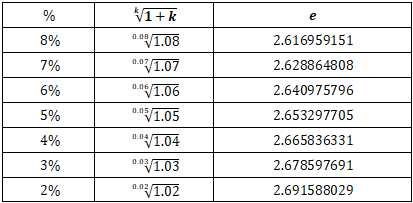
Both of these methods are entirely precise and they are employed by financial institutions, but the introduction of e as a third approach caused some uncertainty, which was not well-received by these organizations. It appears that there are three primary formulas for exponential development, all of which produce precise outcomes; I have just demonstrated two using Table 2. The third involves e, and it is precise.Table 3
 |
| |
|
Reintroducing Table 3 from [8] following the clarification of the genuine essence of e. I have reached the conclusion that e is not a constant; rather, it produces variations of itself corresponding to each growth rate.If the table is not immediately comprehensible, check [8], but allow me to clarify: the increase or development corresponding to a specific rate is dictated by e, defined as follows: Where k is equal to the growth rate as
  , defined by
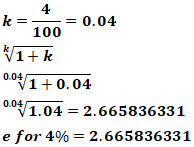
  . This is the explanation behind Table 3. I correspond with financial entities that do not regard the former e concept as a principle for growth financially, that’s totally wrong.With the same example, Investing
  at 4% for 2years;
 Compounding using e for
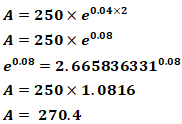
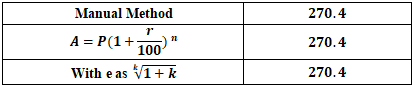 Read [8] for the changes on the theory and calculations behind e. Currently, the Universe allows for linear growth, although the circumference demonstrates Pi, which mathematically signifies the origin of the Universe. This is the reason we observe only very few and limited instances of linear growth in nature, as it represents a straight path. On the other hand, exponential growth is the genuine phenomenon for every growth in the universe and the most formidable. Here are some examples of exponential growth;1. Biology & Nature• Bacteria reproduction: A single bacterium can double every 20 minutes under ideal conditions. One becomes millions very quickly.• Viral spread (e.g., early stages of COVID-19 or flu): Each infected person infects multiple.• Population explosions (e.g., rabbits or invasive species) when resources are unlimited.2. Finance & Economics• Compound Interest (as we just calculated): Money grows exponentially because you earn interest on interest.• Stock market or investment growth over long periods with reinvested earnings.• Inflation (when it accelerates).3. Technology• Moore’s Law: The number of transistors on computer chips roughly doubles every two years.• Internet growth, smartphone adoption, or social media users in early phases.• AI capabilities and computing power in recent years.4. Chemistry & Physics• Nuclear chain reactions (e.g., in atomic bombs or reactors).• Uncontrolled chemical reactions or autocatalytic reactions.5. Everyday & Historical Examples• Chain letters or viral content: One person shares with 5 friends, each share with 5 more, etc.• Pandemic or epidemic spread (before interventions).Among these five categories that encompass all aspects of the cosmos, excluding elements, which cannot replicate, we observe that they exhibit exponential expansion. Only the elements are incapable of multiplication, as I previously established. There are plenty additional possibilities to consider. All these instances of exponential growth can be addressed both manually and through the formula;
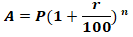 And using e values with the formula;
3.2. Stake Formula
From the blueprint, we find out that  is a product of
  in the sense that
  represents exponential growth which is a curve, and
  is everything about a curve.
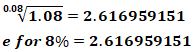 From the fact that
  we can also get e for a growth rate by dividing 32 by the rate and applying the resulting value in a formula as;
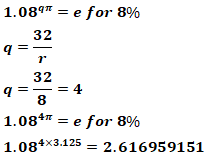 Finding e for a rate of 2%;
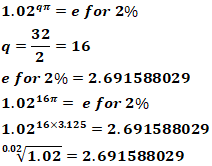 The above calculations might be easy but it shows the link between
  and
and 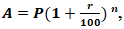 as both equations can be merged into a single equation as the Stake formula.Ultimate Relativity surpasses every other theory, applicable to subjects in all aspects. In Economics, I propose its coverage as ‘’Stake Theory’’. To show that the reason why the percentage (100) is common in this subject is due to Pi as the root of growth, I could add a fourth formula for growth but the formula
 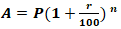 is a reduced version of a very much expanded formula that we didn’t know about, this is due to the power of the stake tool (growth rate, k) that can as well yield e for a growth rate.Normal standard or real structure of the formula is with
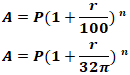 However, if I decide to incorporate both
  and
and 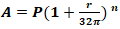 in a single formula, the expanded formula reveals itself through the stake theory as the stake formula for growth;
 Recalling from [8];
 The equation simply reveals that;
 This above equation is the calculation done earlier in showing the relationship with
  using
using  incorporating both methods would mean;
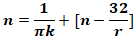 Using the example in play to test, investing
  at 4% for 2years, the aim is to get the correct answer which is 270.4.
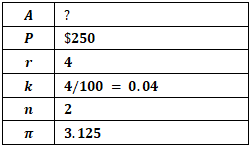 Inserting Parameters and testing with Stake formula;
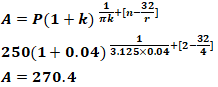 Another example; investing
  at 9% for 6years
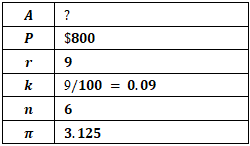 Testing with main formula;
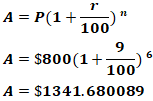 Testing with Stake formula;
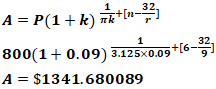 Nothing much to say here, just to showcase another angle of Pi’s hidden involvement in these formulas for growth. All the formulas in percentage 100 have the hidden Pi value, just like growth. In conclusion, 2, 3, and 5 are subject to growth and these are the components that can directly affect economic growth.
4. Balance of Life (II) – A Default Economy Model
 Earth Model: Guided by instinct, I believe we have come to understand the appropriate steps that must be taken. As an illustration, there will be a challenge of food scarcity/hunger if there exists a substantial surplus of humans in a locality compared to the requisite amount of agricultural produce to nourish them, this is the simplest, and I think this is a major fact; we don’t need anyone to tell us this part. Yet, this idea is also a rule from the blueprint; I know we wish for it to be seen as a principle, but here it is. Numerous directives are also outlined in the blueprint of the Universe. The Universe was established to integrate 5, which are the man-made entities, although at its core, it consists of 1, 2, and 3, which denote the elements, creatures, and vegetation. 5 will eventually be man’s creation, but it was all part of the plan. Now, there’s no way anybody can say that the Universe doesn’t have an originator. How does it know all we are about to do, to think that everything was planned? There’s always an originator of something.Presently, we do import and export. Why? Because we are trying to get what we don’t have from other countries, as well as other countries trying to get what they don’t have from us. For sustenance, humans (creatures) have the basics for survival, which is 1 and 3. Imagine a world where some countries don’t have air to breathe, water to drink (no atmosphere), and no soil to aid vegetation; this would be unbearable. At least these basic necessities are found everywhere. Humans (2) basically just need (1) generally with (3) as intake. I am referring to the first set of years after Earth’s formation, a time when everything must have been created, life was very simple and straightforward with the naturals (1:2:3 system). As time passes, humans create businesses, they trade, they create the extraordinary, build banks and financial institutions, form currencies, build structures, more advanced technology, etc. As long as the list can be, these are man-made, and it comes with complications in general. This is where the stake theory comes into play again to reveal a balance.
4.1. Stake Ratio
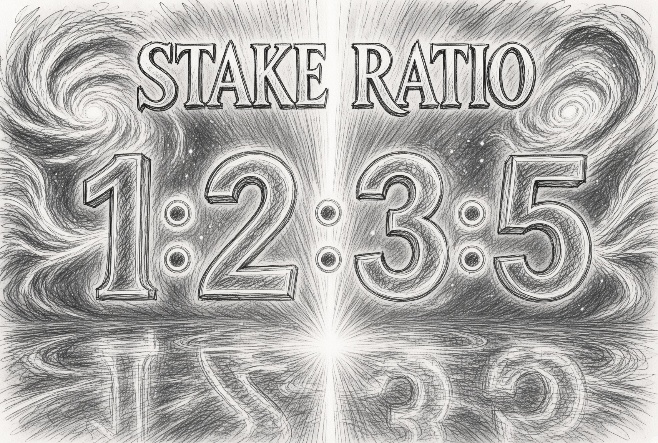 | Figure 8. Stake Ratio |
For a balance, we simply need a ratio. The Stake ratio is a ratio for control and balance of these four entities in an increasing order of quantity.The Stake ratio is simply;
 Each of the numbers represents the lower limit to the higher number. Since 5 is the last, it becomes the end point. In layman's language, it says, "You vegetation, you can’t go lower than creatures. Man-made, you can’t go lower than vegetation, and since you’re the last, you can’t exceed your position.’’
4.2. Stake Rule
The first stake rule arises from the ascending sequence of the ratios, although we must ascertain the significance of these ratios. It is impossible to quantify the creatures, vegetation, and man-made solely through counting. Therefore, it is essential to establish a common ground. We have not been paying sufficient attention to a subject known as biomass. Global biomass signifies the proportional amounts of living matter (measured in gigatons of carbon or Gt C) distributed among different organism groups (like plants versus animals) on the planet. In essence, global biomass ratios furnish a mass-based inventory of life that accentuates patterns of dominance (plants are the most prevalent; humans are the leading animals) and environmental variations (land versus ocean). We obviously can’t say that 1:2:3:5 is directly the amount of these entities, but we have something called "biomass," which we can use as a measurement. When biomass is used as a measurement, it does not mean energy directly. Instead, it refers to the total mass of living (or recently living) organic material in a given area or ecosystem. Biomass as a measurement is basically how much living material exists in a particular place at a specific time. Hence, biomass is for the naturals. What about man-made?Techno-mass refers to the total mass of all human-made structures, objects, and materials on Earth. It serves as a quantitative metric employed in disciplines such as industrial ecology, urban ecology, and sustainability research to evaluate humanity's observable influence on Earth, similar to how biomass quantifies the aggregate mass of living entities. • Biomass accumulates through biological productivity (net primary production). • Techno-mass accumulates through human industrial metabolism (extraction to processing to construction/manufacturing to stock build-up). Both (Techno-mass and Biomass describe how matter is mobilized, transformed, and stored on Earth’s surface.Consequently, through biomass and Techno-mass, the identity of the Stake ratio is unveiled, and the first principle is revealed.First Rule: Maintain the increasing order. As the ratio order increases, it indicates that man-made must surpass vegetation, while both vegetation and man-made should exceed the creatures. The Elements is 1, hence insignificant in this ratio context.Method:Step 1: Get the total biomass of all non-plant living things (creatures).Step 2: Get the total biomass of vegetation.Step 3: Get the techno-mass.Step 4: Form a ratio, reveal the result.Prior to testing and implementing this Method, it is essential to examine the relevance and implications of the Stake ratio.
4.3. Importance of the Stake Ratio
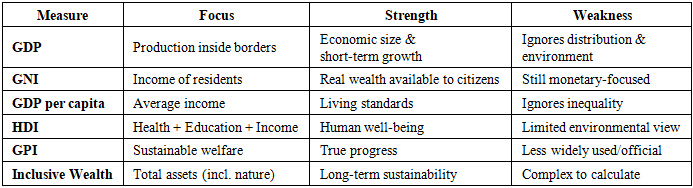
Unlike GDP, GNI, GDP per capita, GPI etc. that is being used to measure several areas related to Economic Growth, the Stake Ratio method is on the Grand Scale.Table 4 illustrates the many approaches to fostering economic growth. Upon closer examination, all these pertain to the intricate aspects associated with human inventions and creations, including commerce, trade, markets, education, and production. The stake ratio guarantees equilibrium within a planet, a nation, or a state. Neglect a single principle and it results in catastrophe. Prior to considering GDP, GNI, and other metrics, the first factor to assess when evaluating a nation's advancement is the Stake Ratio; all alternative techniques are secondary. This is due to the fact that, in the absence of elements, humanity cannot innovate. Without elements, vegetation and man-made, commerce, enterprises, and manufacturing will not be possible. Consequently, we must prioritize the Stake Ratio to ensure that the government or authorities formulate appropriate policies to avert catastrophe. This crisis arises from disregarding the Stake Ratio. Thus, the different methods of controlling economic growth are created by humans and are secondary to the primary significance of the Stake Ratio as to maintain equilibrium of the natural and man-made entities within a planet, nation, or area.Table 4
 |
| |
|
4.4. Significance of the Stake Ratio
Fast-forward to a time like today, in 2022; there are a lot of things that could cause an imbalance, things like labour shortages, war and conflict (can be swapped with natural disasters), technological disruptions, etc. When it comes to economics, how to manage/control the things on Earth in a way that doesn’t affect us as humans, we think about the ratio  Now, numerous natural factors could induce an imbalance, such as labour shortages, warfare and conflict (which may be replaced by natural disasters), famine, and so forth, even for man-made (technological disruptions). In the realm of Economics, the focus is on regulating Earth's resources to the benefit of humans (2 for creatures), often considering the ratio
  Humans belonging to 2 are the focal point to ensure control by applying the stake ratio. Thus, 2 as the humans will become the divisor during calculations.The primary elements influencing the economy are those directly associated with
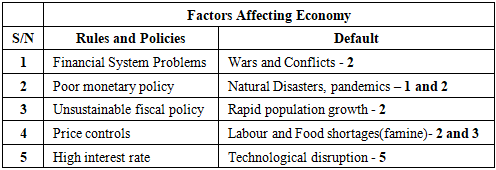
  while the remainder consists of regulations established by governmental authorities or regional leaders. This indicates that if the ratio for a region is compromised, policies should be formulated to restore the ratio to its standard before implementing any additional policies. Consequently, any policy established by the government ought to be designed to rectify the current discrepancy to restore the original ratio of 1:2:3:5, if the Stake ratio in that nation is not intact. Some nations already make policies to ensure a balance, yet we remain unaware of the balance or the appropriate ratio throughout these years. Let us demonstrate the categorization of the factors influencing an economy into two distinct categories. First, the rules and policies followed by the default.
 | Figure 9. Default |
The components that will profoundly and significantly influence a nation's economy are governed by the Stake ratio. The items in the default column of Table 5 on the right can undo years or decades of developmental advancements in one event; To reverse the situation, GDP, GNI, and other metrics cannot save a nation impacted by this; only the Stake ratio and its policies can be used to restore balance for situations involving the default. Consequently, the importance manifests as a discussion.Table 5
 |
| |
|
4.5. Discussion
Prior to my discussion, I will outline the advantages and disadvantages of 2, 3, and 5. The purpose of outlining the benefits and drawbacks is to demonstrate that a balance is essential.
4.5.1. Advantages of 2 (Living Creatures)
• Greater labour force and production capacity: More people mean more workers who can produce goods and services, raising total output (GDP). This expands tax revenues that can fund public goods such as infrastructure, healthcare, and education.• Larger pool of human capital and innovation: A bigger population increases the chance of talented individuals (scientists, inventors, entrepreneurs) emerging. This expands the stock of knowledge and drives technological progress. Endogenous growth models often link larger populations to more researchers and faster idea generation, which can raise productivity and even per-capita incomes over the long run.• Stronger domestic demand and markets: Growing populations expand consumer bases, supporting business expansion and attracting investment. Larger populations can also reduce per-capita costs of public goods and enable more ambitious collective projects.• Support for key economic sectors: Biodiversity enables agriculture (pollination by insects/bees contributes hundreds of billions annually to crop output), fisheries, forestry, and water management. Healthy ecosystems provide soil fertility, pest control, and genetic resources for crops/livestock.• Tourism and recreation revenues: Wildlife attracts visitors (safaris, birdwatching, nature tourism). Examples include substantial contributions from Africa’s safari industry and wildlife-related activity in other regions.
4.5.2. Disadvantages of 2 (Living Creatures)
• Capital shallowing and lower per-capita resources: Faster population growth spreads available capital (machinery, infrastructure, land) thinner across more workers. Neoclassical models (e.g., Solow) predict this lowers capital per worker, slows productivity growth, and reduces income per capita. High fertility also raises dependency ratios (more children relative to workers), diverting resources toward consumption and basic services rather than productive investment.• Strain on public services, infrastructure, and fiscal capacity: Rapid growth increases demand for schools, healthcare, housing, water, and jobs faster than governments can supply them. This raises costs, can worsen inequality and poverty traps, and makes it harder to invest in quality education/health that builds human capital. In extreme cases it contributes to unemployment, informal economies, and social instability that deter investment.• Resource pressure and environmental degradation: More people raise demand for food, energy, water, and land, potentially leading to diminishing returns in agriculture, overuse of natural resources, pollution, and higher costs of living. places.• Urban congestion and other inefficiencies: Dense, rapidly growing cities can face higher costs from overcrowding, traffic, housing shortages, and crime if planning lags.• Biodiversity loss and collapse of ecosystem services: Declines in species and healthy ecosystems reduce critical inputs to the economy—pollination, soil fertility, water purification, flood control, fisheries, timber, and climate regulation. • Invasive and overabundant species: Non-native or uncontrolled animals (and plants) cause large economic damages through crop/livestock losses, infrastructure damage, disease spread, and control costs. Global estimates of invasion costs run into hundreds of billions annually (conservative figures often cited around $423 billion or more, with much higher extrapolated totals), heavily impacting agriculture, fisheries, forestry, and related sectors. Feral animals alone have generated tens to hundreds of billions in documented damages.
4.5.3. Advantages of 3 (Vegetation)
• Oxygen production and climate regulation: Through photosynthesis, plants convert CO₂ into oxygen and organic matter. They act as carbon sinks, mitigating climate change, and influence weather via transpiration (releasing water vapor, contributing to rainfall).• Water cycle and quality improvement: Plants regulate water flow, recharge aquifers, filter pollutants, and improve water quality by trapping sediments and toxins.• Biodiversity support and other services: Enhance habitats, support pollinators/wildlife, provide medicinal/economic resources (wood, food, fibers), cool urban areas (shade + evapotranspiration), reduce noise/heat islands, and boost human well-being.• Specific contexts: In agriculture or restoration, cover crops/vegetative buffers reduce erosion, fix nitrogen, suppress weeds, and promote sustainability. Urban spontaneous vegetation or green infrastructure adds low-cost biodiversity and cooling.• Direct production of goods and raw materials: Forests and plantations supply timber, pulp, fuelwood, resins, and non-timber products (medicinal plants, fruits, nuts, and fibers). Agriculture (crops, pastures) forms the foundation of food systems and many export economies. These generate revenue, employment, foreign exchange, and industrial inputs. Many countries have historically used forest capital to finance industrialization and infrastructure.• Support for agriculture and rural livelihoods: Trees and forests provide shade, windbreaks, fodder, and soil enhancement (agroforestry). Vegetation helps maintain microclimates and moisture that benefit crop yields. Rural communities often rely on forest products for food security, energy, medicine, and cash income, especially during shortages—contributions often undercounted in formal GDP.• Tourism, recreation, and amenity values: Forests, parks, and natural vegetation attract visitors, supporting jobs and local economies. Urban vegetation can raise property values, improve liveability, and reduce heat-related productivity losses.• Long-term natural capital and resilience: Diverse plant communities store genetic resources useful for breeding resilient crops, support biodiversity that stabilizes ecosystems, and buffer economies against climate shocks. Natural capital accounting efforts increasingly show forests contributing substantial (though often unrecorded) value beyond timber alone.
4.5.4. Disadvantages of 3 (Vegetation)
• Deforestation and vegetation loss reduce productive capacity: Clearing forests for short-term gains (agriculture, logging, mining) can deplete natural capital. This leads to soil erosion, declining agricultural yields, higher water treatment costs, increased flooding/drought risks, biodiversity loss, and reduced carbon sequestration. These effects raise long-term costs, lower resilience, and can slow or reverse growth—especially in nature-dependent economies. Conventional GDP often overstates income by ignoring depreciation of forest capital.• Opportunity costs and land-use trade-offs: Protecting or restoring vegetation can limit immediate expansion of agriculture, urban development, or mining. In some contexts, converting forest to intensive farming appears more profitable in the short run, creating pressure against conservation even when long-term ecosystem services are more valuable.• Invasive and overabundant plants impose large damages: Weeds and invasive plant species compete with crops and pastures, reduce yields, increase herbicide and management costs, clog waterways, and damage infrastructure.• Other management and conflict costs: overgrown vegetation can increase wildfire risk and suppression expenses, create human–wildlife conflicts, or require ongoing public spending on maintenance (e.g., urban green spaces, roadside clearing).
4.5.5. Advantages of 5 (Man-made)
• Higher productivity and efficiency: Automation, better machinery, software, AI, and data tools allow more output from the same inputs of labour and capital. This raises GDP, lowers production costs, and increases competitiveness. • Creation of new industries, products, and markets: Technology generates entirely new sectors (software, e-commerce, renewable energy, biotech, digital services) and expands existing ones. This creates jobs, investment opportunities, and additional sources of GDP growth. It also enables new business models and services that were previously impossible. • Improved access to information, markets, and services: Digital technologies reduce transaction costs, expand market reach (especially for small firms and developing economies), improve logistics, and deliver education, finance, and healthcare more widely. This supports broader participation in the economy and faster diffusion of knowledge.• Innovation spill-overs and cumulative progress: Knowledge is non-rival—once created, it can be used by many without being depleted. Research and development generate ideas that raise the productivity of future innovators, creating a virtuous cycle of growth. Larger markets and better communication accelerate this process. • Resource efficiency and new solutions: Technology can help overcome resource constraints (e.g., higher-yield crops, energy-efficient processes, renewable power) and address challenges such as climate change or aging populations, supporting more sustainable long-run growth.
4.5.6. Disadvantages of 5 (Man-made)
• Job displacement and labour market disruption: Automation and AI substitute for routine and some cognitive tasks, reducing demand for certain types of labour. This can cause structural unemployment, skill mismatches, and transitional hardship for workers whose jobs disappear faster than new ones appear. The net effect on total employment is often positive over long periods, but the adjustment can be painful and protracted.• Rising inequality: Technological change has frequently been skill-biased or capital-biased. It raises the relative demand (and wages) for high-skilled workers and owners of capital/technology while holding down or reducing returns for lower-skilled workers. This contributes to higher income and wealth inequality within countries and can slow inclusive growth.• Market concentration and barriers to entry: Many modern technologies exhibit strong network effects, high fixed costs, and winner-take-most dynamics (e.g., digital platforms). This can lead to dominant firms, reduced competition, and weaker incentives for broader innovation or fair distribution of gains.• Transition costs and underinvestment risks: Rapid change requires continuous reskilling, infrastructure investment, and regulatory adaptation. Societies that lag in education, digital infrastructure, or institutions may fall further behind. There can also be underinvestment in complementary factors (skills, institutions) needed to fully realize technology’s benefits.
4.6. Significance
Because of population growth, technological progress, and more people living in one area, human actions have drastically changed Earth's land cover, turning large areas of natural vegetation into farmland, cities, infrastructure, and other uses. This process is one of the main causes of climate change, ecosystem degradation, biodiversity loss, and lessening of environmental benefits. Technology has made these changes possible on a scale and with a speed that have never been seen before. It also provides tools for preventing and fixing problems.
4.6.1. Historical and Global Scale of Land Conversion
• About one-third of the world's forests were cut down by humans about 10,000 years ago. Just in the last 100 years, about half of this loss has happened. 57% of land that could be lived on used to be forests. Now, they cover about 4 billion hectares, or 31-22% of the world's land.• New data shows that the pace is still going strong: Between 2020 and 2025, the world lost about 5 million hectares of forests each year, with bigger gross losses.• In 2023, people changed the use of 28.6 million hectares of land directly, with half of that area going to long-lived natural vegetation like forests, shrublands, grasslands, and wetlands.• In 2024, the loss of tropical primary forests hit a record high of 6.7 million hectares. In 2025, the loss dropped 36% to 4.3 million hectares, which was still high. In 2024, 30 million hectares of tree cover were lost all together.
4.6.2. The Key Drivers: Human Occupancy, Technology, and Economic Pressures
1. Population Growth and Human Occupancy: Rising demand for food, housing, and resources directly expands cropland, pasture, and settlements. Urban expansion directly and indirectly (via cropland displacement) drives forest and shrubland loss.2. Agriculture and Commodity Production: Expansion for beef, soy, palm oil, and other crops clears tropical forests in Brazil, Indonesia, and parts of Africa. Shifting agriculture is prominent in Africa. Large-scale land acquisitions often prioritize short-term gains over sustainability.3. Technology's Role in Enabling Conversion:• Heavy machinery, chainsaws, and transport infrastructure allow rapid, large-scale clearing.• Agricultural technologies (e.g., fertilizers, high-yield varieties, irrigation) boost productivity but historically encouraged more land expansion rather than intensification alone.• Mining and energy infrastructure (e.g., roads, pipelines) fragment habitats.
4.6.3. Nuances and Positive Trends
Deforestation rates have slowed in some periods due to policies, protected areas, and yield improvements. Many temperate regions (Europe, parts of Asia) show net forest gains via afforestation.Technology can act as a double-edged sword; while enabling harm, tech also aids conservation:• Satellite monitoring, drones, and AI for real-time deforestation detection and enforcement.• Precision agriculture and improved crop varieties that reduce needed cropland.• Virtual fencing, IoT sensors, blockchain for land rights, and restoration tools (e.g., seed-planting drones).• Data-driven restoration and biodiversity monitoring.And so on to increase the list.
4.6.4. Pathways Forward
Ending deforestation requires balancing human needs with planetary boundaries. Strategies include:• Sustainable intensification to produce more on less land.• Protected areas, indigenous rights enforcement, and supply-chain accountability (e.g., traceability for commodities).• Reforestation, restoration incentives, and nature-based solutions.• Policy enforcement, as seen in Brazil's recent reductions.• Integrating technology with community-led efforts for monitoring and regenerative practices.Technology and more humans have drastically cut down on natural vegetation, which has serious environmental effects. However, policies and new ideas can help stop and even restore some of these losses. Getting this shift going faster before irreversible tipping points are reached is the challenge. Global cooperation, sustainable spending, and fair growth are all very important.In summary, these four entities (1, 2, 3, and 5) exist within the same area, meaning there must be a ratio for control to ensure balance. So, yes, the stake ratio can reveal the level of development and status of progress of a country, and the wrong ratio can also reveal the economic state of a country/planet. Perhaps we have to find a solution because even the country with the best economy needs a guide at some point. Hence, we move on to a test.The entire matter of a good and bad economy is controlled by humans, who implement the rules and regulations. Consequently, humans (2) serve as the deciding/common factor. The cosmos permits humanity to investigate and progress. The absence of 2 renders 5 non-existent. With Biomass and Techno-mass, we are prepared to proceed. Biomass for 2 and 3, Techno-mass for 5. Is it possible to utilize the stake ratio to identify nations that are advancing against those that are regressing? We shall ascertain.The ‘’1:2:3:5 model’’ by Prince Jessii is simply the original/default model of the Earth based on the four groups of matter utilizing the Stake Ratio (1:2:3:5) of the Universe with its policies to reveal balance and to tackle the issue of decline in the economy of a planet, country, or region on a grand scale.
4.7. Test
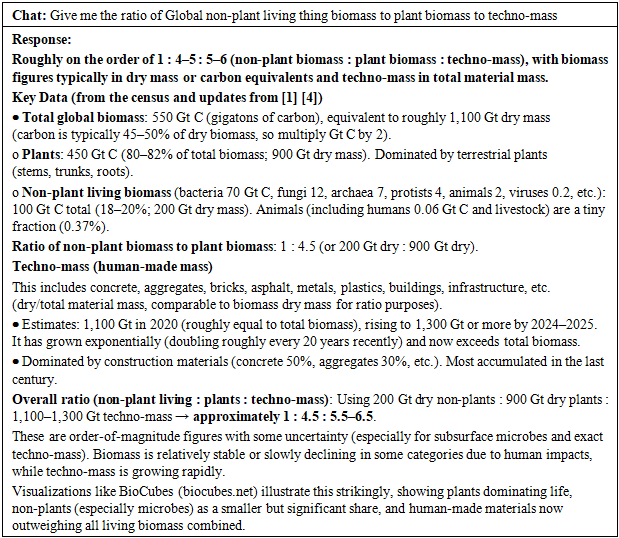
I detected that we neglect to emphasize biomass and techno-mass for nations, which suggests an inadequacy of data for testing purposes. Therefore, the only option left is the employment of Artificial Intelligence (AI) with the few existing data to generate results. I am applying Grok AI for this division. I will obtain data from Grok AI, which I will share with the reader, and I will generate results that require evaluation thereafter.Table 6
 |
| |
|
4.7.1. Set-up
 Mathematically, 1 as itself is insignificant as a number, this makes 2 the dividing/common factor as I revealed earlier.
 Hence, we expect to get this Stake ratio difference
  in any calculation done.From the Grok chat response (Table 6), the ratio for Global non-plant living thing biomass to plant biomass to techno-mass is;
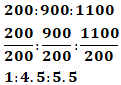 Is this ratio bad compared to the Universe stake ratio? Considering the range between the plant biomass and techno-mass, this is not bad because it is in order with the first rule, which says, "Maintain the increasing order." However, it only means that there’s room for more, the Earth could still accommodate more humans/creatures, more man-made, more vegetations if balanced properly, and there won’t be problems. Remember, the values are estimates, not exact. The fact that humans/creatures, vegetation, and man-made can increase and decrease, justifies the room for adjustments mathematically.For example, if the values are exact, we can aim to increase the value for non-plant biomass (creatures) to 600; this means that if the current number of creatures on Earth should increase by x3 of its current population with more technological and infrastructural development i.e., we increase the man-made (techno-mass) value a little high up to 1500 and leave the vegetation the same, the Stake ratio difference for Earth will be;
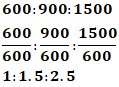 Thus, we get the approved ratio (Stake ratio) of the Universe. There are many ways an adjustment can be done, depending on which component is lacking at the time.The fundamental purpose of this presentation is to highlight the capacity for change and development, although its impact on the entire Earth is not sufficiently meaningful. The capacity for the three entities to rise and fall is beneficial, thereby making elements (1) insignificant. Thus, we can consistently raise or lower the population, amplify or curtail manmade developments, and expand or diminish plant life. Should we detect a severe risk from a negative ratio, we merely choose the most favourable alternative (Best Option).
4.7.2. Best Option
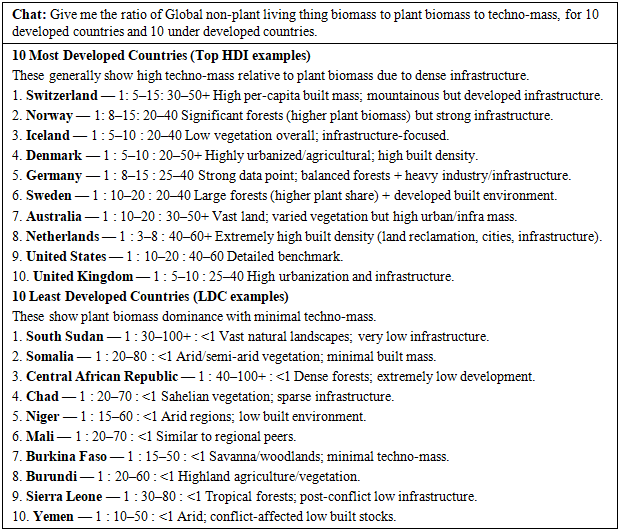
Deliberately reducing the population of creatures would be somewhat immoral or evil, unless it occurs naturally due to a pandemic or conflicts, which is not a viable option. If the population value (non-plant biomass) surpasses that of vegetation (plant biomass) and man-made structures (techno-mass), the latter should be augmented to achieve equilibrium rather than reducing the population. Provided that the techno-mass and vegetation biomass levels are elevated while the population remains minimal, there is no issue, as long as neither declines to the threshold detrimental to living creatures. In the most unfavourable situation, reduce techno-mass; it is also unwise to intentionally diminish vegetation when the population of living creatures is elevated. These entities can also be diminished organically through natural disasters and similar events.In all, we won’t find any significant result in the ratio Globally because one country’s flaw can cover up for some others. The real problem is revealed by digging deep into each of these countries, and even digging deep right to the states in each of these countries. During the process of analysis with these countries, we can introduce a range instead of depending on the exact stake ratio. Let’s return back to Grok for some more answers.Table 7
 |
| |
|
Although, there are not enough data, Table 7 presents estimates and we can see that the least developed countries are in the red zone by violating the first rule which says ‘’Maintain the increasing order’’. The Most Developed countries maintained the increasing order but have some flaw, as their techno-mass value is quite further away from the plant biomass representing vegetation. Expect elevated values when dealing with countries or states, the stake ratio is for an entire planet. However, the elevated values must maintain the rules.
4.7.3. Range
If creatures are the divisor, then the range is between the vegetations and man-made. There must be a balance between these two as we have discussed. For those who didn’t quickly grab what has been discussed, the reason is the fact that the spaces/area the man-made creations (buildings, cars, roads, etc.) will occupy are the same spaces/area that was previously occupied by vegetations in which they grow and multiply, it’s as simple as that. The stake ratio reveals that man-made must be higher than vegetation, but if you obey this without a range, there will be consequences, you’ll end up using all the land for infrastructure without considering vegetations. Hence, we fall back to the Stake ratio.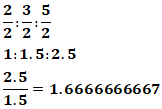 This computation indicates that if the resultant value for vegetation (plant biomass) is 4, the corresponding value for man-made (Techno-mass) should be;
 This is exact. Obviously, we can’t go for the exact; we must establish a range. If man-made cannot be less than vegetation, this means that the lower limit for man-made is the value for vegetation, which is 1.5 in this case; since 1.666666667 can be approximated to 2, let’s take 2 as the upper limit. I say 2 because from the analysis of the results from Tables 6 and 7, the average value for techno-mass of the developed countries is
  of the vegetations. Hence, we can use 2 as key to upper limit.This implies that the resulting techno-mass value after dividing by the biomass value for non-plant living things (creatures) should be;
 This calculation is vice versa, this also means that the plant biomass value after dividing with the biomass value for non-plant living things (creatures) should be;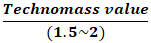
 is the range between plant biomass and techno-mass, this reveals the second rule.Second Rule: Maintain a close range to ratio difference.
4.7.4. Vegetation and Man -made (< 1)
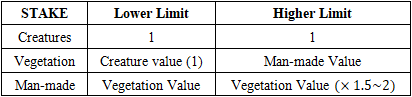
 There is no issue if the results of the plant biomass and techno-mass exceed that of the non-plant biomass (creatures) by a significant margin; they are intrinsically connected. The non-plant biomass (creatures) is the divisor, so there is no issue. This is evident in the results for the countries listed in Table 7, which exhibit ratios of 1:20:40 for developed countries. Additionally, the precise stake ratio would be near the values observed on a global scale. For nations, values will be elevated while adhering to the first and second rule. The only thing we are concerned with is that the resulting values for vegetation and man-made cannot be less than 1 after division, as creatures are the divisor. A value of less than 1 would indicate that creatures are more than both man-made and vegetation, which is a concern, as we have previously discussed. Table 7 illustrates the challenge that underdeveloped nations encounter. Additionally, the plant biomass should increase to within the range as the techno-mass increases. In summary, it is mandatory that neither of them creates an excessive distance between them; the range of 1.5~2 must be maintained. The consequences are more severe as the gap from the range (Limit) increases.
Table 8
 |
| |
|
Table 8 reveals the Limits to each component at stake, this is used as a standard to evaluate the ratio after division.
4.8. Stake Policies
There are so many policies that can directly or indirectly affect a country's economy, but among those policies are the Stake policies effective in adjusting a country’s non-plant living things biomass to plant biomass to techno-mass ratio back to the Universe Stake Ratio. These policies in general are the policies to increase/decrease the population of creatures, amount of vegetation, and man-made.
4.8.1. Policies to Increase Population
• Cash Transfers and Tax Incentives: Direct payments per kid, monthly child allowances, tax credits/deductions that increase with family size, and bonuses for third or subsequent children. Hungary has offered large loans which are cancelled after several births; housing assistance and tax exemption for life for moms with four or more children. Russia has utilized maternal capital payments. France has traditionally had quite substantial family allowances and tax advantages for bigger families.• Parental leave and childcare support: Extended paid maternity/paternity/parental leave, subsidized or free childcare, and flexible work arrangements. Nordic countries combine this with high levels of female labour-force involvement, which can promote (rather than strictly maximize) fertility by reducing the opportunity cost of children.• Education and housing subsidies: Improved housing, larger family apartments, or payment for more children.• Immigration: Pro-natalist goals are sometimes combined with selective immigration in an effort to increase the working age population quicker than can be achieved by births alone.• Historical/experimental approaches: Singapore went from anti-natalist policies (dating campaigns, baby bonuses) to pro-natalist policies as fertility plummeted. Similar packages have been tried in some Eastern European and East Asian states, with varied outcomes.• Translocations and augmentation: Moving individuals to supplement current populations, restore extirpated species, or create new populations in areas with acceptable climate. • Increase reproduction and survival: Build artificial nesting places, prevent disease, manage predation on uncommon species, rehabilitate damaged animals, and (in restricted situations) use procedures like egg removal or fostering to boost total output. • Revise harvest and take regulations: Increase or temporarily reduce quotas for species in decline; prohibit activities such as wildlife killing contests. It can also be employed subsequently for sustainable management once populations rebound. Regulated harvest.• Endangered / threatened species laws: Listing activates recovery plans, habitat safeguards, bycatch reduction, and restrictions on harm. The goal of recovery is to re-establish self-sustaining wild populations so that eventually safeguards can be reduced. • Anti-poaching and trade controls: good enforcement, involving communities, decreases unlawful taking. • Human-wildlife conflict mitigation: As populations increase, compensation or insurance plans for livestock losses, obstacles, and conflict-reduction activities assist in sustaining public support. • Economic incentives: Conservation funding (grants and climate finance associated with nature-based solutions), payments for ecosystem services, and requirements for restoration or avoidance of major biodiversity sites in development projects.
4.8.2. Policies to Decrease Population
These focus on reducing births through access, incentives, or coercion:• Family planning/contraception: Universal access to free/low-cost contraception, sex education, and reproductive health care. Many emerging nations expanded these programs in the late 20th century; where female education and urbanization increased, fertility decreased dramatically.• Limits on family size: China’s one-child policy (1979–2015, later relaxed to two and three children) combined quotas, fines, and enforcement that generated a rapid fertility reduction and long-term demographic imbalances (sex ratios, aging). India’s sterilization campaigns at the state level in the 1970s were more coercive and politically costly.• Incentives and disincentives. Preferential access to housing, jobs, or education for smaller families; penalties or decreased rewards for larger ones. In some areas, government benefits or subsidies were formerly contingent upon having fewer children.• Education and economic opportunity for women: Raising the schooling of girls, postponing marriage, and expanding female employment are all sure ways to reduce fertility in the absence of specific demographic targets. • Abortion access: Liberal abortion laws can lower births, although their impact on their own is smaller than contraception and other socioeconomic changes.
4.8.3. Policies to Increase Vegetation
• Reforestation and Afforestation initiatives: Large-scale tree planting, generally with targets and funding, China’s “Great Green Wall” (Three-North Shelterbelt) has planted enormous belts to counteract desertification. India’s Green India Mission and other national afforestation funds assist in planting on damaged lands. Many countries have annual tree-planting efforts associated with public employment or school programs.• Protected areas and logging bans: National parks, nature reserves, and bans or severe quotas on commercial logging in primary forests. Moratoria on new agricultural conversion in high-conservation regions (e.g., portions of the Amazon under particular administrations) decrease clearing.• Payments for ecosystem services and carbon incentives: Direct payments to landowners who preserve or restore vegetation (Costa Rica's long-running program is a famous example), voluntary carbon markets pay for averted deforestation or reforestation. Subsidize or give tax benefits to agroforestry, cover crops, and permanent greenery on farms.• Urban greening: Green space ratio requirements for new developments, street-tree requirements, green roofs/walls, and park expansion. Cities might set canopy cover goals and subsidize planting by the municipality.• Agricultural and land-use reforms: Promotion of agroforestry and minimum tillage methods, which retain more permanent cover. Targeted financial and technical assistance to restore wetlands, mangroves, and grasslands.• Regulatory instruments: Environmental impact assessments (with compensatory planting requirements), reforestation bonds for mining or infrastructure projects, community forestry tenure with incentives for local organizations to preserve forest cover.
4.8.4. Policies That Decrease Vegetation
• Agricultural expansion and commodity subsidies: Subsidies for cattle ranching, soy, palm oil, or other crops that lead to the conversion of forests and savannas. In border regions, the credit, infrastructure, and export incentives tend to drive deforestation unless combined with tight environmental constraints.• Infrastructure and urbanization: Road building, dams, mining concessions, and urban development plans that open up remote areas or include clearing. Either development-first zoning or enforcement of existing forest restrictions leads to the same result.• Timber and resource extraction policies: Long-term logging concessions, low stumpage fees, or inadequate chain of custody restrictions that make commercial harvesting viable even in sensitive locations. Previous policies that have seen forests solely as timber reserves, rather than multi-functional ecosystems.• Settlement and colonization projects: Government-sponsored migration or land grant programs that encourage clearing for farms or ranches (popular in portions of Latin America or Southeast Asia in past decades).• Fire and grazing management in some contexts: Policies that encourage frequent burning to maintain pasture or policies that do not restrict overgrazing can eliminate woody vegetation and lead to ecosystem shifts to grassland or bare soil. There is also deliberate clearance for firebreaks, invasive-species control, or specific military/security uses, albeit on a narrower scale.
4.8.5. Policies to Increase Technology and Man-Made Systems
• R&D funding and industrial policy: Direct governmental investment in research, tax credits for corporate R&D and targeted subsidies for strategic industries (semiconductors, AI, biotech, clean energy, and advanced manufacturing). • Infrastructure and enabling systems: Large-scale investment in electricity grids, broadband/5G/fiber, transportation networks, data centers, and industrial parks. Bring down the cost of capital for factories, labs, and digital infrastructure, and you speed up the build-out of physical and digital man-made capacity.• Education, talent, and immigration: We boost the human capital that generates technology by expanding education, sponsoring university research, and creating channels for talented immigrants (H-1B-style visas and talent visas). Some governments have explicit “tech talent” attraction schemes.• Intellectual property and legal structures that enable innovation: Strong patent systems, rapid regulatory procedures for new items (i.e., speedy medication or device approval), and light-touch norms for emerging tech in early stages Regulatory sandboxes or special economic zones remove barriers to experimentation.• Incentives for adoption: Subsidies, tax advantages, or regulations that accelerate adoption of certain technologies (electric vehicles, solar, industrial automation, and digital government services). Trade agreements and export promotion can open up markets for domestic technology businesses.
4.8.6. Policies to Decrease or Constrain Technology and Man-Made Systems
• Safety, ethical and risk-based regulation: Strict licensing, testing, or restrictions on high-risk tech (certain AI applications, modifying genes, autonomous weapons, cutting-edge surveillance, and nuclear tech). Data-privacy legislation (GDPR-style), norms of algorithmic responsibility, and biosafety regimes can increase costs and impede rollout. Export limits and penalties prevent the proliferation of dual-use technologies.• Environmental and land-use limitations. These include emissions limits, pollution controls, environmental impact assessments, and protected-area rules that complicate or add cost to large-scale industrial or extractive projects. Phase-outs of certain technologies (internal-combustion engines in some jurisdictions, some polymers, high-emission manufacturing) diminish the stock of those man-made systems over time.• Competition, labour and social policies: Antitrust lawsuits against dominant digital platforms, restrictions restricting automation in sensitive areas or strong worker safeguards that increase the relative cost of capital-intensive technology. • Degrowth, sufficiency or anti-industrial orientations: In some political contexts, there are explicit policies that value lower material throughput, constraints on advertising/consumerism, or hostility to massive infrastructure. • Security and geopolitical limitations: Technology denial regimes and entity lists that prohibit or restrict transfer and domestic development of sophisticated capabilities in targeted countries or enterprises.[2], [3] and [5] explains some details on other aspects of economic growth.
4.9. Stake Optimization
This is about getting the full benefit of the Stake Ratio and ensuring it works well and efficiently. The Stake Ratio is best optimized by choosing the highest value choice from each category. There are groups critical to each of those three categories. Some animals are very valuable and some are not. For instance, you may say that men are more necessary than women, or vice versa. Both sexes are important, and neither should be underestimated too much. Some countries are faced with the problem of the male-female ratio imbalance and it is a problem. Techno-mass can have a high value; however, it is not an effective strategy if it consists of mostly structures made exclusively for human occupancy. A better option would be to build facilities like industries, hospitals, factories, and other buildings related to cutting-edge technology; this would optimize the techno-mass value. I can blast the entire nation with weeds, and that would add to the plant biomass value. But is it a good technique? No. One successful technique is to grow vital food crops, medicinal plants, and important trees. This is simply Stake optimization. Biomass to Techno-mass has to be based on extremely significant elements to ensure an optimal Stake Ratio.
5. Case Study
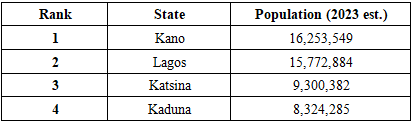
Upon applying the Stake Ratio to a state within a nation, we observe a significant issue in certain states. I will conclude this paper with an illustration of the two most populous states in Nigeria;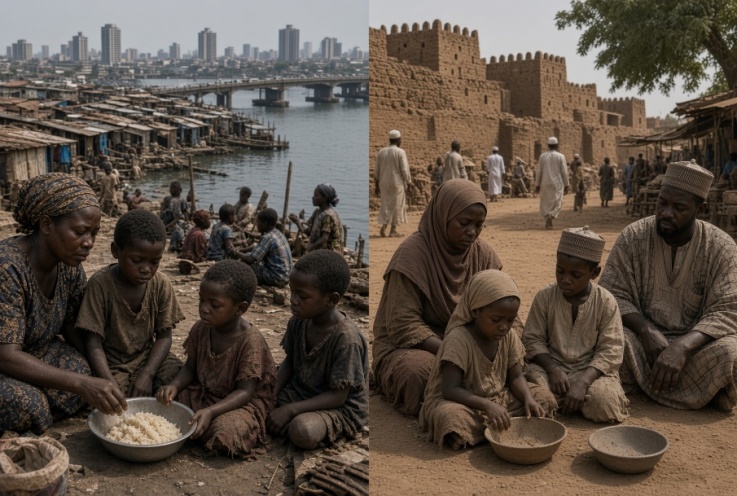 | Figure 10. Lagos/Kano |

Table 9
 |
| |
|
There are clear symptoms of a particular illness, as well as symptoms that may be common to multiple illnesses; for instance, chest pain may arise from a cardiac issue, an ulcer, or muscular problems. Hence, you don’t know the exact cause of the chest pain unless tests are done. If we apply this to this situation, Information regarding biomass in Nigeria is lacking; however, the proof is in our faces. Countries such as the United States have a robust economy, prompting curiosity about the Stake Ratio, which suggests that the biomass to Techno-mass ratio would follow an ascending order and could be similar to the Stake Ratio. Nonetheless, in a nation such as Nigeria, particularly Lagos State, it is evident to all, including the visually impaired, that circumstances are terrible. In the field of Economics, the primary focus is on humans. If a significant portion of the population endures hunger and poverty [3], the nation's economy is poor, unequivocally, irrespective of any financial advancements. This reflects the circumstances of all of Nigeria, especially in its most populous states.Lagos is the most densely populated state in Nigeria, alongside Kano State. It served as the previous capital of the nation. Lagos (southwestern coastal megacity and commercial hub) and Kano (northern commercial/agricultural hub and historic trade city) are examples of Nigeria’s growing urbanization pressures. Both are experiencing rapid population growth that is driving the rise of structures and infrastructure while also destroying vegetation and natural systems. References: - UN World Urbanization Prospects - Estimates and Projections - Macrotrends metro data - Satellite LULC analysis - Government databases - Latest research (2024-2026).
5.1. Population Situation
Lagos: metro/urban agglomeration is estimated at 17.2 million (2025), increasing to 17.8 million (2026) with annual growth of roughly 3.7%. Projections are 20-24 million by the early 2030s. Core areas have high density (typically 6,000–14,000+ people/km²; some LGAs much higher). Lagos State (land area 3,577 km2) concentrates most residents in the metropolitan zone. Growth driven by a strong natural increase and large rural-urban and inter-state migration in search of economic opportunity. Consequences include chronic housing shortfalls (hundreds of thousands of new units needed annually), vast informal settlements/slums, strained services, congestion, etc.Kano: Metro area projections are more moderate (4.5–4.8 million in 2025–2026, increase 3.3–3.6%), but Kano State (20,400 km²) is estimated to be around 15.8–16.3 million. High fertility, natural rise, and in-migration (especially from insecurity in the North-East/North-West) drive growth. Core urban density is high, but overall state density is lower than Lagos. The challenges are similar to Lagos in housing shortages, informal development, and reliance on services, but the far bigger land base gives a greater comfort than Lagos’ restricted coastal environment. Both cities (Lagos and Kano) are examples of Nigeria’s rapid urban transformation (the urban share of the national population has risen substantially). Population pressure is the main driver of the other two conditions.
5.2. Man-Made Situation (Buildings, Technology, Infrastructure)
Lagos: It is very built up and technologically advanced compared to most African cities. There was a huge increase in impervious/built up surfaces. The dominant form is dense low and mid-rise fabric with high-rises and new developments in places like Victoria Island, Lekki, and Eko Atlantic. Informal constructions are very frequent. Traffic and inconsistent power, gaps in water/sewerage, and in trash collection mean the infrastructure is chronically overwhelmed. Technology is a bright spot: “Silicon Lagoon” (Yaba and developing corridors) accommodates fintech unicorns, start-ups, and a booming data center business. Lagos, the tech hub of Nigeria (and West Africa) is powered by several data centers and a concentration of digital economy. Land reclamation and coastal development continue, but poor planning has led to flooding.Kano: Fast urbanization, less vertical intensive. The built-up area has increased significantly (e.g., huge percentage increases over 1984-2023 or 1991-2020 studies; estimates suggest even larger increases by 2050). Traditional compounds, markets, and newer residential/commercial structures dominate with limited high rises. Infrastructure is lagging (roads, drainage, water supply, power, waste management), many places are poorly served. Technology and digital infrastructure are far less established than in Lagos; there are fewer data centers and a weaker formal tech environment, but commercial activity, markets, and some industrial clusters are, nevertheless, significant. Urban sprawl consumes agricultural and open land, sometimes without sufficient planning or infrastructure.Both cities (Lagos and Kano) have a mostly horizontal, reactive (not planned), dense, and efficient, man-made expansion that increases demands on the environment and services.
5.3. Vegetation Situation
Lagos: Massive and continuous destruction of vegetation. Forests, wetlands, mangroves, and other natural cover have dropped significantly as built-up and bare surfaces grow (e.g., forest losses of tens of percent over multi-decade periods; wetlands and canopy heavily reduced). Urban green space is critically inadequate (estimates of total green cover frequently <3–14% depending on definition and research area; tree cover is very low in core zones). There are parks and gardens (hundreds around the state, plus conservation sites like the Lekki Conservation Centre) and government tree planting schemes that have put millions of trees in the ground, but these neither compensate for losses nor satisfy the requirements of liveability. Results include exacerbated urban heat islands, less stormwater absorption (worsening floods), biodiversity degradation, and lower quality air.Kano: Mixed but under pressure. Built-up growth has transformed barren land and some vegetation, while certain periods indicate moderate vegetation gains associated with urban/peri-urban agriculture and planting. Overall urban green/open space is still minimal (approximately 1–5% in metropolis studies; expected additional relative drop with sprawl). The surrounding area is Sudan/Sahel savanna with significant agricultural vegetation (crops such as millet, sorghum, groundnuts). Large-scale tree nurseries and roadside greening are recent state projects. Although urban heat islands and decreasing ecosystem services are an issue, the bigger state land base and agricultural basis provide a larger residual vegetation than Lagos.Vegetation provides a vital buffer (cooling, flood control, air quality, food production, and recreation) that is being sacrificed to meet population-driven building. The growth of a population creates a demand for homes, jobs, and services. Fast and often uncontrolled growth of structures and hard infrastructure. Conversion of vegetated and open land. Diminished ecosystem services that further deteriorate liveability (flooding, heat, and health effects for the rising population). Lagos is more evolved with technology and man-made but has a tremendous loss of vegetation and excess of infrastructure on limited land. But relative to its growth, Kano exhibits lower absolute density and residual agricultural vegetation but faster sprawl and less robust digital/physical infrastructure.
5.4. Solutions
Sustainable accommodation necessitates the administration of the three components as an integrated system instead of prioritizing one to the detriment of the others, as previously explained. These locations are, however, areas that the government neglects about these issues. Evidently, prior to this publication, the concept of stake ratio was unfamiliar to all, with attention solely directed toward the financial dimension of Economic Growth. It is preferable to refrain from escalating the ratio to an irreversible state rather than attaining that state and struggling to revert it. The government's oversight has permitted Lagos to become the focal point, neglecting the development, infrastructural, banking, and security needs of other states. Indeed, in Nigeria, all essentials are located in Lagos. After several years, its negative aspects have started to manifest; one cannot walk the streets without encountering individuals demanding funds for sustenance or other necessities, the air quality is compromised, a significant population is without shelter, and the majority of infrastructure is inadequately maintained, among other issues. To achieve a solution, one cannot commence demolishing homes, expelling residents from the state, or excessively increasing vegetation alone to hastily revert to the standard (Stake Ratio); this process must be slow and may require years. Hence, just prevent it initially.• Population pressure should be moderated (reduce the rate of increase where feasible). High growth rates cannot be indefinitely absorbed without collapse of services and environment. Prioritize family planning, girls’ education, economic opportunities outside the two metros, and managed migration. This eases demand on both buildings/infrastructure and vegetation. Absolute numbers will still rise for decades; the goal is slower, more manageable growth.• Vegetation and green infrastructure must be substantially increased (especially in Lagos; protected and expanded in Kano). Protect remaining wetlands, forests, and open spaces; enforce setbacks and green-space ratios in new developments; expand parks, street trees, green corridors, urban agriculture, green roofs/walls, and permeable surfaces. Nature-based solutions (restored mangroves/wetlands in Lagos; agroforestry and urban farming in Kano) improve flood resilience, cooling, air quality, and food security while making denser living more tolerable. Target measurable increases in green cover per capita and canopy.• Man-made development should shift from uncontrolled horizontal sprawl toward more efficient, vertical, and green forms (increase quality and sustainability of buildings/tech; reduce low-density, poorly serviced expansion). Promote higher-density, mixed-use, well-serviced development with mandatory landscaping and green building standards. In Lagos, leverage existing tech strength (data centers, digital tools, and smart-city systems) for efficient resource management, traffic, waste, and energy while avoiding further wholesale conversion of remaining green/wetland areas. In Kano, accelerate basic infrastructure (water, drainage, power, and roads) and planned industrial/residential layouts that integrate green corridors and protect agricultural land. Technology should be increased as an enabler (monitoring land-use change, optimizing services, and supporting remote work/agriculture tech) rather than as pure concrete expansion.Integrated approach: Without slowing population pressure and deliberately increasing vegetation while making man-made growth more efficient and greener, both cities risk worsening liveability, higher climate vulnerability (floods, heat), and declining productivity—the opposite of sustainable accommodation. Lagos needs the most urgent vegetation restoration and densification discipline because of its extreme density and land constraints. Kano has more spatial room but must avoid repeating Lagos-style unchecked conversion while building infrastructure and human capital to productively absorb its population. In both cases, treating population, buildings/technology, and vegetation as a balanced system rather than letting population drive endless concrete expansion, is essential for long-term viability.
5.5. Conclusions
For an assessment, a quick journey to Lagos will confirm these findings and even reveal that the waters are being sand-filled to mitigate the housing strain from its residents; Lagos largely relies on imports and surrounding states for supply of natural food items, as a significant portion of land has been utilized for infrastructure/housing. This instance in Lagos substantiates the importance of Stake Theory. The situation is such that no policy can improve conditions other than the Stake policies that swiftly endeavour to revert back to the Stake Ratio. This is the justification for my statement: address the Stake Ratio first, because if it remains uncorrected, your established regulations and procedures will be in vain, causing conditions to worsen over the years instead of improving. The existence of billions of planets justifies the existence of the Stake Ratio from the fact that 2, 3, and 5 are capable of multiplying beyond what a planet can contain, neglecting the stake ratio to the point that another planet will be required for continuation. At the start of Universe, everything was in increasing order 1:2:3. Now, with man-made (5), we can’t do otherwise and expect things to be fine. The Lagos and Kano case study is for the underdeveloped countries to see that technology (man-made) helps to create balance to aid Economic growth. For both under developed and developed countries, too much of the man-made exceeding the range is also a problem, as well as over-population. In all, utilize the stake ratio for a state (region) in a country; if all states are intact, then the country is intact. If the stake ratio for all countries is intact, then the Stake ratio for Earth is intact as well. Use the Stake Ratio to ensure that your country or state is in accordance and within range; this is the balance of life in this Universe.
5.6. Clarification on Concept of Stake Theory
This section is intended to prevent you from quoting me incorrectly. Stake theory is not explicitly related to the financial aspect of Economics; rather, it is a pure form of economics. It could be directly related to sustainability and ecology; however, this is not the primary concern. In the era of the first men, money was not required for the following: giving birth (i.e., population growth), planting seeds (vegetation growth), or constructing shelters (man-made) using clay or timber. What was the genesis of economics? If you have the ability to travel back in time and inquire with the first humans, or if you can play out the scenario in mind. Their definition of economics is based on the default (Stake Theory). Despite the fact that their population was extremely small at the time, they did not require a comprehension of how to maintain balance and control it, as everything was in order by default (1:2:3). The mistakes of the past are passed down to the subsequent generations, resulting in a deterioration of the situation in the future due to the absence of revelation and comprehension of the law (stake theory). The primary objective of the Lagos-Kano case study is to demonstrate that we don’t need to calculate the stake ratio before realizing that something is wrong. The people will perceive and suffer if the stake rules is not upheld. Lagos and Kano state aren’t the top seven states in Nigeria by land area but possess a population of up to 15 to 16million people, this kind of situation is not acceptable.Economics is the discipline that investigates the manner in which individuals (including businesses and governments) determine how to allocate scarce resources to fulfil their unbounded desires and requirements. This is the rationale behind the mathematical division of 2 (people, creatures) to determine the Stake Ratio. Consequently, an alternative approach is to conduct a comprehensive evaluation of the constituents (humans, animals) of that specific nation with huge population. Are they experiencing hunger? Are they provided with shelter? Good healthcare? The stake ratio is not intact if a significant number of these individuals are experiencing suffering. This is not directly related to finance or any other subject. In essence, these items (1, 3 and 5) are essential for the survival of humans. It is a matter of common sense; For example, if I earn $10,000 per month and have only one child, I will either purchase or allocate funds to purchase food items for the household in order to ensure that my wife and child have something to eat on a daily basis. Even if I am a stingy or wicked father who does not purchase toys for my child or a car for my wife, they at least have access to food on a daily basis. Now, consider the scenario in which I have six children. Imagine that the food stuffs bought will be shared among eight individuals daily. Each child would not be able to feed properly unlike being the only child. There is also a situation in which I prioritize the purchase of vehicles and jewellery for my wife and myself, while my children are unable to get at least two meals per day. This implies that I must devise a method to balance the spending so it doesn’t affect one party. This example provides a variety of scenarios that can be implemented. Now, employ the Stake Ratio to apply this explanation to the economics of a country. The essentials and wants (food, jewellery, cars, etc.) are classified under 3 and 5 in the stake ratio. In this case, I am comparable to the government in terms of my decision-making. I, my wife, and my children are all impacted by the decisions. We belong in the category of 2 (creatures).Naturally, the ratios dictate that 1 cannot be divided to produce a different result, resulting in 2 being the divisor. This occurred naturally; however, it is important to interpret this as indicating that the people (group: creatures) are the focal point. It is all about the people. Nigeria is ranked approximately 110th out of 127 countries, with a 2024 Global Hunger Index score of 28.8 (category "serious"). There are several countries where citizens are grappling with the challenges of survival. The situation in these countries is critical and this is the reason I refuse to discuss this aspect of Economics with any other aspect (financial economics, ecology, sustainability); you may relate it to any subject you desire; Ultimate Relativity (stake theory) is a unified framework.
5.6.1. Biomass/Techno-mass Measurement
The most effective way to measure biomass and techno-mass would be with remote sensing; Remote sensing is the science and technology of acquiring information about an object, area, or phenomenon without making physical contact with it. Sensors detect and measure energy (usually electromagnetic radiation) that is reflected, emitted, or scattered from the target, then convert those signals into data or images that can be analysed.Key Advantages• Covers large or inaccessible areas quickly.• Provides consistent, repeatable measurements over time (change detection).• Works in many conditions (radar can see through clouds and at night).Key Limitations• Optical sensors are blocked by clouds and darkness.• Signals can “saturate” (stop increasing) in very dense forests or complex urban areas.• Requires calibration and validation with ground data.• Interpretation needs expertise; raw data must be processed to correct for atmosphere, geometry, etc.• Spatial resolution varies.
5.7. Key Source Links
Technomass• PubMed: https://pubmed.ncbi.nlm.nih.gov/33299177/Biomass• PubMed: https://pubmed.ncbi.nlm.nih.gov/29784790/Population• Main portal: https://population.un.org/wpp/• Lagos: http://www.worldpopulationreview.com/cities/nigeria/lagos | https://www.macrotrends.net/global-metrics/cities/22007/lagos/population• Kano metro: https://www.macrotrends.net/global-metrics/cities/22005/kano/population• Kano State: https://naijadetails.com/kano-state-population/ | https://www.city-facts.com/kano/populationLand use / vegetation / built-up change• Lagos LULC & impervious expansion: ResearchGate spatiotemporal analysis (1985–2022 period referenced in results)• Kano LULC: https://jjees.hu.edu.jo/files/Vol16/No3/JJEES_Vol_16_No_3_P6.pdf | https://www.mdpi.com/2073-445x/10/11/1106• Lagos green space: https://hugsi.green/cities/LagosTechnology / data centres (Lagos)• https://techeconomy.ng/lagos-data-centre-capacity-218mw-2030• https://nairametrics.com/2025/12/16/data-centres-emerge-fastest-growing-real-estate-asset-in-lagos-report/
6. Summary - The Blueprint of the Universe
 | Figure 11. Blueprint |
With an upgraded technology, we could get precise results for biomass and techno-mass in future using remote sensing. However, it doesn’t stop us from using the stake ratio for control and balance. Give attention to population control, agriculture/reforestation, and technological development. In simple terms, you can’t have as much people (creatures) in an area with less vegetation and less man-made, this will affect the people (creatures). You can’t use most of the land area for man-made with less on vegetation, this will affect the people (creatures). You can’t use most of the land for vegetation with less on man-made, this will affect the people. Hence, a balance is needed. Stake Theory is the first thing to be taught as the foundation of Economics before diving deep into other aspects. Without the four components, there’s no Economics. One thing we’ve learned from this paper is the fact that everything in existence in this universe was all planned. Hence, it justifies the existence of the blueprint. Also, we noticed that 1 wasn’t as involved as the others. If a country is rich in a certain mineral (Elements), does it count as an advantage over other countries? The answer is no. The reason is due to the fact that the basic elements exist in all parts of Earth. Some will say it’s an advantage because if a country has crude oil, for example, then it doesn’t need to depend on other countries for supply. However, the paper Red Atom-3HEX: UR  III is the next paper in the series, and it reveals otherwise; it reveals more about the identity of 1 with new discoveries, as well as resolving the question surrounding the advantage issue.All theories and new equations in this paper are novel, all proposed by Prince Chimobi Igboejesi.
References
| [1] | Bar-On, Y. M., Phillips, R., & Milo, R. (2018). “The biomass distribution on Earth.” Proceedings of the National Academy of Sciences, 115(25), 6506–6511. DOI: 10.1073/pnas. |
| [2] | Barro, R. J. (1996). Determinants of economic growth: A cross-country empirical study (NBER Working Paper No. 5698). National Bureau of Economic Research. https://doi.org/10.3386/w5698. |
| [3] | Cerra, V., et al. (or related inequality-growth surveys). (2021). Links between growth, inequality, and poverty: A survey (IMF Working Paper No. 21/068). International Monetary Fund. https://www.elibrary.imf.org/view/journals/001/2021/068/article- A001-en.xml. |
| [4] | Elhacham, E., Ben-Uri, L., Grozovski, J., Bar-On, Y. M., & Milo, R. (2020). “Global human- made mass exceeds all living biomass.” Nature, 588, 442–444. DOI: 10.1038/s41586020-3010-5. |
| [5] | Jones, C. I. (2005). Growth and ideas. In P. Aghion & S. Durlauf (Eds.), Handbook of Economic Growth (Vol. 1, pp. 1063–1111). Elsevier. (Also available as NBER Working Paper 10767). |
| [6] | Prince Jessii, The 16th Greek Letter, International Journal of Theoretical and Mathematical Physics, Vol.14 No. 1, 2024, pp. 11-15. Doi 10.5923/j.ijtmp.20241401.03. |
| [7] | Prince Jessii, God’s Eye: Physics of the Universe (2), International Journal of Theoretical and Mathematical Physics, Vol.14 No. 4, 2024, pp. 121-151. Doi 10.5923/j.ijtmp.20241404.02. |
| [8] | Prince Jessii, Seven Math Scrolls of the Universe: UR  I. I. |
| [9] | Prince Jessii, Ultimate Relativity: Theory, International Journal of Theoretical and Mathematical Physics, Vol.12 No. 2, 2022, pp. 32-62. Doi 10.5923/j.ijtmp.20221202.02. |
| [10] | Prince Jessii, (Ultimate Relativity) vs (General Relativity), International Journal of Theoretical and Mathematical Physics, Vol.12 No. 2, 2022, pp. 32-62. Doi 10.5923/j.ijtmp.20221202.02. |
| [11] | Prince Jessii, Ultimate Physics Equation: The Last Revolution in Physics (Deluxe), International Journal of Theoretical and Mathematical Physics, Vol. 11 No. 3, 2021, pp. 106-133. Doi: 10.5923/j.ijtmp.20211103.03. |


 Abstract
 Reference
 Full-Text PDF
 Full-text HTML