-
Paper Information
- Paper Submission
-
Journal Information
- About This Journal
- Editorial Board
- Current Issue
- Archive
- Author Guidelines
- Contact Us
American Journal of Economics
p-ISSN: 2166-4951 e-ISSN: 2166-496X
2024; 14(2): 55-65
doi:10.5923/j.economics.20241402.02
Received: Jun. 23, 2024; Accepted: Jul. 1, 2024; Published: Jul. 6, 2024

Causality of the Industrial Sector on Carbon Emissions (Co2) and Government Commitment in ASEAN-5
Muh. Iqbal, Herman Cahyo Diartho, Sebastiana Viphindrartin
Faculty of Economics and Business, University of Jember, Jember, Indonesia
Correspondence to: Herman Cahyo Diartho, Faculty of Economics and Business, University of Jember, Jember, Indonesia.
| Email: |  |
Copyright © 2024 The Author(s). Published by Scientific & Academic Publishing.
This work is licensed under the Creative Commons Attribution International License (CC BY).
http://creativecommons.org/licenses/by/4.0/

From the standpoint of the green economy, the aim of this study is to ascertain the causal relationship between GDP, energy consumption, and industry on carbon emissions. The industrialization sector has developed as a result of changes in the economic structure. The economy of the nation is impacted by this shift in two ways: first, through economic growth, and second, by externalities resulting from industrialization. The environmental issues are not yet favourable for this ASEAN-5 emerging nation, which is in a pre-industrialization stage when economic growth is focused on raising income and employment. Stricter rules in the environmental sector are necessary since, as per the EKC hypothesis, a green economy can only be realized when ecological consciousness is reached at a specific income level. Empirically, the VECM approach is applied to yearly secondary data from five ASEAN countries between 2011 and 2020. The study's findings indicate that two variables—the GDP variable and the two-way relationship between CO2 and the test—have a causal relationship based on the Granger causality test results. On the other hand, there is a one-way relationship between the industrial variable and energy usage. According to the findings of the PVECM calculation, all factors—namely, the manufacturing sector, energy use, and economic expansion—decrease carbon emissions. This scenario demonstrates how an environmentally friendly economy, defined by a reduction in carbon emissions, can be accelerated by the employment of technological innovation in the macroeconomic mix to accelerate economic expansion.
Keywords: Carbon Emissions, Energy Consumption, Manufacturing Industry, VECM Panels
Cite this paper: Muh. Iqbal, Herman Cahyo Diartho, Sebastiana Viphindrartin, Causality of the Industrial Sector on Carbon Emissions (Co2) and Government Commitment in ASEAN-5, American Journal of Economics, Vol. 14 No. 2, 2024, pp. 55-65. doi: 10.5923/j.economics.20241402.02.
Article Outline
1. Introduction
- In the globalization, economic expansion is the main key to successful economic development. In particular, intensive use of resources supports the economy, but in the long term, with uncertain climate anomalies and the Resource Curse phenomenon, very prominent changes occur in the economy that are reflected by the difficulty of achieving economic balance. It comes into the increase in production output is proportional to the increase in pollution produced [1]. The increase in production results reflects the rapid activity of the manufacturing industry. The series of industrial improvements is part of the positive impact of Industrial Revolution 4.0. On the other hand, this industrial value chain has a double effect on the economy, in the form of economic expansion and an increase in the impact of externalities resulting from production in the form of pollution [2] The industrial sector is one of the main sources of increasing energy consumption. Indirectly, manufacturing activities depend on energy as the driving force of the economy. Manufacturing industrial production that is not accompanied by technological innovation for renewable energy in the long term has an impact on environmental quality [3]. The manufacturing industry is believed to be an instrument of the national economy and the foundation of a country in driving the economy. Building an independent and complete industrial system will produce great added value. However, as an energy-intensive industry, it is highly dependent on energy consumption, as the scale expands and the need for energy consumption increases rapidly, ultimately the manufacturing industry is the largest contributor to carbon emissions [4].Kuznet, in his theory, explains that environmental degradation occurs due to changes in economic structure. Where the phase of change in economic structure from agriculture to industry has a double impact on the economy. Kuznet hypothesis describes the relationship between economic growth and pollution from carbon emissions in an inverted U shape. Referring to the Kuznet hypothesis, higher income reflects increased economic growth in the long term and can achieve environmental quality characterized by low carbon emissions [1].Empirical evidence supporting the Kuznets Theory states that increasing economic growth contributes to increasing carbon emissions [5], it is in line with the research by [6] that stated the main factor increasing global warming is increasing carbon emissions. Different from research [7] based on the results of the Granger causality test for the short and long term, asymmetric industrialization reduces carbon emissions. Several studies have proven that the main contributor to carbon emissions is not only economic growth from the added value of industrialization but also other factors from the countries affected by the Industrial Revolution 4.0, namely ASEAN-5 countries including Indonesia, Malaysia, Thailand, the Philippines and Vietnam. Industrialization has historically been associated with creating wealth and improving living standards, on the other hand, it has harmed the economy. This contributes to environmental pollution, reflected in increasing energy consumption which results in a massive increase in carbon emissions [8]. From the description above, the objective of this research is explicitly to determine the causal relationship between the industrial sector which is proxied by the variable energy consumption, manufacturing industry and environmental carbon emissions in ASEAN-5 countries, both short and long term.
2. Literature Review
2.1. Environment Kuznet Kurve (EKC)
- Simon Kuznet pioneered the Environmental Kuznet Curve (EKC) hypothesis, an inverted U theory that explains the long-term relationship between economic growth and environmental quality, where development or economic growth itself causes environmental damage in future generations. Successful economic development is synonymous with increased economic growth. This increase in economic growth will also cause increased environmental degradation, up to a certain critical point.The Environmental Kuznets Curve (EKC) diagram has previously categorized the relationship between changes in economic structure and economic growth of a country into three stages; First, environmental damage. With the development of industrial processes from small-scale industry to large-scale industry, natural resources can be utilized better. Second, in the industrial-level economy, there is a shift in the economic structure from the agricultural sector to the industrial sector due to the increase in domestic industry. Third, changes in the economic structure of the post-industrial economy are continuing, with a shift from the industrial sector to the service sector, where information and technology are becoming more efficient and sophisticated. This change in economic structure causes reduced environmental degradation and increased income, which in turn causes an increase in environmental and air pollution due to the need for economic activities to increase production.
2.2. Endogen-Solow Growth Theory
- According to Solow, (Solow Neoclassical growth model) what influences economic growth is the level of capital accumulation, population growth rate, and level of technological development (Sukirno, 2013: 437). The Solow growth model according to Aghion, and Howitt, 2003; Helpman, 2004; Schiliro, 1986 is an exogenous variable consisting of saving levels, population growth and technical progress growth. There are changes in production factors, capital and labour due to changes in population growth and investment, which are assumed to be in a perfectly competitive market.
 | (2.1) |
 | (2.2) |
 | (2.3) |
 | (2.4) |
 | (2.5) |
 | (2.6) |
 | (2.7) |
 | (2.8) |
 | (2.9) |
2.3. Sustainable Development
- Sustainable development which was first introduced by the World Commission on Environment and Development (WCED) stated in Our Common Future or the Brundtland report, is still a matter of debate for environmental experts. This gives rise to various definitions of sustainable development. According to (Emil Salim, 1990), sustainable development aims to improve community welfare to meet human needs. Sustainable development essentially aims to achieve equitable development between current and future generations. According to the Ministry of the Environment, economic-oriented development that takes into account the principles of sustainability must meet three criteria: (1) wasteful use of natural resources, (2) pollution and other environmental factors (3) must increase the availability or fungibility of resources in activities (Jaya, 2004).According to [9] there are three reasons why economic development must be based on the principle of sustainability. Firstly, moral reasons, the current generation enjoys goods and services produced from natural resources and the environment so it is morally necessary to pay attention to the availability of these natural resources for future generations or this moral obligation includes extracting resources. natural resources that can damage the environment, which can eliminate the opportunity for future generations to enjoy the same thing. Second, technological reasons, for example, the high economic value of biodiversity, therefore economic activity should not lead to activities utilizing natural resources and the environment alone ultimately threatens ecological functions. Third, economic reasons, reasons from the economic side are still being debated because it is not yet known whether economic activities so far have or have not even met the sustainability criteria, as we know that the economic dimensions of sustainability are quite diverse, but often the sustainability aspects from the economic side are only limited to measuring intergenerational welfare.
3. Research Methodology
3.1. Design and Data Source
- This research uses panel data which combines time series data with cross section data. Time series data, namely carbon dioxide, GDP, energy consumption, and industrial sector with a period of 2011 to 2020 and source obtained from the World Bank. The cross-section data, namely Indonesia, Malaysia, Thailand, Vietnam and the Philippines, is the research object used, taken from several countries in the Southeast Asia region. In this research, the background for choosing the 2011-2020 period is because it is directly related to economic and methodological issues.
3.2. Research Design Specification
- This research examines GDP, Energy Consumption and Number of Manufacturing Industries on Carbon Emissions in ASEAN-5. This model specification was adopted and derived from research by Jian, J et al, 2019 which proxies carbon emissions from a green economy perspective which is written in equation 3.1
 | (3.1) |
 | (3.2) |
 | (3.3) |
3.3. Research Analysis Methods
- In general, this research uses the VECM method on panel data and uses IRF and VD which implement a likelihood-based framework for co-integration analysis in the VECM year. So, the PVECM equation can be formulated by modifying the equation using panel data as follows:

 is a vector element from endogen variable in every country. i= 1,..., N, meanwhile t=1 ,..., is a period of time. In this research,
  act as a vector of:EK – GDP, KE, IM Model
 describes all deterministic components, namely constants, and dummy. Xit-k is the lag value of the endogenous variable and εit is K x 1 for uncorrelated disturbances, and
  and
and  as a dependent cross-section. The influence between variables can be observed from the PVECM analysis which is reduced to the following equation:
4. Discussion
4.1. Development of Carbon Emissions in ASEAN-5
- One of the most dangerous compounds contributing to the environment is carbon dioxide, where this compound can harm nature and human health. The company's activities continue to be carried out to meet increasing human needs, resulting in air pollution which will pollute the environment and cause global warming and uncertain climate anomalies. The data used is carbon dioxide data from 2011 to 2020 as follows.
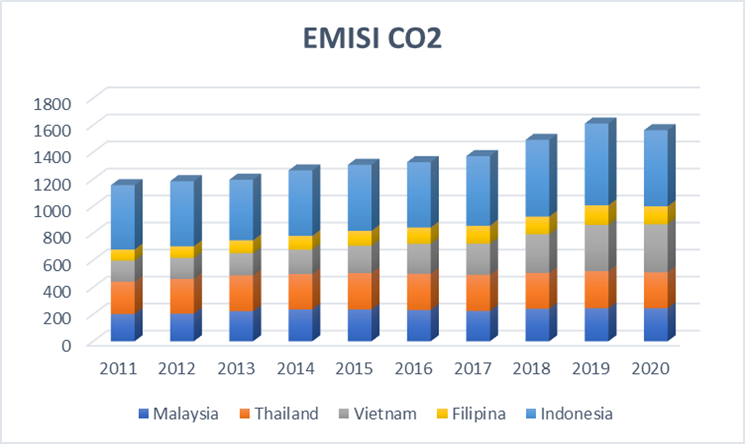 | Figure 4.1. Development of Carbon Emissions in ASEAN-5 Source: Word Bank, 2020 |
4.2. Research Results with PVECM
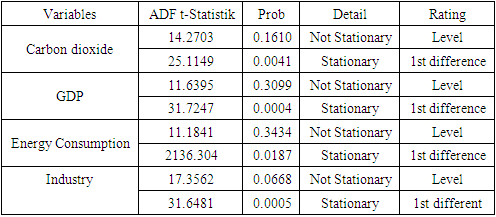
4.2.1. Stationarity Test
|
4.2.2. Optimum Lag Test
- The optimal lag test shows the estimation results to determine the period indicating the presence of variables that have an influence on other variables, which reflects optimal results.
|
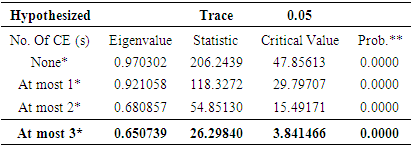
4.2.3. Cointegration Test
- The cointegration test is used to detect whether or not there is a long-term influence on the variables studied. Determining variables in the cointegration model if the trace statistic value is greater than the critical value or the probability value is below 5%.
|
4.2.4. Causality Test
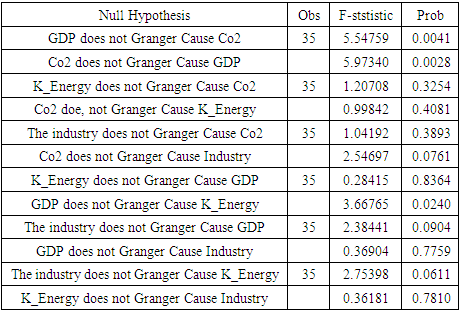
- The causality test is one of the PVECM analyses whose aim is to determine the reciprocal relationship between variables, both one-way and two-way, by looking at probability values. The following are the results of the Granger causality test.
|
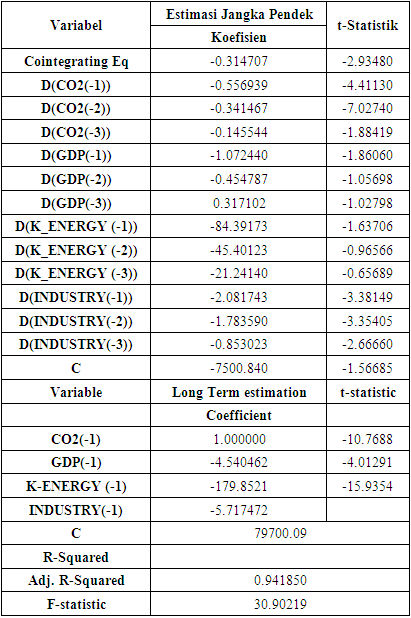
4.2.5. VECM Panel Estimation Results
|
4.2.6. PVECM Model Stability Test
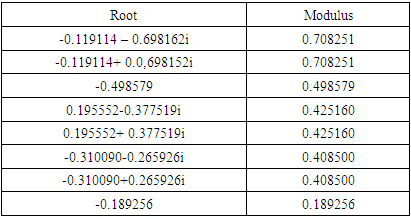
- The stability test in this research model was carried out before estimating the PVECM model. Furthermore, the mode value in the stability test is used to support the results of the Impulse Response Function analysis and variance decomposition. The following are the results of the stability test;
|
4.2.7. IRF Test
- Impulse Response Function (IRF) is used to describe variable behaviour in shock rates. The results of the Impulse Response Function (IRF) can be observed through the following image.
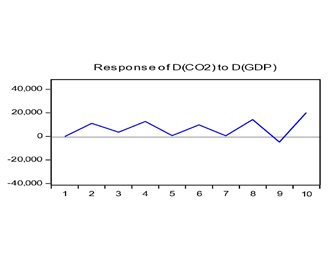 | Figure 4.2. IRF GDP test for carbon emissions |
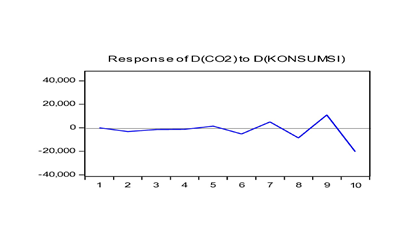 | Figure 4.3. IRF Consumption Test on Carbon Emissions |
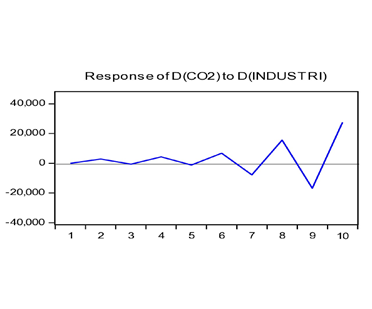 | Figure 4.4. IRF Industry Test for Carbon Emissions |
4.2.8. Variance Decomposition
- The Variance Decomposition (VD) test analysis is focused on looking at the influence of the GDP, Energy consumption and Industry variables on the independent variable, namely CO2 so that the Variance Decomposition analysis is used to explain changes in one variable that are influenced by changes in other variables. Following are the results of the Variance Decomposition test:
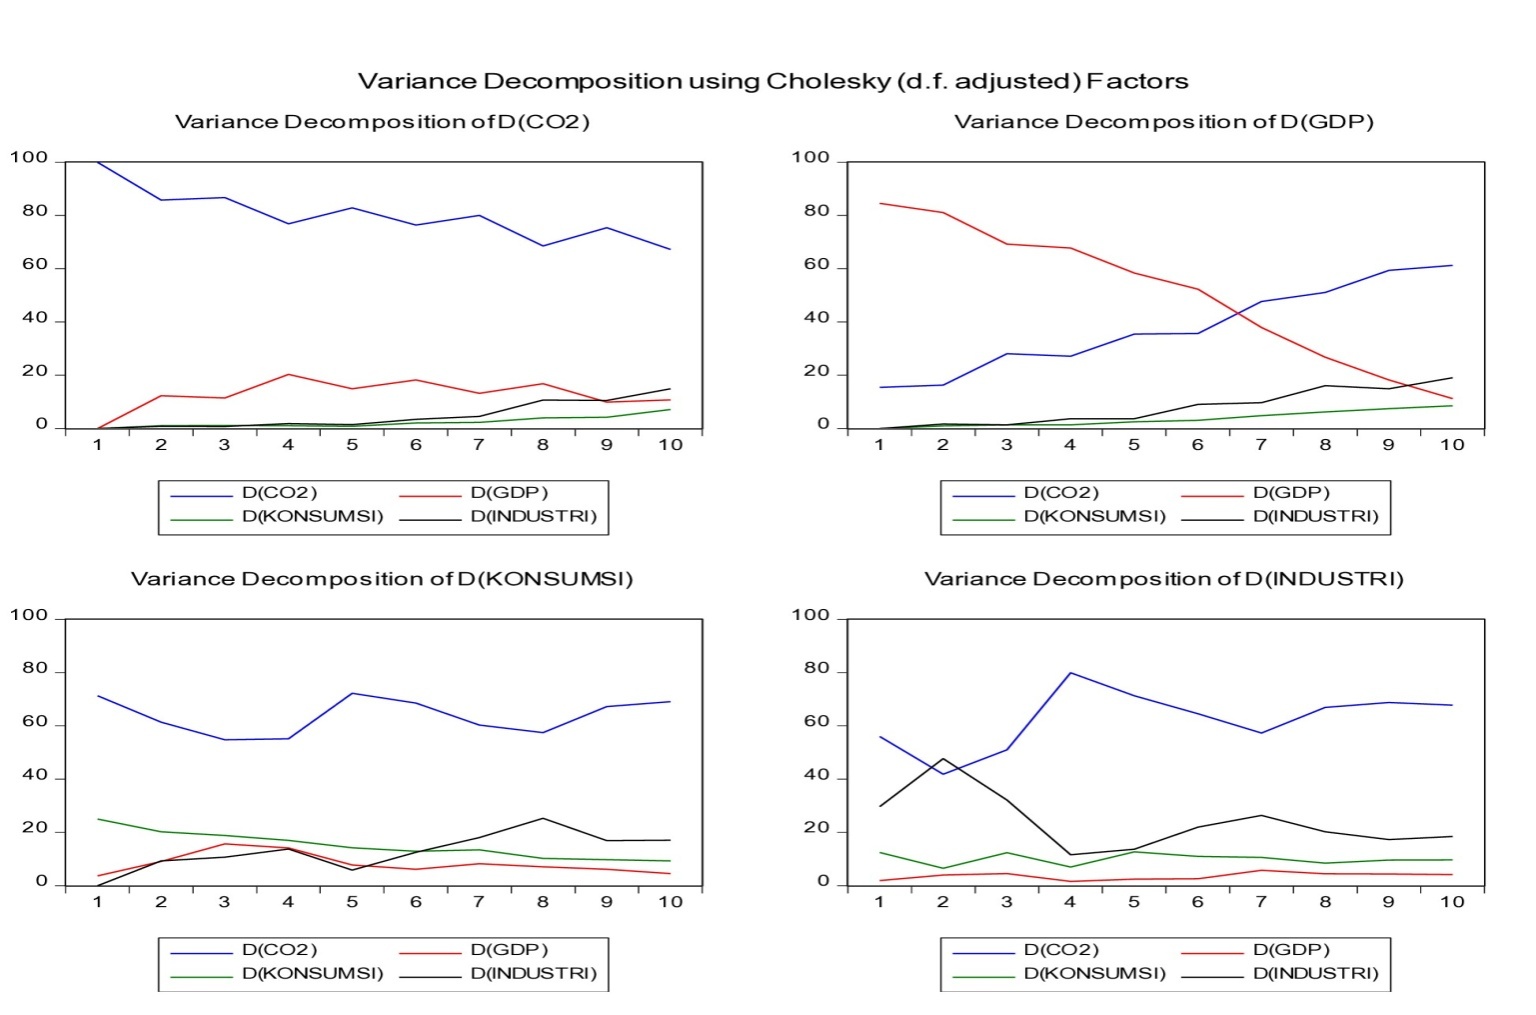 | Figure 4.5. Variance Decomposition |
4.2.9. Classic Assumption Test Results
- Table 7 shows the results of the classic assumptions in this research. The normality test results are shown by a probability value of 0.2139. This reflects normally distributed data because the probability value > alpha value is 5%. Furthermore, the heteroscedasticity test using white heteroscedasticity has a probability value of 0.2320, meaning that heteroscedasticity does not occur. Finally, the autocorrelation test uses the LM test with a probability result of 0.1420 > 5% alpha value, so it can be concluded that there is no autocorrelation.
|
4.3. Result and Discussion
4.3.1. Co2 Causality and Economic Growth
- The Granger causality test shows that the probability value of economic growth can influence carbon-dioxide emissions and carbon dioxide emissions can influence economic growth. Thus, it can be concluded that the two variables have a two-way causal relationship between carbon dioxide and economic growth (Feedback or Bilateral Causality). This two-way relationship between economic growth and carbon dioxide is one of the main reasons ASEAN-5 countries are still classified as developing countries. So the lack of attention from the government and technology that is still relatively less advanced causes carbon emissions to increase. In contrast to developed countries, economic growth is increasing and carbon dioxide emissions can be controlled. So the main scope of dominant developing countries is only pursuing economic growth without thinking about the effects of carbon dioxide emissions and this confirms the existence of the EKC hypothesis. The research results are under theory and the results of previous research including [17] an increase in GDP per capita by 10 percent will result in an increase in CO2 emissions by 1.4 percent. So the role of GDP per capita greatly influences CO2 emissions and if CO2 emissions continue not to be controlled it will be very dangerous for the long-term sustainability of living things.Furthermore, this is confirmed by other research [18] in countries that are less prosperous or can be said to be developing countries that still focus on GDP per capita growth so that there is less pressure on CO2 emissions. This is different from developed countries, economic growth is more closely accompanied by reducing CO2 emissions by using the latest and better technology. In general, countries with economies that are still developing at the ASEAN-5 level still focus on the production sector, so the main task of paying attention to the impact of externalities from economic activities, namely environmental quality, is still neglected. Other research confirms this situation [19] that CO2 per capita in Indonesia increased from 1977-2014, so that the U curve almost resembles an inverted U. This indicates that when GDP per capita increases, CO2 emissions will increase.
4.3.2. Co2 Causality and Energy Consumption
- The Granger causality test shows that the probability value of energy consumption cannot affect carbon dioxide emissions and carbon dioxide emissions cannot affect energy consumption. Thus, it is concluded that there is no two-way or one-way causal relationship between carbon dioxide and energy consumption. In the cases in China, [20] stated that Chinese state policymakers have been careful to implement strict and disciplined pollution regulations. When setting a target for reducing carbon emissions by 20–40% by 2050. This can be seen from the fact that GDP has a long-term relationship with fossil fuel consumption; however, this does not appear to have an impact on CO2 emissions.Non-renewable energy consumption in the five ASEAN-5 countries as developing countries has not caused environmental degradation because government policy in the use of energy consumption is still said to be controllable so that it has no impact on carbon dioxide emissions. This is strengthened by research by [21] that finds out there is no causal relationship between CO2 emissions from energy consumption on economic growth in Malaysia. also in Singapore, it shows that there is no reciprocal relationship between economic growth and energy consumption. This proves that Singapore can maintain economic growth without causing environmental damage. Meanwhile, the environmental Kuznets Curve in Malaysia shows that it has not yet passed the turning point, but Singapore has passed the critical point and is already in a state of environmental improvement while continuing to carry out economic development with the disciplined policies of the government of their respective countries.
4.3.3. Co2 Causality and Manufacture Industry
- The probability value in the Granger causality test shows that the Industry Variable doesn’t affect the CO2 emission and vice versa. It concludes that the two variables do not have both one-way and two-way relationships. However, some provisions must be known regarding the impact of carbon dioxide emissions that must be accepted. When an industry is established, if it exceeds the threshold, it will be very detrimental to living things. An interesting thing was found in research by [22], he stated that Government policies related to the implementation of green industry in encouraging the use of lower carbon technology will result in a negative influence on GDP in the Industrial sector and can reduce CO2 emissions in Indonesia. So industrialization has a significant negative effect on CO2 emissions, making industry an added value for economic growth in ASEAN-5 countries.The impact of government policies related to the green industrial revolution in ASEAN-5 creates jobs, while on the other hand, it also reduces global warming, and climate change and moves the wheels of a country's economy. This is in line with the research by [23], The state has an important role in achieving sustainable development goals, by controlling industrial companies in implementing green industry. Environmentally friendly innovation methods have a very important impact on climate conditions. reducing CO2 emissions and reducing the intensity of CO2 emissions, however, there are large costs that must be borne, for example in procuring environmentally friendly technological innovations within the company. The good thing is that in the long term it is very beneficial for the survival of living things.
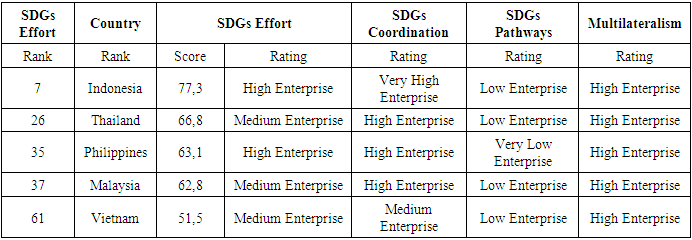
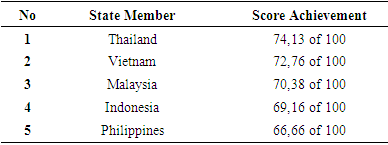
4.3.4. Government Commitment to Achieving SDGs in ASEAN-5
|
|
5. Conclusions
- From the standpoint of the green economy, the purpose of this study is to ascertain the causal relationship between GDP, energy consumption, and industry on carbon emissions. The results of the discussion that have been explained are in the form of test estimates using PVECM regarding the causality relationship between Industry and carbon emissions in ASEAN-5 where Industry is proxied by the variables, Manufacturing Industry, Energy Consumption, and GDP. In this research, there are several conclusions obtained in this research as follows: Based on the results of the Granger causality test, there are 2 variables that have a causal relationship, namely the GDP variable to Co2 which has a two-way relationship, while the Industry variable to Energy Consumption has a one-way relationship. Based on the PVECM estimation results, all variables, namely manufacturing industry, energy consumption and economic growth, have a negative effect on carbon emissions. This condition shows that the macroeconomic mix to accelerate economic expansion in line with the use of technological innovation can accelerate an environmentally friendly economy marked by the reduction of carbon emissions.
6. Policy Recommendations
- Achieving a green economy is marked by decarbonization, saving natural resources and social interaction. To achieve decarbonization there are 6 variations as a substitute source of energy, namely by utilizing geothermal heat, wind, water, seawater waves, solar heat and bioenergy. On the other hand, a policy mix is needed as a green economic instrument, namely stabilizing the macro economy and finances supported by the government. The government's instrument is to support the world carbon transaction system to bridge the entry of green investment. Concretely, every ASEAN-5 country must change their production and consumption systems with a sustainable scheme so that the implementation of green economics is achieved, namely resource efficiency, reduced poverty, and a protected environment.
 Abstract
 Reference
 Full-Text PDF
 Full-text HTML