T. Odongo
Department of Economics, Makerere University Business School, Uganda
Correspondence to: T. Odongo, Department of Economics, Makerere University Business School, Uganda.
| Email: |  |
Copyright © 2024 The Author(s). Published by Scientific & Academic Publishing.
This work is licensed under the Creative Commons Attribution International License (CC BY).
http://creativecommons.org/licenses/by/4.0/

Abstract
This study examined the causal relationship between electricity consumption and Uganda’s Foreign Direct Investment (FDI) inflows in the period between 1987 and 2018. The study uses granger causality test and Vector Error Correction Model (VECM) to determine this relationship in the period under the review. Although the result from granger causality test in this study indicates insignificant relationship between electricity consumption and Uganda’s FDI inflows, VECM estimates however presents significant results. Nevertheless, as the economy moves towards long run period, the significant performance from VECM estimates diminishes and may perhaps in the very long run period becomes statistically insignificant. The study therefore recommends that FDI inflows which is geared towards manufacturing sector should be encouraged in Uganda. Secondly, there is need for fast tracking and consolidation of intervention in the electricity generation to enable long run electricity consumption.
Keywords:
Electricity Consumption and FDI Inflows
Cite this paper: T. Odongo, Electricity Consumption and Uganda’s Foreign Direct Investment Inflows, American Journal of Economics, Vol. 14 No. 1, 2024, pp. 1-15. doi: 10.5923/j.economics.20241401.01.
1. Introduction
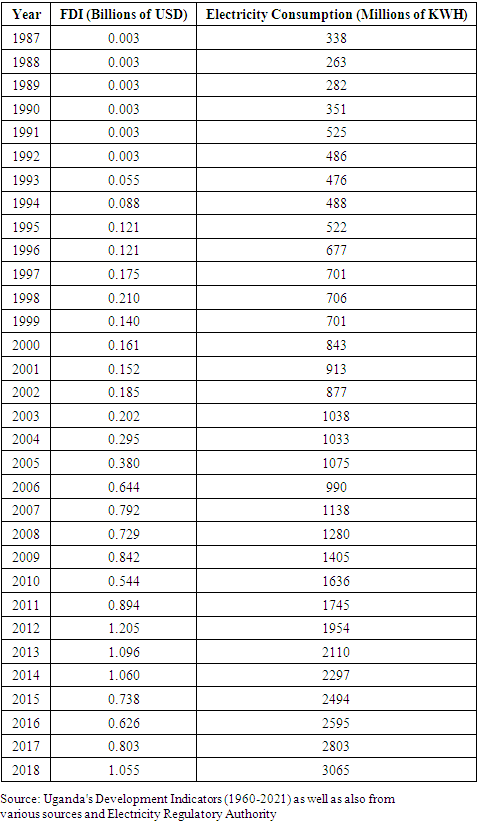
Electricity as a form of energy is considered to be one of the essential driving forces for Foreign Direct Investment (FDI) inflows in to developing countries, which directly or indirectly complements labor and capital as inputs in the production process. It contributes to economic growth through employment generation and leads directly to value addition associated with extraction and transformation of inputs, technology transfers, marketing and distribution of goods and services (Sekantsiand and Motlokoa, 2015). It also reinforces modernization of traditional economic sectors and assists in continuous expansion of secondary and tertiary sectors of the economy, in addition to improving the quality of life of individuals, particularly through heat, light and use of electrical appliances (Sekantsiand and Motlokoa, 2015). In spite of wide spread discussions in economic literature, the direction of causality between electricity consumption and FDI inflows into developing countries still remains ambiguous. This ambiguity is attributed to the use of different data sets, different methods of analyses and different country characteristics (Sekantsiand and Motlokoa, 2015).It is against this background that this study investigates the causal relationship between electricity consumption and Uganda’s FDI inflows, with a view to contributing to the body of knowledge on this topic. In addition, the knowledge about the direction of causality between these two variables is important for the design of effective energy policy in Uganda (Sekantsiand and Motlokoa, 2015). Given this background, the performance of Uganda’s FDI inflows with respect to electricity consumption in the period between 1987 and 2018 is considered important in this study because this is a period when FDI inflows into the country was stable. Nevertheless, the period following 2018 witnessed a significant reduction in the FDI inflows into the country due to the effect of COVID 19 pandemic. The performance of FDI inflows in to Uganda in the period between 1987 and 2018 is indicated in table 1 below.Table 1. Electricity Consumption and Uganda’s FDI Inflows (1987 – 2018)
 |
| |
|
The performance in table 1 indicates that Uganda’s FDI inflows increased significantly from United States Dollar (USD) 0.003 billion in 1987 to USD 1.055 billion in 2018 and electricity consumption in the country during this period increased from 338 Kilo Watt Hours (KWH) in 1987 to 3065 Kilo Watt Hours (KWH) in 2018. The above performance indicates that Uganda’s FDI inflows performed significantly well in line with the increase in electricity consumption in the country in the period between 1987 and 2018. The trend of electricity consumption and that of FDI inflows in the country during this period is indicated in figure 1 and figure 2 respectively.Figure 1 below indicates that the trend of electricity consumption in Uganda increased at a slightly lower rate in the period between 1987 and 2004 and thereafter, there was a sharp decrease in electricity consumption in the period between 2005 and 2006. | Figure 1. Trend of Uganda’s Electricity Consumption (1987-2018) (Source: Author’s analysis based on data from table 1) |
This sharp decrease in electricity consumption in the period between 2005 and 2006 could be attributed to the sharp decline in hydroelectricity power generation in the country during the period. This could perhaps be partly blamed on the prolonged droughts that affected the water level in lake Victoria during this period. Nevertheless, there was a steady increase in electricity consumption in the period between 2007 and 2018. Despite the steady increase in electricity consumption in the period between 2007 and 2018, the trend of FDI inflows in to the country during this period was not stable. It fell sharply in 2010 but increased significantly in the period between 2011 and 2012 and then sharply declined in the period between 2013 to 2016. The performance of FDI inflows in to the country in the period between 1987 and 2018 is indicated in figure 2. | Figure 2. Trend of FDI Inflows in to Uganda’s Economy (1987-2018) (Source: Author’s analysis based on data from table 1) |
In spite of the increase in the trend of FDI inflows in to Uganda in the period between 1987 and 2018, the growth of electricity consumption in the country during this period significantly declined, by 0.004 percent per annum. The growth of electricity consumption in the country in the period under the review is presented below. Thus, the performance in figures 2 and 3 presented above indicate that the growth of electricity consumption in Uganda in the period between 1987 and 2018 is inconsistent with the trend of FDI inflows in to the country. The above performance implies that the availability of electricity as a source of energy for investment in Uganda never attracted the inflows of FDIs into the country. 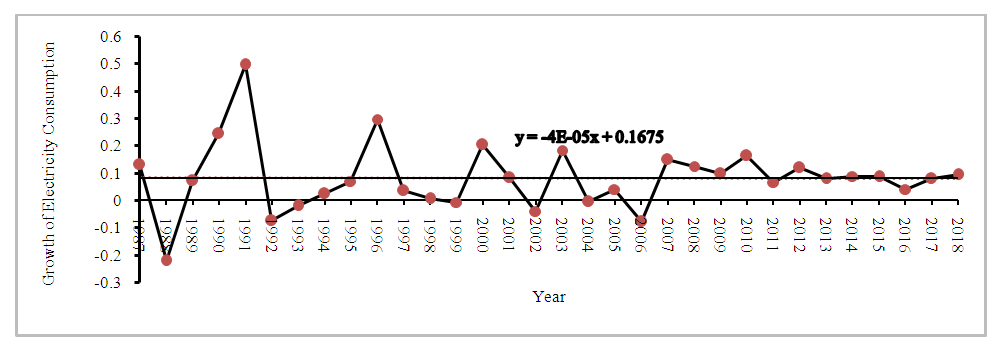 | Figure 3. Growth of Electricity Consumption in Uganda (1987-2018) (Source: Author’s analysis based on data in table 1) |
The case of the decline in the growth of electricity consumption in Uganda following the increase in the trend of FDI inflows is the cause of concern for this study and points to the possible effect of other factors than electricity consumption to be responsible for the increase in the trend of FDI inflows into the country.
2. Empirical Background
Many empirical studies have examined the relationships between FDI inflows and electricity consumption in developing countries in the period between 1970s and 2000. Some of these studies argued that there is a unidirectional relationship between electricity consumption and FDI inflows in to developing countries (Abdouli and Hammami 2017). This study further indicates that electricity consumption increases FDI inflows for individual and collective countries. The study also indicates that increase in the demand for electricity is linked to FDI inflows. The same conclusion was also alluded to by Leitão (2015) when he used GMM to study the relationship between FDI inflows and energy consumption in Portugal. A recent study by Doytch and Narayan (2016) investigated the relationships between sectoral FDI inflows and energy consumption in developing counties in the period between 1985 to 2012. The study classified energy consumption into two types; renewable and non-renewable energy. Renewable energy consumption in this context is indicated to include electricity, wind and solar. In this study electricity consumption has been captured as renewable energy. The study concluded that FDI inflows promote energy savings by increasing renewable energy consumption. This study supports the idea that FDI inflows have a halo effect, suggesting that FDI inflows improve local environmental performance. Gökmenoğlu and Taspinar (2016), investigated the effect of FDI inflows into developing countries while considering variables such as carbon dioxide emissions, renewable energy (electricity inclusive) consumption and economic growth in the period between 1974 to 2010. This study uses Toda– Yamamoto causality test in the analyses and concluded that there is a bi directional relationship between carbon emissions and FDI inflows and also there is a bi-directional relationship between renewable energy consumption and carbon dioxide emission in developing countries. Nevertheless, the above study also indicated that there is a unidirectional causal relationship running from economic growth to renewable energy consumption and also to FDI inflows. The study further indicated that there is a unidirectional relationship between economic growth and renewable energy consumption. Besides, Sapkota and Bastola (2017), carried out a study on the relationship between FDI inflows and renewable energy consumption in Latin America countries in the period between 1980 to 2010, using Panel Ordinary Least Square (POLS) method. The conclusion in this study is that FDI inflows and renewable energy consumption is related to pollution emissions. The study recommended that there is need to attract clean and efficient renewable energy industries through FDI inflows in order to improve environmental quality while also maintaining economic growth. This study confirmed that the halo effect of FDI inflows in lower-middle income countries is less significant than the halo effect of FDI inflows in upper-middle income countries.Alternatively, in the Sub-Saharan African countries, Keho (2016) used panel cointegration technique to investigate the causal relationship between energy consumption and FDI inflows in the period between 1971 to 2010. The study pointed out that in Nigeria and Benin Republic, FDI inflows led to transfer of energy reducing technology while increase in FDI inflows leads to fall in energy intensity in Cote d’Ivoire and Togo. The findings further revealed that in the short-run, FDI inflows granger cause energy intensity in Cote d’Ivoire and Nigeria, while, import activities granger cause energy intensity in Cameron and Nigeria.Contrary to the above observations, Gökmenoğlu and Taspinar (2016), while examining the relationship between electricity consumption and FDI inflows in to Turkey in the period between 1974 to 2010, concluded that there is a long-run equilibrium relationship between electricity consumption and FDI inflows in this country. The study further indicated that electricity consumption leds to economic growth, while economic growth attracted more FDI inflows in to the country. In the same country Sirin (2017), while investigating the causal relationship between FDI inflows and investment in Turkish power sector in the period between 2002 to 2012, found out that the Turkish power sector attracted more FDI inflows through privatization and lower real effective exchange rate. A key note from this study is that the Turkish economy remained a landing country for renewable energy technology investment opportunities.In Egypt however, Ibrahim (2015) validated cointegrating relationship between economic growth, electricity consumption, and FDI inflows in the period between 1980 and 2012. The study further noted that there is a direct link between FDI inflows and economic growth in the country. Lee and Jung (2018) examined the causal relationship between energy consumption, FDI inflows and economic growth in South Korea using a framework of conventional neo-classical production function of capital, labor and renewable energy (electricity) in the period between 1990 and 2012. The study used cointegration technique of autoregressive distributed lag test and vector error correction mechanism. The results in this study showed that renewable energy (electricity) consumption had a negative effect on FDI inflows as well as economic growth. Can and Korkmaz (2019) studied the relationship between renewable energy (electricity) consumption, FDI inflows and economic growth for Bulgaria’s economy in the period between 1990 and 2016 using Auto Regressive Distributed Lag (ARDL) test. The study revealed that economic growth, FDI inflows and renewable energy (electricity) consumption do not cause one another.
2.1. Conclusion
The empirical literature in this study presents mixed results. While some studies like that of Abdouli and Hammami (2017), Gökmenoğlu and Taspinar (2016), Sapkota and Bastola (2017) and Doytch and Narayan (2016) argue that, FDI inflows are stimuli for economic growth as well as more use of renewable energy (electricity inclusive), other studies however indicate that there is no significant relationship between renewable energy consumption and FDI inflows as well as economic growth in both developed and developing countries (Can and Korkmaz 2019) and (Lee and Jung 2018). The mixed results in the literature presented in this study therefore calls for a critical study to investigate the causal relationship between electricity consumption and Uganda’s FDI inflows in the period under the review.
3. Methodology
3.1. Introduction
This section presents the methodology adapted by this study to analyze the data. The methodology section in this study indicates the data type and sources, data estimation techniques, model specification and the analytical procedures carried out in the study. Details of the methodology adapted by this study is indicated below.
3.2. Data Type and Sources
The study uses annual secondary data set on FDI inflows, domestic investment, GDP growth, trade liberalization and electricity consumption collected for the period between 1987 and 2018. These data sets have been obtained from Government of Uganda data base, Uganda Electricity Regulatory Authority as well as other sources Uganda's Economy was liberalized in 1992.
3.3. Data Estimation Technique
The estimation techniques for times series data in this study uses e-views software to analyze the data. Various tests and analyses have been carried out in this study. These include; stationarity test, cointegration test, granger causality test and vector error correction model. Details of these tests and analyses carried out in the study are indicated below.
3.3.1. Statistical Test
This test includes Stationarity test and Cointegration test. The details of these tests are indicated below.
3.3.1.1. Stationarity Test
The stationarity of each individual data series has been estimated in this study using Augmented Dickey Fuller (ADF) test and Phillips Perron (PP) test. A unit root null hypothesis has been tested against a stationary alternative. The stationarity test in this study uses regressions of a time series data analyzed against a constant. These regressions can be expressed as follows; | (1) |
 | (2) |
The stationarity of residuals (εt) has been tested. Lag length (p) of ADF (dYt-i) and Phillips Perron equations have been selected using Schwarz Information Criterion (SIC) and Bartlett Kernel respectively.
3.3.1.2. Cointegration Test
Johnsen (1988) proposes a procedure to test for cointegrating relationship within endogenous variables. This procedure has been adapted by this study to test for cointegrating relationship within endogenous variables in this study. This procedure is based on Maximum Likelihood (LM) test and unrestricted Vector Auto Regression (VAR) test. Cointegration rank r (number of cointegrating vectors) has been tested using Trace Statistics and Maximum Eigen Statistics (MES). The trace statistics, test for null hypothesis that there are at most r cointegrating vectors against alternative of r or more cointegrating vectors. While the MES test for null hypothesis of r cointegrating vectors against alternative of r+1 cointegrating vectors.
3.3.2. Diagnostic Tests
Diagnostic tests have not been carried out in this study because of the presence of a dummy variable (lib) that takes the value 0 before trade liberalization and the value 1 after significant trade liberalization.
3.4. Causal Relationship between Electricity Consumption and Uganda’s FDI Inflows
The causal relationship between electricity consumption and Uganda’s FDI inflows has been carried out in this study using causality analyses. The causality analyses in this study uses granger causality test and Vector Error Correction Model (VECM). The details of the causality analyses carried out in this study are indicated below.
3.4.1. Granger Causality Test
The granger pair wise test has been carried out in this study to estimate the causal relationship between electricity consumption and Uganda’s FDI inflows in the period, 1987-2018. Granger (1969) proposed a time series data technique to determine causality between set of variables. The granger causal relationship is said to exist if variable Xt helps to improve the forecast of another variable, say Yt. The forecast of Yt can be denoted as Yt+h|Ώ for optimum h–step at origin t, based on set of all relevant information in the universe (Ώt). Xt is said to be granger non-causal for Yt if and only if | (3) |
Xt can be non-causal for Yt if removal of past information from Xt does not change the optimal forecast horizon. In turn Xt granger causes Yt if (3) does not hold for at least one h and therefore a better forecast of Yt can be obtained from some forecast horizon by including the past information on Xt in the information set. The optimum lag length in the granger causality test can be determined by information criteria.
3.4.2. Vector Error Correction Model (VECM)
The analysis of VECM has been carried out in this study to determine whether there exists any short run or long run causal relationship within variables in the model specified. The presence of cointegrating relationship within endogenous variables is a necessary condition for estimating VECM. Following Bruce and Natalie (2003), the general form of the vector error correction model estimated in this study can be presented as follows; | (4) |
Where Xt is an nx1 matrix and n = 5 vectors of dependent variables,  and γ are parameters, while Vt is a residual. Error correction mechanism is evidence in the Error Correction Term (ECTt-1). There are as many error correction terms as there are cointegrating vectors (r). Parameter γi associated with ECTt-1 measures proportion of adjustment back towards equilibrium that can be completed within a single period. If parameter γi is not significantly different from zero then there is no error correction process working within the model. Parameter βt on the other hand, indicates the presence of a short-term lag from one variable to another and it measures short term adjustment back towards equilibrium.
3.5. Conceptual link between Electricity Consumption and Uganda’s FDI Inflows
This study postulates that increase in FDI inflows stimulate a positive shift in Uganda’s electricity consumption. Nonetheless, the increase in FDI inflows and consequently a positive shift in Uganda’s electricity consumption can only be feasible when there is an enabling trade policy in place. A well-functioning trade policy stimulates increase in FDI inflows which consequently promotes domestic investment, GDP growth as well as positive shift in electricity consumption. Details of which are indicated in figure 4 below. | Figure 4. Conceptual Link between Electricity Consumption and Uganda’s FDI inflows (Source: Adopted and modified from Wouter(2020)) |
Nevertheless, it is also possible that the more the increase in electricity consumption, the better is the performance of domestic investment and consequently GDP. The above conceptual link between electricity consumption and Uganda’s FDI inflows can be presented in a conceptual model as indicated below.  | (5) |
The expected signs from the above conceptual model can be presented as follows; | (6) |
 | (7) |
 | (8) |
 | (9) |
Where; FDI = Foreign Direct Investment inflows; ELC = Electricity consumption; DINV = Domestic Investment; GDP = Economic Performance; Lib = Trade Liberalization (Trade Openness).
3.6. Model Specification
The model estimated in this study has been adapted from (Taremwa, 2015) but modified to provide a model which states that FDI inflows depends on electricity consumption and other existing macroeconomics variables such as; domestic investment, GDP growth as well as the openness of the economy (trade liberalization). Thus; | (10) |
Where;  | (11) |
FDIt = Foreign Direct Investment inflows at time t.; ELCt= Electricity consumption at time t DINVt = Domestic Investment at time t; GDPt = Economic performance at time t; Lib = Trade liberalization (represented by a dummy variable lib which takes the value 0 in the period before trade liberalization and the value 1 in the period after trade liberalization).
4. Presentation of the Results
This section presents the results for this study. The results in this study include; descriptive statistics; statistical test, granger causality test and vector error correction estimates. The details are indicated below.
4.1. Descriptive Statistics
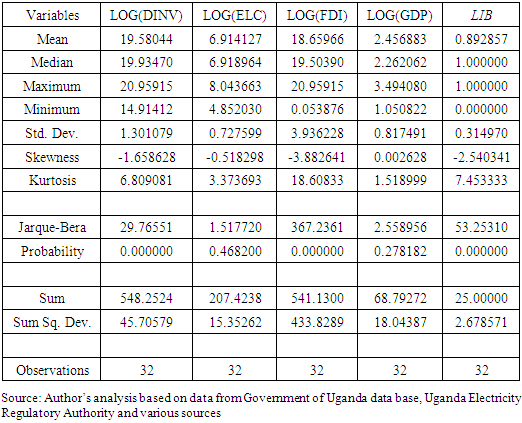
Descriptive statistics have been estimated in this study to provide explanation on the characteristics of the data estimated. The results for descriptive statistics estimated in this study are presented in table 2 below.Table 2. Descriptive Statistics
 |
| |
|
The summary statistics presented in the table above indicate that normality test has been rejected in three out of five variables at 5 percent level of significance. The non-normality in the table appears to be caused by the excess of kurtosis. The kurtosis measures the peakedness or the flatness of the distribution in the series. The standard deviation on the other hand, measures the deviation of each an every variable from its sample mean.
4.2. Statistical Tests
These tests include unit root test and cointegration test. The unit root test, tests for stationarity of residuals in the model specified while cointegration test, tests for long run relationship within variables in the model specified. The details of which are indicated below.
4.2.1. Test for Stationarity
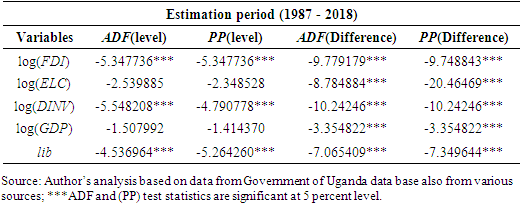
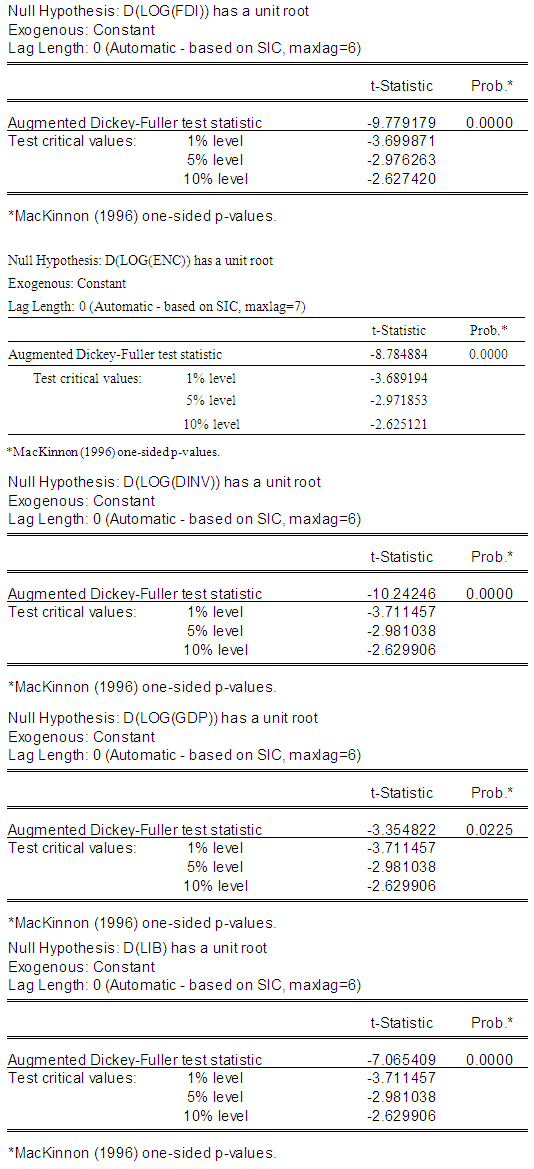
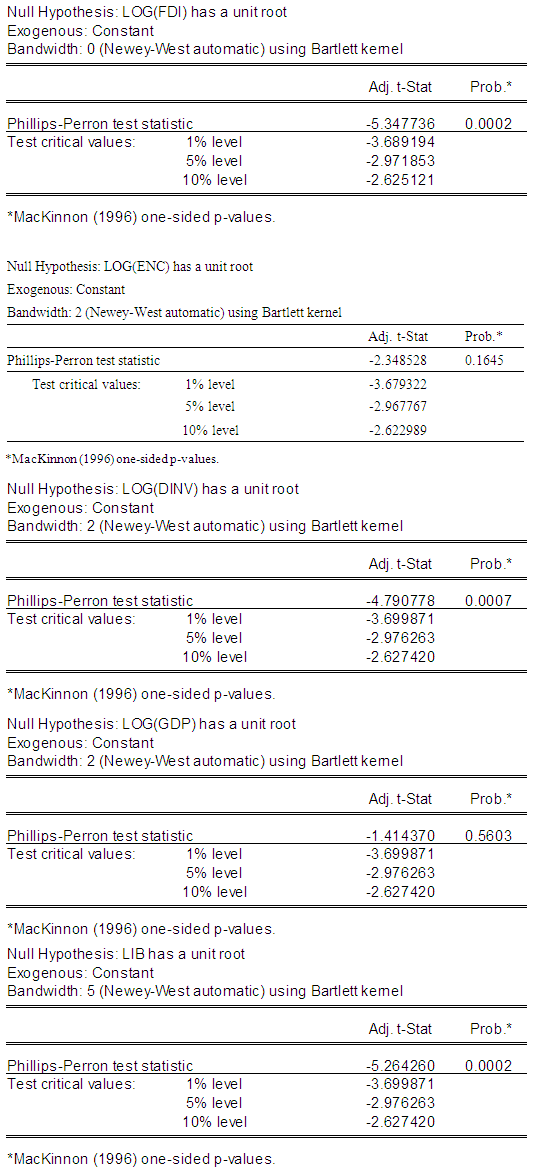
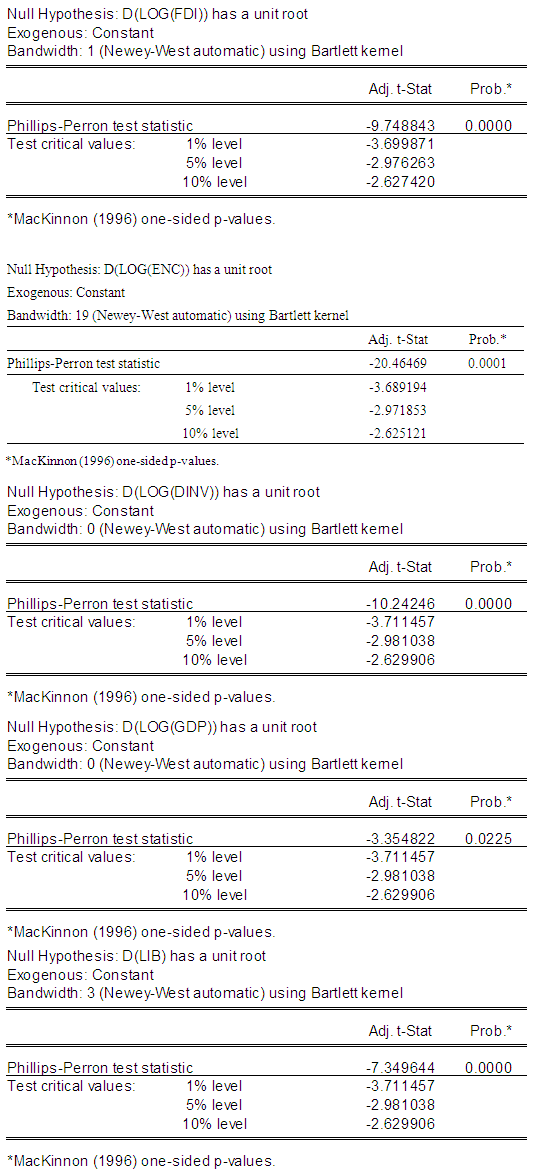
The stationarity of residuals in this study has been tested using Augmented Dickey-Fuller (ADF) test and Phillips Perron (PP) test. The summary statistics in table 3 present the ADF and the Phillips Perron statistics for the variables estimated. The results in this table indicate that all variables are stationary at first difference.Table 3. Stationarity Test Results
 |
| |
|
4.2.2. Test for Cointegration
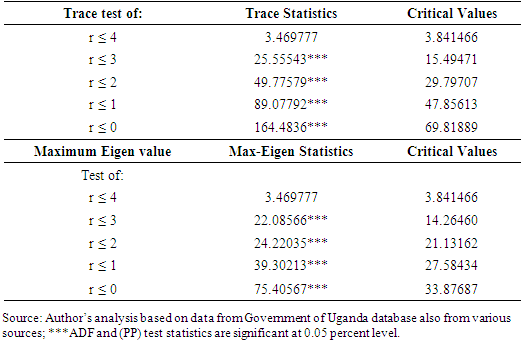
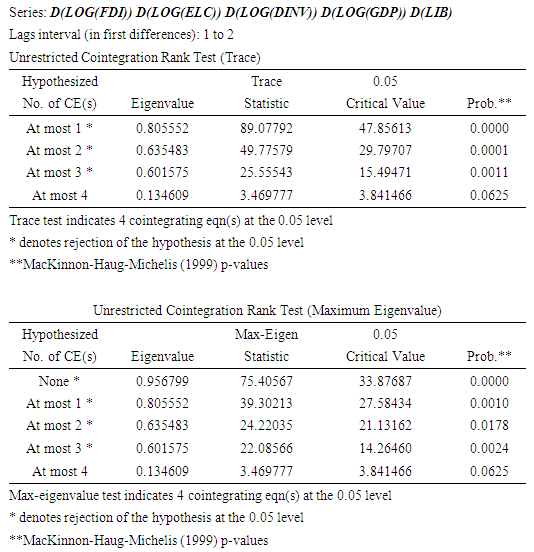
Cointegration test has been carried out in this study to determine if there exists any long run relationship within variables in the model specified. The results for the cointegration test carried out in the study are presented in table 4 below.Table 4. Cointegration Test Results
 |
| |
|
The results from Unrestricted Trace Statistics (UTS) indicate four cointegrating vectors at 0.05 percent level of significance; while the results from Maximum Eigen Statistics (MES) also indicate four cointegrating vectors at 0.05 percent level of significance. Thus, there exists long run relationship within variables in the model specified.
4.3. Causal Relationship between Electricity Consumption and FDI inflows
The causal relationship between electricity consumption and Uganda’s FDI inflows has been carried out in this study using granger causality test and VECM. The details of the results from these analyses are indicated in the subsequent sections below.
4.3.1. Granger Pairwise Test
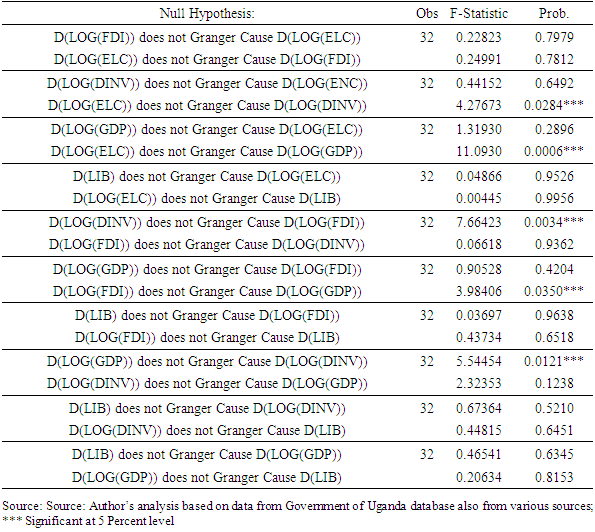
This test indicates the pairwise relationship between variables in the model specified. It indicates whether electricity consumption does cause Uganda’s FDI inflows or Uganda’s FDI inflows can be explained by other variables specified in this study. The results from the granger pairwise relationship in this study are indicated in the table 5 below.Table 5. Pairwise Granger Causality Tests
 |
| |
|
Much as the results from granger pairwise test indicate that electricity consumption (ELC) granger causes domestic investment (DINV), domestic investment (DINV) granger causes FDI inflows, GDP growth granger causes domestic investment (DINV) and FDI inflows granger causes GDP growth, electricity consumption (ELC) granger causes GDP growth, there is no causal relationship between electricity consumption (ELC) and Uganda’s FDI inflows in the period under the review. The above results therefore suggest that FDI inflows into Uganda in the period under the review has never been caused by electricity consumption. These results further suggest that Uganda’s FDI inflows have never been involved in the manufacturing sector in the country which in most cases use electricity to process output.
4.3.2. Estimates of Vector Error Correction Model (VECM)
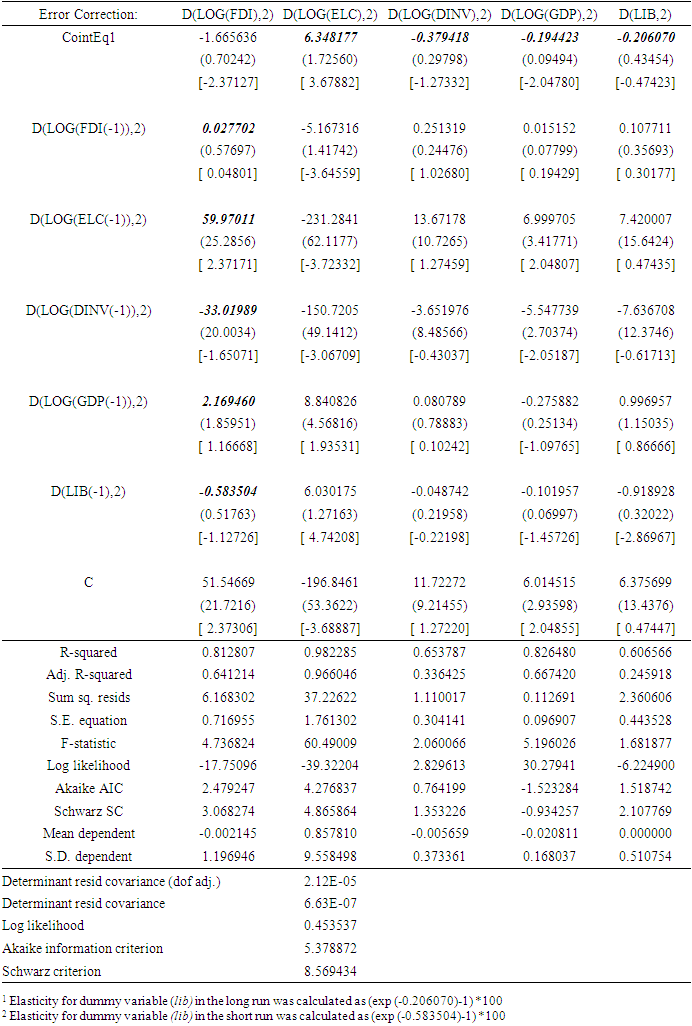
The second part of causality analysis carried out in this study estimates vector error correction model to determine whether there is any short run or long run causal relationship between electricity consumption and Uganda’s FDI inflows in the period under the review. The VECM results in this study are presented in table 6 below. Table 6. Vector Error Correction Estimates
 |
| |
|
The results in this table indicate the estimated parameters in each of the five versions of the VECM equations that are drawn from each column. The first row contains Error Correction Term (ECT) for each equation. The estimated parameters on ECT are presented in the first row and their standard errors are presented in the second row, while t ratios are presented in the third row.The results for the long run relationship in the VECM estimate indicate that when FDI inflows increase by 1 percent electricity consumption increases by 6.3 percent. Secondly, in the long run, when FDI inflows increase by 1 percent, domestic investment reduces by 38 percent. Thirdly, in the long run, when FDI inflows increase by 1 percent, GDP reduces by 19 percent. Finally, in the long run, when the economy is fully liberalized (lib), FDI inflows reduces by 18.61 percent. Following the results for the long run relationship in the VECM estimate presented in this study, it is therefore clear that FDI inflows increases Uganda’s electricity consumption by 6.3 percent. This result therefore indicates that FDI inflows is the major determinants of Uganda’s electricity consumption in the long run. But domestic investment (DINV), GDP growth and trade liberalization (lib) do not in any way attract FDI inflows in to the country in the period under the review. This is indicated below. | (12) |
The results for the short run relationship in the VECM estimate in this study indicate that 1percent increase in FDI inflows increases Uganda’s electricity consumption (ELC) by 60 percent, 1 percent increase in FDI inflows reduces domestic investment (DINV) by 33 percent, 1 percent increase in FDI inflows increases GDP growth by 2.2 percent. Finally, when the economy is fully liberalized (lib) FDI inflows reduces by 44.22 percent. This is indicated below. | (13) |
Following the results for the short run relationship in the VECM estimate presented in this study, it is therefore clear that FDI inflows increases Uganda’s electricity consumption by 60 percent. This result therefore indicates that FDI inflows is the major determinants of Uganda’s electricity consumption in the short run.
5. Conclusions and Recommendations
This study uses granger causality test and VECM to investigate the causal relationship between electricity consumption and Uganda’s FDI inflows in the period under the review. Following the estimated results from granger causality test, it is clear that electricity consumption does not cause Uganda’s FDI inflows. Such a result has also been alluded to by several studies. Some of these studies are; Can and Korkmaz (2019) and Lee and Jung (2018). The result above may perhaps suggest that Uganda’s FDI inflows are never involved in the manufacturing sector of the economy which in most cases use electricity to process output.The results from VECM estimates on the other hand, indicate that electricity consumption promotes Uganda’s FDI inflows both in the short and the long run. The above results have also been alluded to by several studies. Some of these studies are; Abdouli and Hammami (2017), Gökmenoğlu and Taspinar (2016), Sapkota and Bastola (2017) and Doytch and Narayan (2016).Following the results from the VECM estimates presented in this study, it can be observed that the short run results from the VECM estimates post statistically significant result (60 percent) than the long run results (6.3 percent). This performance may perhaps suggest that as Uganda’s economy moves towards the long run period, less electricity will be consumed by the FDIs and yet electricity is the main source of energy in the country. The above performance may therefore imply that the FDI inflows in to the country are less interested in manufacturing as the economy moves towards the long run period.Consequent to the results from granger causality test and VECM estimates presented in this study, it is therefore clear that, Although the result from granger causality test in this study indicates insignificant relationship between electricity consumption and Uganda’s FDI inflows, VECM estimates however presents significant results. Nevertheless, as the economy moves towards long run period, the significant performance from VECM estimates diminishes and may perhaps in the very long run period becomes statistically insignificant. This study therefore recommends that FDIs which is geared towards manufacturing sector should be encouraged in Uganda. This is because manufacturing sector in Uganda uses a significant amount of energy (electricity) in the production process which subsequently promotes economic growth. Secondly, the long run electricity demand and consumption should be encouraged in Uganda by fast-tracking and consolidating intervention in the electricity generation.
6. Limitations of the Study
This study only considered macroeconomics variables like GDP, domestic investment and trade liberalization to be responsible for FDI inflows into Uganda while ignoring other factors like tax holiday, foreign exchange market and good governance. Nevertheless, there is a possibility that the variables being ignored by this study may perhaps contribute significantly to Uganda’s FDI inflows in the period under the review.
Appendix 1: Augmented Dickey-Fuller (ADF) Test and Phillips Perron Tests
Augmented Dickey-Fuller (ADF) Test at Level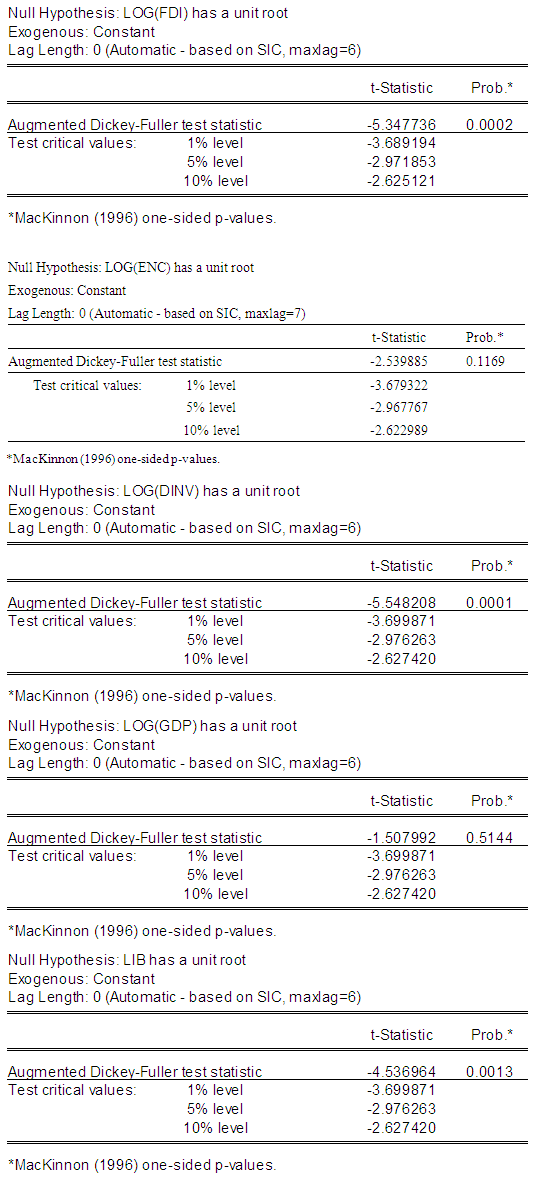 Augmented Dickey-Fuller Test at First Difference
 Phillips Perrion Test at Level
 Phillips Perron Test at First Difference
Appendix 2: Cointegration Test
References
| [1] | Abdouli M. and Hammami S., (2017). Exploring Links between FDI Inflows, Energy Consumption, and Economic Growth: Further Evidence from MENA Countries Journal of Economic Development, 2017, vol. 42, issue 1, 95-117. |
| [2] | Bruce F. and Natalie J. (2003). Population change and Australia Living Standard – Discussion Paper (2003-2006). ISSN 1443-8593 ISBN 186295-1365. Available at http://www.utas.edu.au/economics. |
| [3] | Can H. and Korkmaz Ö. (2019). The relationship between renewable energy consumption and economic growth: The case of Bulgaria, International Journal of Energy Sector. Management, Vol. 13 No. 3, pp. 573-589. https://doi.org/10.1108/IJESM-11-2017-. . 000. |
| [4] | Gökmenoğlu K. and Nigar Taspinar N. (2016). The relationship between Carbon Dioxide Emission, Energy Consumption, Economic Growth and FDI inflows: The Case of Turkey. The Journal of International Trade & Economic Development, Taylor and Francis Journals, vol. 25(5), pages 706-723, August. |
| [5] | Granger C.J. (1969). Investigating Causal relationships between variables. Econometrics Models and Cross Spectra Methods: Econometrica; Vol. 37. 37, 1969, pp 425 -435. |
| [6] | Doytch and Narayan (2016). Doytch N. and Narayan S. (2016). Does FDI influence Renewable Energy Consumption? An analysis of sectoral FDI impact on Renewable and Non- . Renewable Industrial Energy Consumption. Energy Economics. |
| [7] | Ibrahim D. (2015) Energy Consumption-Economic Growth Nexus: Evidence from Linear and Nonlinear Models in Selected African Countries. Ibrahim D. Raheem1, Agboola H. Yusuf2 1 Centre for Petroleum, Energy Economics and Law, University of Ibadan, Nigeria. Tel.: +234-703-2659866. Email: i_raheem@ymail.com, 2 Department of Economics, University of Ilorin, Nigeria. Tel.: +234-803-7289712. Email: agboolayusuf2009@yahoo.com. |
| [8] | Lee S.H, JungY. (2018). Causal dynamics between Renewable Energy Consumption and Economic Growth in South Korea: Empirical analysis and policy. |
| [9] | Johnsen S. (1988). Statistical Analysis of Cointegrating Vectors. Journal of Economics Dynamics and Control. Vol. 1, No. 2-3, pp 231-254. |
| [10] | Keho Y. (2016) Energy consumption, economic growth and carbon emissions: Cointegration and causality evidence from selected African countries; Yaya Keho (yayakeho@yahoo.fr) Energy, 2016, vol. 114, issue C, 492-497. |
| [11] | Leitão, N. C. (2015). Energy Consumption and Foreign Direct Investment: A Panel Data Analysis for Portugal. International Journal of Energy Economics and Policy, 5(1), 138- 147. |
| [12] | Sapkota, P. and Bastola U. (2017). Foreign Direct Investment, Income, and Environmental Pollution in Developing Countries: Panel Data Analysis of Latin America. Energy Economics, 64, 206-212. https://doi.org/10.1016/j.eneco.2017.04.001. |
| [13] | Sekantsiand, L. and Motlokoa, M. (2015). Evidence on the Nexus between Electricity Consumption and Economic Growth Through Empirical Investigation of Uganda. |
| [14] | Sirin S.M. (2017) Foreign direct investments (FDIs) in Turkish power sector: A discussion on investments, opportunities and risks. ELSEVIER (Renewable and Sustainable Energy Review; (volume 78 pages 1367-1377. |
| [15] | Taremwa K. M. (2015). Examining the relationship between electricity consumption and Investment. Stellenbosch University. |
| [16] | Wouter V. D. (2020). The macroeconomic effects of tax changes: Evidence using real-time data for the European Union. Economic Modelling. https://doi.org/10.1016/j.econmod.2020.03.007. |


 and γ are parameters, while Vt is a residual. Error correction mechanism is evidence in the Error Correction Term (ECTt-1). There are as many error correction terms as there are cointegrating vectors (r). Parameter γi associated with ECTt-1 measures proportion of adjustment back towards equilibrium that can be completed within a single period. If parameter γi is not significantly different from zero then there is no error correction process working within the model. Parameter βt on the other hand, indicates the presence of a short-term lag from one variable to another and it measures short term adjustment back towards equilibrium.


 Augmented Dickey-Fuller Test at First Difference
 Phillips Perrion Test at Level
 Phillips Perron Test at First Difference

 Abstract
 Reference
 Full-Text PDF
 Full-text HTML


