Anuwoje Ida Logubayom1, Kwame Yeboah2
1Department of Statistics, University for Development Studies, Navrongo, Ghana
2GLICO Insurance Company, Accra Annex Branch
Correspondence to: Anuwoje Ida Logubayom, Department of Statistics, University for Development Studies, Navrongo, Ghana.
| Email: |  |
Copyright © 2023 The Author(s). Published by Scientific & Academic Publishing.
This work is licensed under the Creative Commons Attribution International License (CC BY).
http://creativecommons.org/licenses/by/4.0/

Abstract
Human life is full of risk for which the primary method employed in mitigating these risks and losses they come with is by insuring. Over the past four years in Ghana, most of the life insurance companies have recorded a surge in surrender of insurance policies, with the trend being more evident in 2017. This research’s interest was to investigate the prognostic factors contributing to the outcome of surrendering a life insurance policy. A total of a hundred (100) sampled secondary dataset was sourced from the GLICO agent-clientele report, Accra annex branch, covering a period of 2 years. With the help of the SAS, STATA and SPSS statistical packages, survival analysis, which is a model used in predicting the time until an event of interest (time till surrender of a policy) occurs, was performed on the data collected. The results showed, the average time to surrendering a policy after purchase was approximately six (6) months and ten (10) days. A plot of the Kaplan-Meier survival curves showed the survival probabilities amongst different categories of the employment status, religion and pay source significantly differ, this was further confirmed by the Log-rank test of survival differentials as the p-values of the Log-rank test of these variables were all less than 5% significance level (P-values of 0.0028, 0.0039 and 0.0003 respectively). Policyholders who are employed had a higher chance of not surrendering a policy compared the self-employed. Also, Muslims had a higher chance of not surrendering than Christians and traditionalist. Policyholders with their premiums paid through indigenous banks also had a low surrender chance than payment through controller and accounting general, foreign banks, and by cash. To identify the significant prognostic determinants of time to surrendering a policy, a regression with survival data was performed (Cox proportional hazard regression and accelerated failure time models). Although the results of the cox model showed the model was significant, showing the covariates significantly account for variation in time to surrender of policy, the prerequisite for the analysis of Cox model, being the proportionality of hazards amongst the covariates was violated therefore indicated a need for a further analysis with the accelerated failure time (AFT) models. The AFT models fitted showed that the gamma model was best for modelling the relationship between the covariates and time to surrender. The Gamma model, after evaluation evidenced that the significant factors of surrender were the number of dependents, basic plan type, pay source, employment status and age of policyholders. Whiles the scale and shape parameters, indicated the hazard curve begins at zero and increases at an increasing rate to a maximum value with time.
Keywords:
Survival Analysis, Insurance, Policyholder, Surrender of a Policy
Cite this paper: Anuwoje Ida Logubayom, Kwame Yeboah, Survival Analysis on Prognostic Factors of Surrendering of Life Insurance Policies, American Journal of Economics, Vol. 13 No. 1, 2023, pp. 13-24. doi: 10.5923/j.economics.20231301.02.
1. Introduction
Life insurance is a contract between an insurance policy holder and an insurer or assurer, where the insurer promises to pay a designated beneficiary a sum of money (benefit) in exchange for a premium, upon a specific event in the life of the insured e.g. Education, marriage, pension, death etc. Depending on the contract, other events such as terminal illness or critical illness can also trigger payment. The policy holder pays a premium, either regularly or as a lump sum. Other expenses, such as funeral expenses, can also be included in the benefits. It provides for payments of a fixed sum to the insured either on a fixed date or on the happening of an event which is certain. Surrender concept:A surrender is a full cancellation of a life insurance policy at any time. A surrender does not affect your credit score, and a surrender will not affect your ability to get a new life insurance policy in the future, however, there may be fees associated with a surrender. These are known as surrender charges and are taken from the cash value (if any). A term life insurance policy does not have any surrender fees.The uptake of life insurance is generally very low in the third world countries compared to the developed countries. In Africa, only South Africa has a reasonable penetration of life insurance at 15%. According to Life Insurance and Market Research Association (LIMRA, 2011) report, factors explaining the low penetration of life insurance in the developing countries are: large distribution by agents who mostly misconduct themselves, consideration of insurance as a luxury rather than a basic need, processing of the insurance proposal and grievances in claim settlement.Analyses of life insurance risks has been deeply looked at in past literature. In the light of recent and expected changes in regulations regarding fair value evaluations (International Actuarial Association, 2008), there have been several approaches to model stochastic mortality (Ballotta and Habermann, 2006) and overall risk profile of life insurance, taking into account surrender risk and characteristics of Italian life insurance market, (Savelli (1993), De Felice and Moriconi (2002) and Olivieri and Pitacco (2005)). It’s worth mentioning Albizzati and Geman (1994) and Grosen and Jørgensen (1997, 2000), which represents the basic references for more recent papers.However, several policy think-tanks and research institutions such as the Institute of Statistical, Social and Economic Research (ISSER) believes slowdown in the global economic environment and slump in commodity prices will dampen Ghana’s economic growth prospects. The uncertainty in the economic environment, however, is a worry to life insurers who believe the situation is frustrating efforts to boost insurance penetration as the present economic condition has pushed people to turn to their life insurance policies to meet immediate cash needs by surrendering their policies. This is evident in the fact that over the past four years, most of the life insurance companies recorded a surge in surrender with the trend being more evident in 2017 amidst the tightening of the central bank’s monetary policy regime, rise in inflation, utilities and fuel prices as well as depreciation of the cedi, (Ghanaweb, 2017). Survival analysis provides a powerful statistical analytic tool to investigate the underlying reality of the parameters available in the data in a way that can show how other, previously ignored parameters, such as age, sex, religion, educational status, marital status, policy type or number of dependents, may have affected observed policyholder behavior in the researches mentioned earlier on. The aim of this work is not to price surrender options, but to use survival analysis in the context of lapse/surrender risk to understand the relationships between risk factors and to calibrate the lapse/surrender risk as accurately as possible. This work seek out to model and adequately determine the prognostic factors of a policy holder surrendering an insurance policy by analysing the average time to surrendering a policy; compare the survival probabilities of surrendering a policy with different groups of the independent variables by log-rank test; and identify the viability of the factors that influence the surrendering of a life insurance policy as well as provide recommendations to help reduce the high rate of surrender associated with life policies.Furthermore, such analyses allow better understanding of the likely variability in the decrement rates for generating relevant sensitivity tests and calibrating internal models in so far as the stochastic modelling of longevity, lapse and mortality risk is concerned.
2. Research Methodology
2.1. Data Type and Source
The data type used is secondary and was sourced from GLICO agent-clientele report, Accra annex branch on policyholders of the insurance company. The information covers a period of two years from 01/05/2016 to 18/01/2018. The data collected contain the main information needed to achieve the objectives of the study. The total data set consist of one hundred (100) policyholders (males and females) who are/were holders of various insurance policies. Out of the total dataset, 68 were uncensored and 32 were censored.
2.2. Variables in the Study
The response variable in this study is time to surrender of a policy whiles the covariates are premium pay source, premium amount, number of dependents, religion, educational level, basic plan type, gender, age and marital status of the policy holder.
2.3. Data analysis Techniques
2.3.1. Basics of Survival Analysis
The distribution of survival times is usually described or characterized by three functions: the survivorship function, probability density function and hazard functions. These three functions are mathematically equivalent—if one of them is given, then the other two can be derived. LetT denote the survival time. The distribution of Tcan be characterized by three equivalent functions.Survivorship Function (or Survival Function)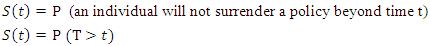 | (1) |
From the definition of the cumulative distribution function F(t) of T,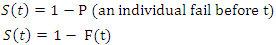 | (2) |
Probability Density Function (or Density Function)This defined as the limit of the probability that an individual fail in the short interval t to t + ∆t per unit width ∆t, or simply the probability of failure in a small interval per unit time. It can be expressed as: | (3) |
Hazard FunctionThe hazard function h(t) of survival time T gives the conditional failure rate. This is defined as the probability of failure during a very small-time interval, if the individual has survived to the beginning of the interval, oras the limit of the probability that an individual fail in a very short interval, t + ∆t, given that the individual has survived to time t:  | (4) |
The hazard function can also be defined in terms of the cumulative distribution function F(t) and the probability density function f (t): | (5) |
2.3.2. Non-Parametric Comparison of Survival Distribution (Log Rank Test)
The main goal of the log rank test is to evaluate whether two or more groups of a variable are statistically equivalent. For two groups, the log–rank statistic is based on the summed observed minus expected score for a given group and its variance estimate. The test statistic is approximately chi-square in large samples with G −1 degrees of freedom, where G denotes the number of groups being compared. Where O, is the observed and E, is the expected 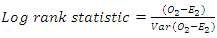 | (6) |
H0: no difference between survival curves Log–rank statistic  with 1 degree of freedom (df) under H0
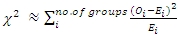 | (7) |
An approximation to the log–rank statistic, shown here, can be calculated using observed and expected values for each group without having to compute the variance formula. The approximate formula is of the classic chi-square form that sums over each group being compared, the square of the observed minus expected value divided by the expected value.
2.3.3. Regression of Survival Data
Cox Proportional Hazard Regression (Semi-Parametric Approach)A Cox model provides an estimate of surrender effect on survival after adjustment for other explanatory variables. In addition, it allows us to estimate the hazard (or risk) of surrender of a policy for an individual, given their prognostic variables. The final model from a cox regression analysis will yield an equation for the hazard as a function of several explanatory variables. The cox proportional model is given as; | (8) |
 | (9) |
where: is the hazard function at time t for a subject with covariate values
  is the baseline hazard function, i.e., the hazard function when all covariates equal zero. Exp is the exponential function (exp(x)= ex),
  is the ith covariate in the model, and βi is the regression coefficient for the ith covariate,
  The Cox proportional hazards model, by contrast, is not a fully parametric model. Rather it is a semi-parametric model because even if the regression parameters (the betas) are known, the distribution of the outcome remains unknown. The baseline survival (or hazard) function is not specified in a Cox model, (Breda, 2006). The Cox model is used when the proportionality assumption is met.Proportionality AssumptionFor the Cox proportional hazard regression, we assume that the hazards are proportional over time which implies that the effect of a risk factor is constant over time. There are several approaches to assess the proportionality assumption, some are based on statistical tests and others involve graphical assessments.In the statistical testing approach, predictor by time interaction effects are included in the model and tested for statistical significance. If one (or more) of the predictor by time interactions reaches statistical significance (e.g., p<0.05), then the assumption of proportionality is violated, then the Cox proportional hazards model is not appropriate, therefore adjustments must be made to account for non-proportionality.Parametric regression model: Accelerated failure time An Accelerated failure time models is a parametric model that provides an alternative to the Cox proportional Hazard regression, mostly in situations where the proportionality assumption is violated and assumes that the effects of a covariate either accelerates or decelerates the life course of a survival time. The underlying assumption for AFT models is that the effect of covariates is multiplicative (proportional) with respect to survival time, whereas for PH models the underlying assumption is that the effect of covariates is multiplicative with respect to the hazard.For AFT models, the survival time assumes that, the log of the survival time T and the covariates are a linear function given as;
 Where x are the covariates,
  are the parameter estimate,
  is the scale parameter and
  is the error term.The AFT model changes the time scale by a factor of
  Depending on whether this factor is greater or less than one (1), time is either accelerated or decelerated. The error term
  has a distribution as
  which is independent of θ. Different distributions of
  leads to different distributions of
  . There are five main parametric AFT models, thus; the Weibull distribution, Exponential distribution, Log-logistic distribution, Log-normal distribution and the Gamma distribution. Because accelerated failure time models are purely parametric, the probability distribution of
  is well specified. For AFT models, positive coefficient increases the log survival and increases expected duration whiles negative parameter estimates decrease log survival and decreases expected waiting time.Selection for the appropriate family of distributions (AFT Models)This study used the AIC (Akaike Information Criterion), the AICC (Akaike Information Criterion Corrected), the BIC (Bayesian Information Criterion) and the LL (log-likelihood) value to select among the five fitted parametric models, the best model that described the relationship between the survival time and the covariates considered. The parametric model with the least AIC, AICC, BIC and the largest LL value provided the best fit of the relationship.
3. Results and Discussion
3.1. Descriptive Statistics of Variables
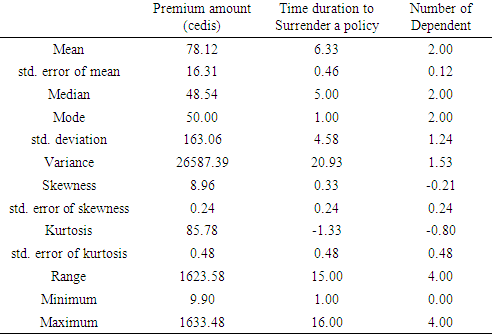
As seen in Table 1, the average premium amount paid by policy holders was about GH  78, 12 pesewas. The average number of dependents was about 2 people whiles and the average duration to surrendering a policy was approximately 6 months. The median time to surrender of a policy was 5 months, which implies as at 5 months, half of the policy holders have surrendered their policies. The modal premium amount (being the highest frequency premium amount) that most policyholders opted to pay was about GH
  50.00. Skewness quantifies how symmetric the distribution of the data is. A data set is symmetric when the skewness is equal to zero (0). From the results as shown in Table 1, amount of premium paid had skewness of 8.956 and duration for a policy had skewness of 0.332, hence were both positively skewed, which implies that they have more data points to the left side of their mean than the right side of their mean. It also implies majority of the respondents opted for lower premium amounts (premiums less than the average). However, the number of family dependents of a policy holder was negatively skewed (skewness = -0.211), which implies that you will find more data points to the right side of the mean than the left side of the mean. Kurtosis is a measure of whether the data are heavy or light peaked relative to a normal distribution. For a normal distribution, kurtosis = 3 (excess kurtosis = 0). When the excess kurtosis is less than zero (0), as in time duration (-1.333) and dependents (-0.798), then the distribution less peaked (platykurtic) compared to the normal distribution, but for excess kurtosis greater than zero (0) as in premium (85.78) then it is having heavier peaks (leptokurtic) as compared to the normal distribution. Premium amount being leptokurtic also implies volatilities in the premium amount charge by insurance companies to customers. The maximum or highest time duration observed for an individual holding onto a policy was 16 months and the minimum being 1 month. The maximum number of dependents of a policy holder was four (4).
Table 1. Descriptive statistics of quantitative variables
 |
| |
|
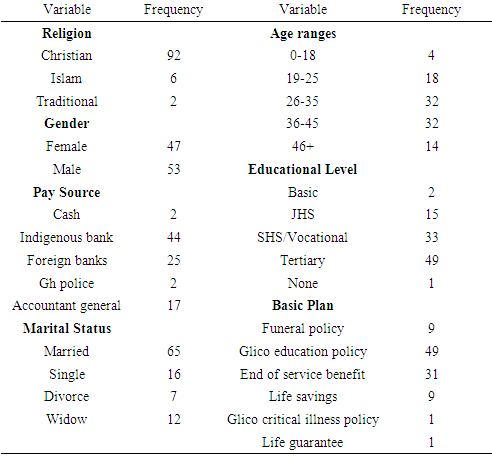
Table 2 shows the frequency distributions of the qualitative variables of the data obtained. Out of the total data set, there were 92 Christians, 6 Muslims and 2 traditionalists. With respect to the policy type, the education policy was the highly purchased with a frequency of 49, followed by end of service benefit with 31. The least purchased policy being a tie between life guarantee and the critical illness policy with 1 each. The study also discovered that, the marital status with the least purchased policy group was the divorced, with 7 and highest being the married group with 65. The study also showed that males patronized insurance policies more than females with the ratio 53 to 47, in favor of males. It can also be shown that the age ranges 26-35 and 36-45 purchase the insurance policies the most with 32 each and the least being 4 in the 0-18 age range.Table 2. Descriptive statistics of qualitative variables
 |
| |
|
3.2. Basic Survival Analysis of the Survival Time (Time to Surrendering a Policy)
3.2.1. Survival and Hazard Functions
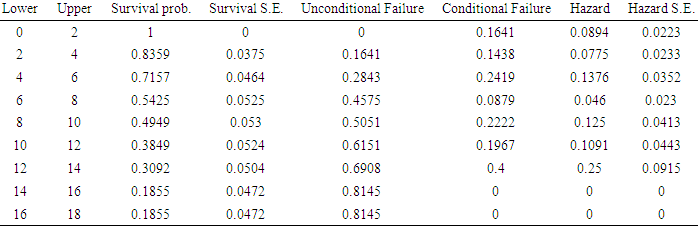
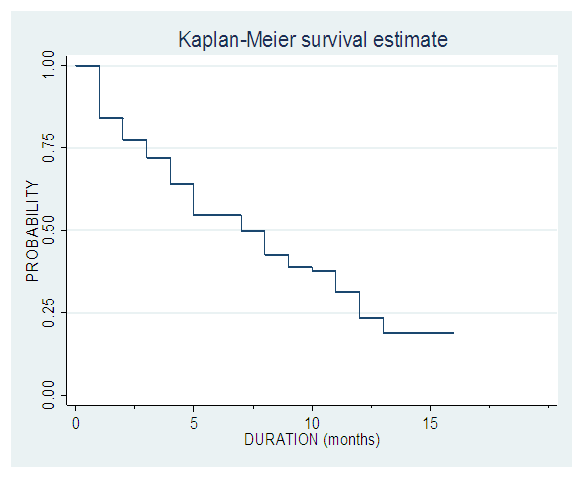
The survival probability gives the chances of a policyholder sustaining his policy. From the results as shown in Table 3, the probability that a policy holder will not surrender his/her policy within the first four (4) months of purchase was about 0.84, this further decrease to a probability of 0.72 within 4 – 6 months. As at the end of the eighth (8th) month, there was about 50 – 50 chances that a policy holder will still hold on to his/her policy (prob. = 0.54). There was however a constant probability of not surrendering from 14 to 18 months after purchase. Within the first two (2) months of policy purchase, the probability of survival is one (1), meaning there is an assurance one will hold on to his policy for the first two months. With time, the survival rate decreases, meaning as the policy holder progress into the subsequent months, he or she has a higher chance of surrendering the policy. The hazard function is the probability that an individual will experience an event (surrendering a policy, in this case of our study) within a small-time interval given that the individual has survived up to the beginning of the interval. It can therefore be interpreted as the surrender risk at time t. As observed in Table 3, the highest risk of surrendering a policy was within the interval 12 - 14 months (prob. = 0.25), followed by 4 – 6 months and the intervals 14 -16 and 16 – 18 the least, being zero (0). Further illustration is made in the follow up cumulative hazard and Kaplan-Meier survival curves in Fig 1 and 4 respectively below.Table 3. Analysis on the survival probability and hazard for duration interval of 2 months
 |
| |
|
 | Figure 1. Cumulative hazard curve |
 | Figure 2. Kaplan-Meier survival curve |
3.2.2. Log-Rank and Wilcoxon Test
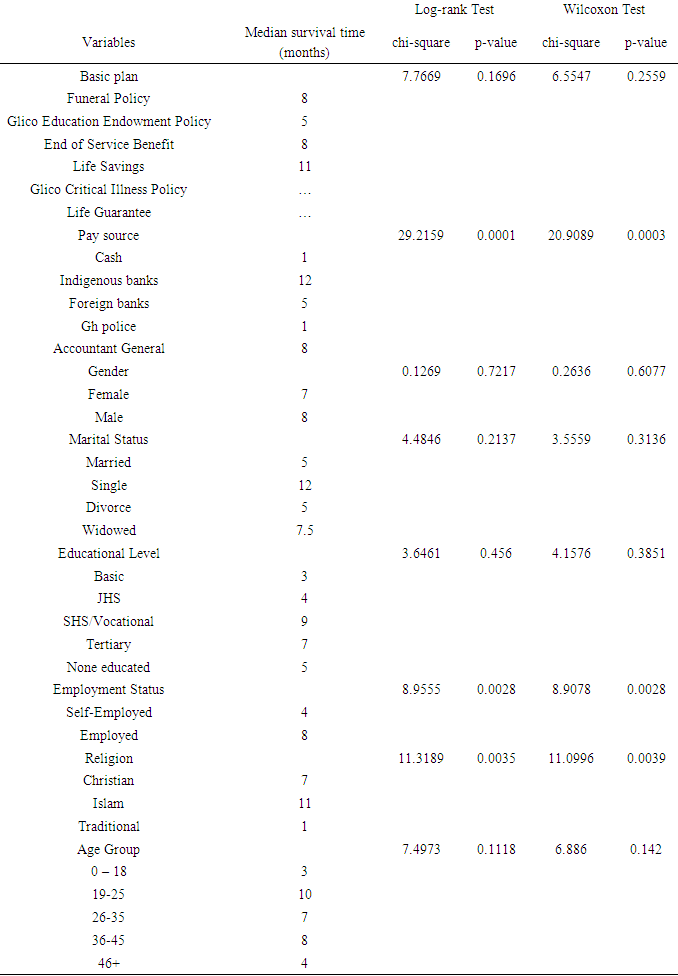
Testing for Difference in Survival Probabilities amongst Categorical VariablesThe null hypothesis for a log-rank test is that the groups in the various variables have the same survival probabilities. The graphs displayed in Fig 3a to 3h displays the Kaplan-Meier survival curves of the groups within the various qualitative variables. When a group’s curves intersect at some point in time, then that is an indication that the survival probabilities of the categories of such a variable are not different. It can be evident that, employment status, religion and pay source have their survival curves not intersecting, which indicates that the survival probability of the categories of each of these variables are different. This significant difference was confirmed by the Log-rank and the Wilcoxon test which were both significant for employment status, religion and pay source at 5% significance level (employment status with p-value of 0.0028 for both log rank and Wilcoxon, religion with p-value of 0.0035 for log rank and 0.0039 for Wilcoxon and pay source with p-value of 0.0001 for log rank and 0.003 for Wilcoxon) as shown in Table 4. The difference in survival for gender (male and female) gives a p-value of0.7217 for the log rank test, indicating that the gender groups do not differ significantly in survival probability. Other variables such as marital status, age, basic plan and educational level all just as the gender has their p-values greater than 0.05 hence no significant difference between their groups. This can as well be seen from the Kaplan- Meier curves for these variables, which all intersect at various points. It can further be seen that, for gender, males have a better survival time than females ((median survival = 8 for males and median survival = 7 for females), for pay source, customers whose premium payment are through the indigenous banks has better chance of not surrendering a policy (with median survival = 12) than those whose payment are through foreign banks, cash, Gh police, controller and accounting general. For religion, it is evident that Islam (median survival = 11) has a better survival, followed by Christian (median survival = 7) and lastly traditionalist (median survival = 1).Table 4. Log – rank and Wilcoxon Test
 |
| |
|
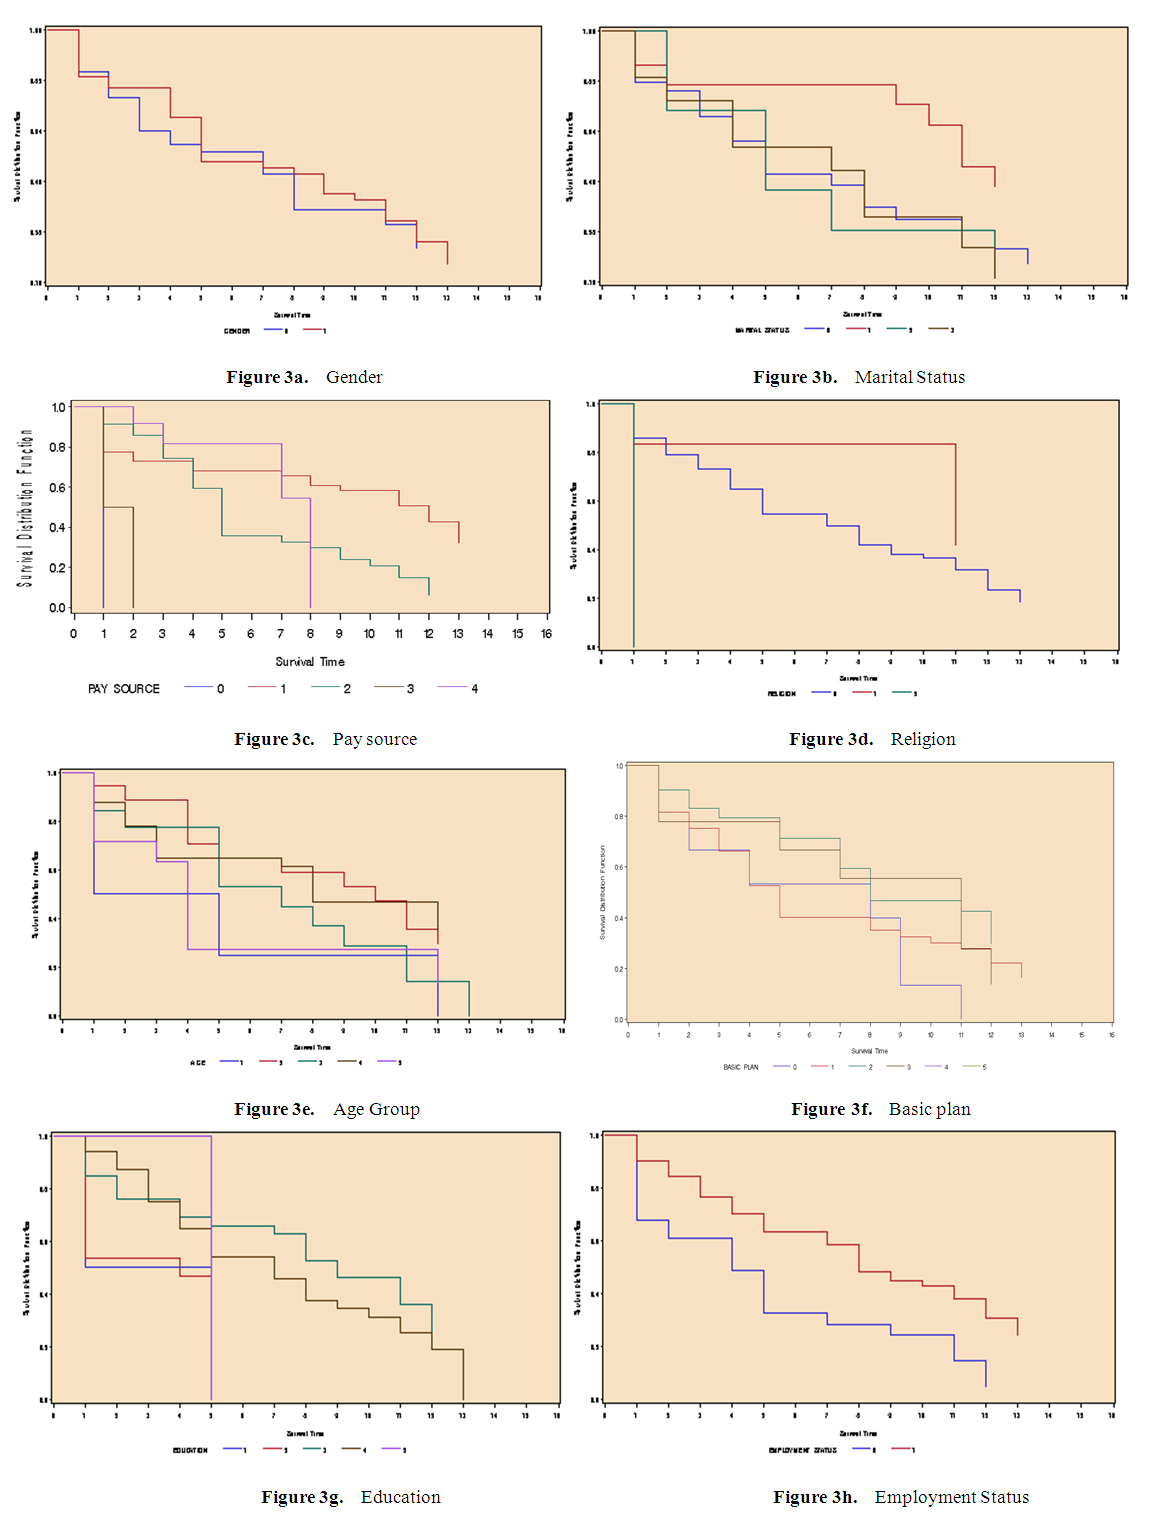 | Figure 3. Graphical representation of the PH test amongst the various qualitative variables |
3.3. Regression with Survival Time (Time to Surrendering a Policy)
To identify any significant prognostic factor that significantly determines the time to surrendering a policy by a policy holder, a regression analysis with the survival time (time to surrender) as dependent variable with gender, marital status, pay source, religion, age group, basic plan type, educational level, employment status, number of dependents and premium amount as covariates was performed. This was done with the semi-parametric cox-proportional hazard regression and the Accelerated failure time modelling approaches.
3.3.1. Cox Proportional Hazards (PH) Regression Analysis
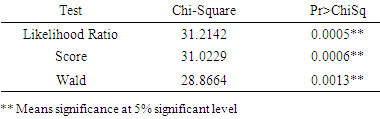
From Table 5, the output gives p-values for three alternative tests for overall significance of the fitted cox model. It can be seen that, the p-values of the tests were all less than 0.05 significance level, hence informs that, the cox regression is statistical significant. Thus, the model fitted significantly accounts for variations in time to surrendering a policy.Table 5. Test for significance of the Cox model
 |
| |
|
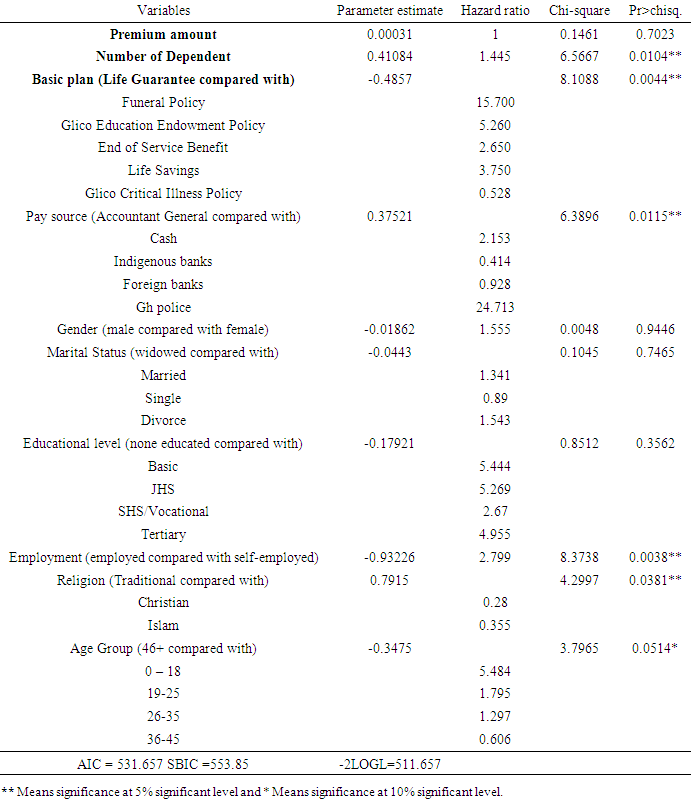
In Table 6, after accounting for basic plan type, age, employment status, religion, pay source and number of dependents which were all significantly related to the time to surrendering a policy, there was no statistically significant association between gender, educational status and premium amount on the survival time of a policy surrender. The hazard ratio is the function that corresponds to a change of one unit of a given variable to its other variable of the same group. Compared with the life guarantee plan, the policyholders of Glico critical illness policy have a 47.20% (hazard ration of 0.528) lower chance of experiencing a surrender. Whereas, other basic plans like funeral policy, Glico education endowment policy, end of service benefit and life savings have very high risk of surrender compared with the life guarantee plan ranging from 2 to 15). It was evident that comparing accountant general as a pay source with the other pay sources, the Ghana police has a very high surrender rate, followed by the payment by cash and the least being indigenous banks with 58.6% chance lower than the accountant general. Also, individuals within the ages 18-35 have a high chance of surrendering as compared to an individuals aged beyond 46 years (hazard ratio all greater than 1). However, respondents between the ages of 36-46 have a low risk of surrendering. Compared to females, males have about 56% chance of surrendering a policy (hazard ratio = 1.555). Also, an additional person to the number of dependents increases the chance of surrendering by about 45% (hazard ratio = 1.445). An increase in premium has no effect on a policy holder’s chance of surrender (hazard ratio = 1). Table 6. Parameter estimate and hazard ratio of the Cox model
 |
| |
|
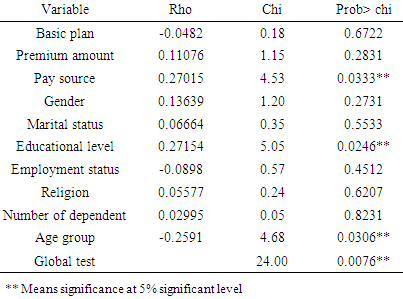
Test of proportional-hazards assumptionThe proportionality assumption was tested with the Schoenfeld residuals test, which test Ho that the assumption is met (hazard ratios are constant) against H1 that the assumption is violated. As shown in Table 7, there was an insignificance test statistic in basic plan, premium, gender, marital status, religion, employment and dependents at a 5%. A significant test statistic was however obtained for other covariates such as pay source, educational level, age as well as the global test. The assumption of proportionality of the hazard ratio of individuals was violated for these significant categories as well as the overall Cox model. This implies the Cox proportional hazards model is not appropriate enough, and adjustments must be made to account for the non-proportionality of the hazards.Table 7. Test of proportional-hazards assumption
 |
| |
|
3.3.2. Parametric Survival Model: Accelerated Failure Time Models (AFT)
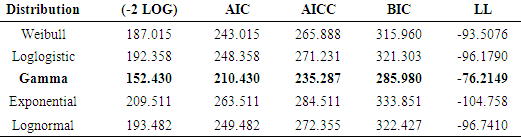
Since the proportionality assumption of the Cox model was violated, the AFT models were then fitted to adequately describe the relationship between the variables. AFT assumes that the relationships between the covariates and the dependent variable follow a given distribution. Five AFT models were considered; the Weibull, Logistic, Gamma, Exponential, and Lognormal. The models were fitted, then compared and the best model was selected based on AIC, AICC, BIC, and Log Likelihood (LL) model selection criteria. In the consideration process, the model with the maximum LL and the minimum value of the other model selection criteria stated in this work is preferred. From Table 8, the Gamma distribution has the maximum LL and least AIC, AICC, BIC, -2LOG, hence preferable.Table 8. Accelerated Failure Time Models Analysis
 |
| |
|
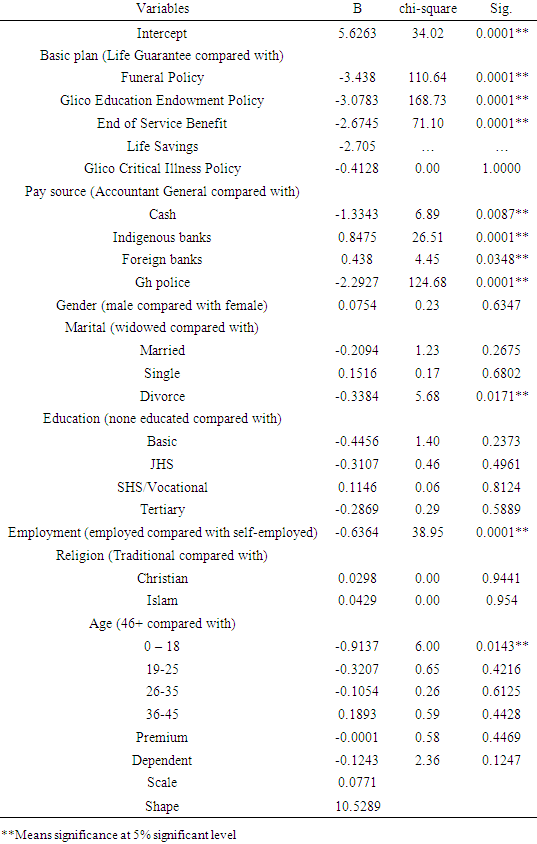
Table 9 displays the significance and estimates of the variables within the Gamma model. From the Gamma model, basic plan, age group, employment status, pay source and marital status have a significant effect on the time to surrendering a policy at 5% (p-value < 0.05) hence are significant determinants of the survival time whiles gender, educational status, religion, premium amount and number of dependents were insignificant (p-value > 0.05). Table 9. Analysis of Maximum Likelihood Parameter Estimates of the Gamma distribution
 |
| |
|
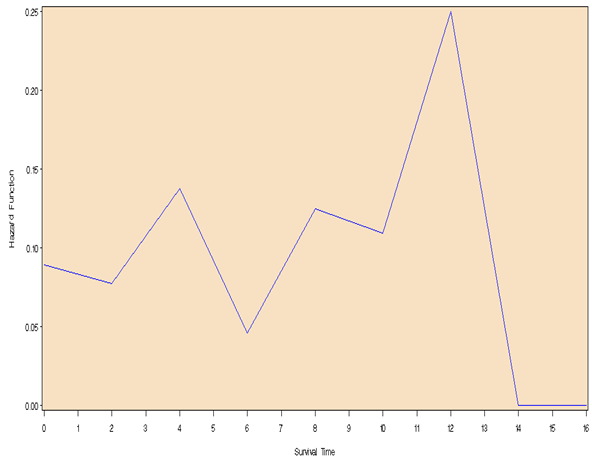
For the scale parameter β = 0.0771, means the hazard is increasing at an increasing rate, as evident in Fig 4. The shape parameter (α) controls the shape of the family of distributions, since α = 10.5289, it means the gamma distribution assumes a mounded (unimodal), that is the hazard increases from zero up to a maximum value, in Fig 5.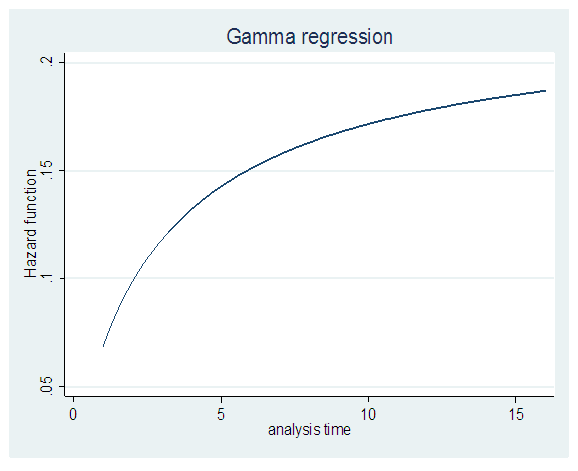 | Figure 4. Hazard Plot of the Gamma Model |
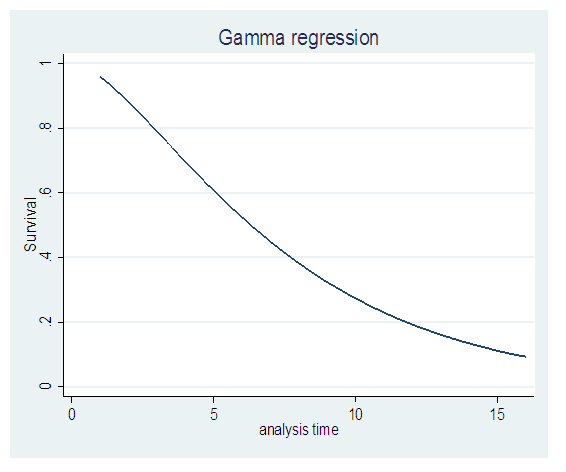 | Figure 5. Survival Plot of the Gamma Model |
3.3.3. Summary and Conclusion of Results
With respect to the survival probabilities in Table 3, it was observed that policy holders didn’t surrender in the first two months after picking up a policy, but the survival keeps on decreasing with time. This might be because most people just go in for insurance upon an insurance agent’s persuasion for the agent’s parochial interest in terms of commission without enlightening the prospective insured about the pros and cons of the contract. This is a prove of the findings by Life Insurance and Market Research Association (LIMRA, 2011) that large distribution by agents who mostly misconduct themselves, explains the low penetration of insurance. So, with time when they insured seeks clarification and finds out that the insurance terms and conditions is not to his or her advantage, then the only option left is to terminate the contract. It was observed that the Glico critical illness policy and life guarantee had their beter survival time. This might be because, in real life, individuals prioritize their health against all odds. Policy holders may sacrifice any other policy to attend to any other agenda but not their health, this supports the saying that your health is your wealth which is the consideration of insurance as a luxury rather than a basic need (Kaguma, 2011). This is evident that, amongst the basic plan type, the funeral policy had an abnormally high chance of surrender and a very low chance compared to the illness policy. It was shown that, a policy holder is exposed to an equal chance of surrendering a policy despite changes made in his or her premium amount. Taking into consideration the five basic plan types considered in this work, the life savings is the third rated to be exposed to the surrender risk, this is because saving through life insurance is sensitive to rates of return. In other words, when the policyholders can find other financial investment instruments which rate of return is higher than the credit rate of insurance policies, they would be more willing to surrender their insurance policies. The singles were less prone to a surrender in the marital category, this is evident in real life that the married have a lot responsibility which probably needs financial attention as an entire family (nuclear family). The single only have themselves to take care of and therefore don’t spend as much as the married so therefore it won’t trigger them to surrender their insurance policies.Out of the five parametric survival models that were fitted with the covariates in the accelerated failure time models, it was evident that the gamma distribution proved to be the best in determining the lapsation of an insurance policy. An investigation into the impact of the prognostic factors on the surrender time by the Gamma model evidenced at significance at 10% that, the significant prognosticators of surrender were employment status, age group, number of dependents, basic plan type and pay source of a policy holder. It is there recommended that, going forward, in other for the insurer to boost its credit, it should concentrate more on groups Insures should adjust their life savings policy to be able to compete with other saving options. Generally, this hypothesis can be examined by the sensitivity of surrender rates and the rates of return of alternative investment instruments, such as commercial papers and corporate bonds. The results of Hogan (1970), Dar and Dodds (1989) appear to support the interest rate hypothesis. This is highly recommended that the insured should have their premium sourced from banks, indigenous ones preferably, to have the least exposure of surrendering comparatively to physical cash and all other source stated in this work.The results argue that individuals will be more likely to lapse a life insurance policy when faced with economic hardship. The government should put measures in place to curb the economic hardship since it has a greater responsibility of the performance of the economy, since the economy affect the ability of the insured to cater for his or her dependents and finally on the insurance policy subscribed.For further studies, one should consider introducing new variables such as income, expenditure levels, number of policies held by the insured and increasing the period of the studied data set since this shall result in an advanced result.
References
| [1] | Albizzati M. O., Geman H. (1994): Interest rate risk management and valuation of the surrender option in life insurance policies. The Journal of Risk and Insurance. 61: 616–637. |
| [2] | Ballotta L. and Haberman S. (2006): The fair valuation problem of guaranteed annuity options: The stochastic mortality environment case. Insurance: Mathematics and Economics. Elsevier. 38(1): 195-214. |
| [3] | De Felice M., Moriconi F. (2002): Finanzadell' assicurazionesulla vita. Principi per l'assetliability management e per la misurazionedell' embedded value. Giornaledell’ Istituto Italianodegli Attuari, LXV - n. 1-2. Rome, Italy. |
| [4] | Ghana home page. (2017). Retrieved October 27, 2017, from Ghana Web: http://www.ghanaweb.com/GhanaHomePage/business/Economic-challenges-hit-life-insurers-474351. |
| [5] | Grosen A., Jørgensen P. L. (1997). Valuation of early exercisable interest rate guarantees. The Journal of Risk and Insurance. 64: 481–503. |
| [6] | Grosen A., Jørgensen P. L. (2000): Fair valuation of life insurance liabilities. The impact of interest rate guarantees, surrender options and bonus policies. Insurance: Mathematics & Economics. 26: 37–57. |
| [7] | Life Insurance Marketing and Research Association, (2011), Choices of distribution channels. Life insurance survey. |
| [8] | Olivieri A., Pitacco E. (2005). La valutazionenelleassicurazioni vita – Profiliattuariali, Egea, Milan, Italy. |
| [9] | Savelli N. (1993). Un modello di teoria del rischio, Collana ASA, Lint, Trieste. |

 Abstract
 Reference
 Full-Text PDF
 Full-text HTML