T. Odongo1, R. F. Isabirye2
1Department of Economics, Makerere University Business School, Kampala, Uganda
2Domestic Tax Department, Uganda Revenue Authority, Uganda
Correspondence to: T. Odongo, Department of Economics, Makerere University Business School, Kampala, Uganda.
| Email: |  |
Copyright © 2022 The Author(s). Published by Scientific & Academic Publishing.
This work is licensed under the Creative Commons Attribution International License (CC BY).
http://creativecommons.org/licenses/by/4.0/

Abstract
This study investigates the causal relationship between FDI inflows and Uganda’s tax revenue performance in the period between 1987 and 2019, using Granger Causality Test and VECM. The results from the Granger causality test in the study indicate that there is no causal relationship between FDI inflows and Uganda’s tax revenue performance. The VECM on the other hand, presents mix results. While FDI inflows promote increase in Uganda’s tax revenue in the short run, such performance however, is not observed in the long run. The policy implications for this study include: The FDIs coming into the country should be allowed to pay taxes as this would boost the tax revenue for the country. Secondly, other tax revenue sources should be sought by the country to boost the country’s Tax Revenue Base.
Keywords:
Foreign Direct Investment Inflows and Tax Revenue Performance
Cite this paper: T. Odongo, R. F. Isabirye, Causal Relationship between Foreign Direct Investment Inflows and Uganda’s Tax Revenue Performance, American Journal of Economics, Vol. 12 No. 3, 2022, pp. 49-56. doi: 10.5923/j.economics.20221203.01.
1. Background to the Study
Increasing tax revenue is a goal of all Less Developed Countries (LDCs) because it enables governments to meet their political mandates efficiently (Long andMiller, 2017). A lower ability to raise tax revenue means lower government revenues, and hence lower economic development (Ali and Audi, 2018). Thus, internationally, aid towards developing countries has been shaped to focus on improving their taxation capacity. However, tax revenue in LDC remains a challenge since LDCs have largely informal economies that cannot easily increase their tax base (Joshi, Prichard and Heady 2014). For instance, in Sub Saharan African countries alone, public sector budgets chronically fall short of funds limiting critical investment in human resource and capital infrastructure (Yohou and Goujon, 2017). The average tax revenue to GDP ratio in the region is only at 17 percent. This is below the potential rate of 23 percent recommended by both the World Bank and the International Monetary Fund (IMF). For Uganda’s case, the tax revenue performance is even lower and it is at 14 percent. This is also far less than the East African average rate of 15 percent. The country continues to implement a number of tax reforms geared towards increasing the tax revenue. Such reforms include granting of tax holidays to investors and wavering of a number of licensing fees among others to encourage Foreign Direct Investment (FDI) inflows and consequently boosting tax revenue in the country. Generally, the available empirical and theoretical evidences pronounce that FDI is a major determinant of tax revenue performance in developing countries because it boosts the local production and consequently the demand for goods and services (Van der Wielen 2020) and(Nnyanzi, Babyenda and Bbale 2016). The relationship between tax revenue performance and Uganda’s FDI inflows in the period between 2000 and 2020 can be presented as in figure 1 below. 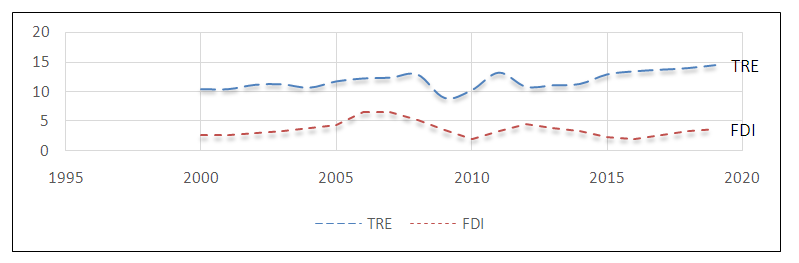 | Figure 1. Tax Revenue (TRE) performance and FDI inflows in to Uganda (2000 – 2019) (Source: World Bank Data) |
In 1991, Government of Uganda introduced major reforms in public finance in the country. These reforms culminated in to the introduction of Value Added Tax (VAT), introduction of Income Tax Act and restructuring of Uganda Revenue Authority (URA) to boost tax revenue collection in the country. Secondly, the government has also allowed the in inflows of Foreign Direct Investments (FDI) into the country to boost tax revenue collection efforts (Nnyanzi, Babyenda, and Bbale, 2016).Nevertheless, despite all the above well intended efforts to boost tax revenue in Uganda, tax revenue in the country remained low overtime. The tax body has consistently over the last three years registered revenue shortfall. For example, in 2018 alone, the country experienced a revenue shortfall of about 606.3 billion, while in 2019, there was another shortfall of about 3.5 trillion shillings. Secondly, tax revenue performance in Uganda has not only stagnated below the minimum desirable level of 15 percent, but it has also lagged behind the Sub Sahara African average (Oyinlola, Adedeji, Bolarinwa and Olabisi, 2020). The country has therefore not only failed to reach its optimal tax capacity but has also lagged behind in regional development since it has failed to mobilize enough local tax revenue. The low tax revenue performance could perhaps be attributed to the low level of FDI inflows into the country. This study therefore investigates the causal relationship between FDI inflows and Uganda’s tax revenue performance in the period between 1987 and 2019.
2. Methodology
2.1. Introduction
This section presents the methodology that has been adopted by this study. The methodology section comprises of the data type and sources, data estimation techniques and model specification. The details of the methodology adopted by this study are indicated below.
2.2. Data Type and Sources
Annual time series data have been used in the analyses in this study. The data type in this study is secondary. This includes data on FDI inflows, Uganda’s tax revenue performance and Uganda’s economic growth represented by GDP. This data covered the period between 1987 and 2019. The data sources are; Bank of Uganda, Uganda Bureau of Statistics, World Bank and Uganda Revenue Authority.
2.3. Data Estimation Technique
This study uses a time series data estimation technique. This include: Statistical tests which include Unit Root test and Cointegration test; Residual tests which include Normality test and ARCH test. It also includes Granger Causality test and Vector Error Correction Model. The details of the data estimation technique in this study are indicated below.
2.3.1. Statistical Test
The statistical test in the study includes stationarity test and cointegration test. The stationarity test has been carried out in this study using unit root test while cointegration test has been carried out in the study using Maximum Likelihood test. The details are indicated below.
2.3.1.1. Stationarity Test
The stationarity of each individual data series has been estimated in this study using Augmented Dickey Fuller (ADF) test and Phillips Perron test. A unit root null hypothesis has been tested against a stationary alternative. The stationarity test in the study uses regressions of a time series data analyzed against a constant. These regressions can be expressed as follows; | (1) |
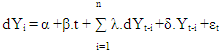 | (2) |
The stationarity of residuals (εt) has been tested. Lag length (p) of ADF (dYt-i) and Phillips Perron equations have been selected using Schwarz Information Criterion (SIC) and Bartlett Kernel respectively.
2.3.1.2. Cointegration Test
The procedure that has been adopted by this study to test for cointegrating relationship within endogenous variables is based on Maximum Likelihood (LM) test and unrestricted Vector Auto Regression (VAR) test. Cointegration rank r (number of cointegrating vectors) has been tested using trace statistics and Maximum Eigen Statistics (MES). The trace statistics test null hypothesis that there are at most r cointegrating vectors against alternative of r or more cointegrating vectors, while the MES test null hypothesis of r cointegrating vectors against alternative of r+1 cointegrating vectors.
2.3.2. Residual Tests
The residual tests in this study include normality test, Auto-Regressive Conditional Heteroskedasticity (ARCH) test and LM test for serial correlation. The details are indicated below.
2.3.2.1. Normality Test
The normality test has been carried out in this study to determine whether the data series estimated in the study are normally distributed or not. If the residuals are normally distributed, the histogram is bell-shaped and the Jarque-Bera statistic should not be significant. Following the normality test, this study proceeds to test for serial correlation using Autoregressive Conditional Heteroskedasticity (ARCH) test.
2.3.2.2. Autoregressive Conditional Heteroskedasticity (ARCH) Test
The ARCH test in this study uses Lagrange Multiplier (LM) test to test for serial correlation. This test determines whether there exists any serial correlation in the residual of the variables in the model specified.
2.4. Model Specification
The model in this study has been adopted from Amoh (2017). This is because such a model mirrors Uganda’s tax revenue environment. The main variables in this model include GDP as an indicator of the performance of Uganda’s economy. Other variables include Foreign Direct Investment inflow (FDI) and Tax revenue performance. The functional form of the model in the study is expressed below.  | (3) |
The model above can be expressed in econometric form as below.  | (4) |
Where; REV = Tax Revenue, FDI = Foreign Direct Investment inflows, GDP = Gross Domestic Product. α0 is the intercept for the model, α1 and α2 are the parametric estimates of independent variables while εt is the error term. The apriori expectations are such that; α1>0, α2> 0 and α3> 0.
2.4.1. Causal Relationship between FDI Inflows and Uganda’s Tax Revenue Performance
This section estimates the causal relationship between FDI inflows and Uganda’s Tax Revenue performance in the period under the review. The study uses Granger Causality test and Vector Error Correction Model (VECM) to estimate the causal relationship between FDI inflows and Uganda’s tax revenue performance in the period under the review.
2.4.1.1. Granger Causality Test
The Granger pair wise test has been carried out in this study to estimate the causal relationship between FDI inflows and Uganda’s tax revenue performance in the period between 1987 and 2019. The Granger causal relationship is said to exist if variable Xt helps to improve forecast of another variable, say Yt. The forecast of Yt can be denoted as Yt+h|Ώ for optimum h–step at origin t, based on set of all relevant information in the universe (Ώt). Xt is said to be Granger non-causal for Yt if and only if  | (5) |
Xt can be non-causal for Yt if removal of past information from Xt does not change optimal forecast horizon. In turn Xt Granger causes Yt if (5) does not hold for at least one h and therefore a better forecast of Yt can be obtained from some forecast horizon by including past information on Xt in the information set. The optimum lag length in the Granger causality test can be determined by information criteria.
3.4.1.2. Vector Error Correction Model (VECM)
The analysis of vector error correction model has been carried out in this study to determine whether there exist any short run or long run causal relationship within variables in the model specified. The presence of cointegrating relationship within endogenous variables is a necessary condition for estimating Vector Error Correction Model. The general form of the Vector Error Correction Model that has been estimated in this study is as follows;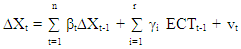 | (6) |
Where Xt is an nx1 matrix and n = 3 vectors of dependent variables, ∆Xt-1, β and γ are parameters, while Vt is a residual. Error correction mechanism is evidence in the Error Correction Term (ECTt-1). There are as many error correction terms as there are cointegrating vectors (r). Parameter γi associated with ECTt-1 measures proportion of adjustment back towards equilibrium that can be completed within a single period. If parameter γi is not significantly different from zero then there is no error correction process working within the model. Parameter βt on the other hand, indicates the presence of a short term lag from one variable to another and it measures short term adjustment back towards equilibrium.
3. Presentation and Discussion of the Results
3.1. Introduction
This section presents and discusses the results from this study to obtain conclusions from them. The results in this study are obtained from empirical analyses carried out in the study. The conclusions in the study provide the basis for obtaining policy implications for the study. The details are indicated below.
3.2. Statistical Tests
The statistical tests in this study include unit root test and cointegration test. The unit root test, tests for stationarity of residual in the model specified while cointegration test, tests for the long run relationship within the model specified. The details are indicated below.
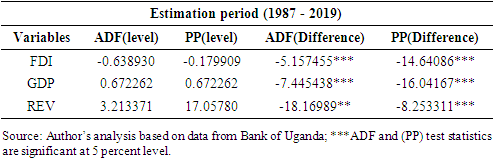
3.2.1. Test for Stationarity
The stationarity of residuals in this study has been estimated using Augmented Dickey-Fuller (ADF) test and Phillips Perron test. The summary statistics in table 1 present the ADF and the Phillips Perron statistics for the variables estimated. The results in this table indicate that all variables are stationary at first difference. Table 1. Stationarity Test Results
 |
| |
|
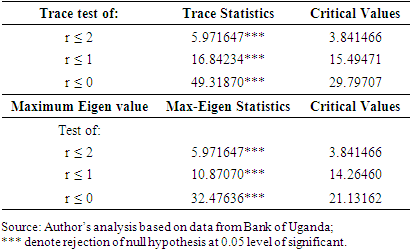
3.2.2. Test for Cointegration
Cointegration test has been carried out in this study to determine if there exists any long run relationship within variables in the model specified. The results for the cointegration test carried out in the study are presented in table 2.Table 2. Cointegration Test Results
 |
| |
|
The results from Unrestricted Trace Statistics (UTS) indicate three cointegrating vectors at 0.05 percent level of significance; while the results from Maximum Eigen Statistics (MES) also indicate three cointagrating vectors at 0.05 percent level of significance. Thus; there exists long run relationship within variables in the model specified. This study can thus proceed to estimate Vector Error Correction Model (VECM) and Granger causality test.
3.3. Residual Tests
Residual tests carried out in this study include; Normality test, test for Serial Correlation and Heteroskedasticity test. The normality test has been carried out in this study using histogram. The test for serial correlation has been carried out using LM serial correlation test while Heteroskedasticity test has been carried out in the study using Breusch-Pagan-Godfrey test. The details are indicated below.
3.3.1. Normality Test
The normality test has been carried out in this study to determine whether the data series estimated in the study are normally distributed or not. The result in the figure below displays a histogram and descriptive statistics of the residuals including Jarque-Bera statistic that test for normality. If the residuals are normally distributed, the histogram should be belled shaped and the Jarque-Bera statistic should not be significant. 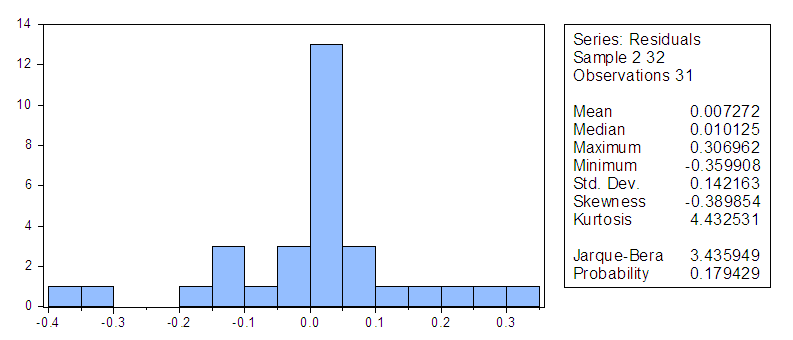 | Figure 2. Normality Test |
The reported probability in the table below indicates that the Jarque-Bera statistic exceeds the value under the null hypothesis. The study therefore does not reject the null hypothesis of a normal distribution.
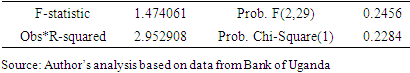
3.3.2. Lagrangean Multiplier (LM) Test for Serial Correlation
Following the normality test the study proceeds to test for serial correlation using Breusch-Godfrey LM test. The Lagrangean Multiplier test is used to test for the presence of serial correlation under the null hypothesis of no serial correlation. The LM statistic is computed as the number of observations, times the (un-centered) R-squared from the test regression. Under quite general conditions, the LM test statistic is asymptotically distributed as a chi-square (p). The result for the LM test in this study is indicated below.Table 3. Breusch-Godfrey LM Test for Serial Correlation
 |
| |
|
Using the Lagrangean multiplier (LM) = n*R-squared =31.94696 under the null hypothesis of no serial correlation, the probability of rejecting the null hypothesis is 0.2767. Thus we do not reject the null hypothesis of no serial correlation.
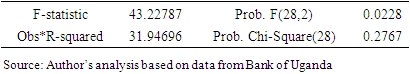
3.3.3. Autoregressive Conditional Heteroskedasticity (ARCH) Test
This is a Lagrange multiplier (LM) test for Auto-Regressive Conditional Heteroskedasticity (ARCH) in the residuals. This particular test has been motivated by the observation in many time series data in which the magnitude of residuals appear to be related to the magnitude of the recent residuals. ARCH in itself does not invalidate Standard Least Square (SLS) inference. However, ignoring the ARCH effect may result in loss of efficiency. The ARCH LM test statistic is computed from an auxiliary test regression. In ARCH test, the study tests the null hypothesis that there is no ARCH up to order q in the residuals. The result for LM test in this study is indicated below.Table 4. ARCH Test for Heteroskedasticity
 |
| |
|
The LM statistic in ARCH test above is equal to n*R-squared which is 2.952908. Under the null hypothesis of no ARCH up to order 1 in the residuals, the probability of rejecting Ho is 0.2284. At 5 percent level of significance the study does not reject the null hypothesis of no ARCH.
3.4. Causality Analysis
The causality analyses carried out in this study use both Granger Causality test and VECM to estimate the causal relationship between FDI inflows and Uganda’s tax revenue performance in the period under the review. The details are indicated below.
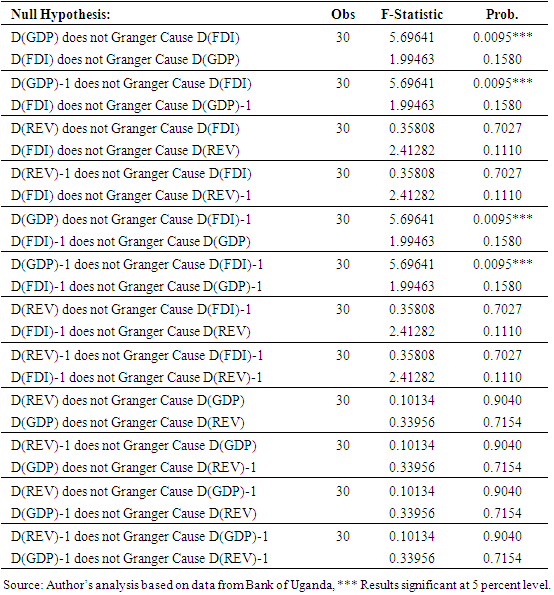
3.4.1. Granger Pair Wise Test
This test indicates the pair wise relationship between variables in the model specified. It indicates whether FDI inflows do cause growth in Uganda’s tax revenue or growth in Uganda’s tax revenue can be explained by other variables estimated in the study. The results for Granger pair wise relationships in this study are indicated below. The results from Granger causal relationship in this study indicate that there are causal relationships between FDI inflows and Uganda’s economic growth (GDP) both in the current period and also in the recent past. Nevertheless, the results from the same Granger causal relationship in the study indicate that there is no causal relationship between FDI inflows and Uganda’s tax revenue performance in the period under the review. This result is possible perhaps because of tax holiday that are often awarded to foreign investors coming into Uganda in the period under the review.Table 5. Granger Pair wise Test Results with Two Lags
 |
| |
|
The study further proceeds to estimate the Vector Error Correction Model (VCEM) to determine whether there is any short run or long run causal relationship between FDI inflows and Uganda’s tax revenue performance in the period under the review. The details are indicated below.
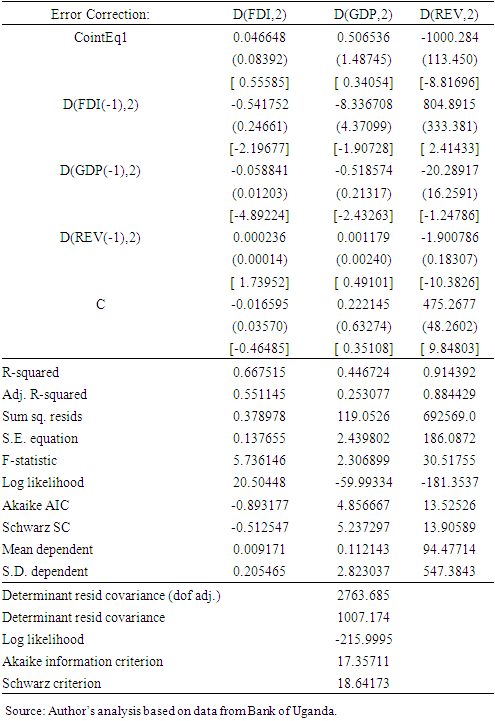
3.4.2. Estimates of Vector Error Correction Model (VECM)
The second part of the causality analysis carried out in this study estimates the causal relationship between FDI inflows and Uganda’s tax revenue performance in the period under the review using VECM. This study uses VECM because it helps to determine whether there exists any short run or long run causal relationships between FDI inflows and Uganda’s tax revenue performance in the period under the review.The presence of cointegrating vectors in the model specified implies that there exists long run error correction process working within the model such that any deviation from the long run equilibrium path would be restored by correction of equilibrium error back towards its long run relationship. The VECM results in this study are presented in the table below.Table 6. Vector Error Correction Estimates
 |
| |
|
The results in this table indicate the estimated parameters in each of the three versions of the VECM equations that are drawn from each column. The first row contains Error Correction Term (ECT) for each equation. The estimated parameters on ECT are presented in the first row and their standard errors are presented in the second row, while t ratios are presented in the third row.The results for the long run relationship in the VECM estimates indicate that when FDI inflows increase by 1 percent economic growth increases by 50.6 percent. Secondly, in the long run, when FDI inflows increase by 1 percent, Tax revenue reduces by 1000 percent. Following the results for the long run relationship in the VECM estimates indicated in this study, it is therefore clear that FDI inflows do not promote increase in Uganda’s tax revenue performance in the period under the review. This result is perhaps because of the tax holidays that are often awarded to foreign investors coming into the country. The details of the results in the long run relationships in this study are summarized in the equation below | (7) |
The results for the short run relationship in the VECM estimates indicate that 1percent increase in FDI inflows into the country reduces economic growth by 5.8 percent, 1 percent increase in FDI inflows increases tax revenue by 0.24 percent. The details of the results for the short run relationships in this study are presented below. | (8) |
Following the results for the short run relationship in the VECM estimates in this study, it is therefore clear that there exist positive and significant relationship between FDI inflows and Uganda’s tax revenue performance in the period under the review. This result is perhaps because the short run period is so short that not many FDIs will have entered the country to receive the tax holiday that are often awarded to the FDIs coming into the country and thereby reducing the available tax revenue for the country.
4. Conclusions and Policy Implications
4.1. Conclusions
The results from Granger causal relationship in this study indicate that there are causal relationships between FDI inflows and Uganda’s economic growth both in the current period and also in the recent past. Nevertheless, the results from the same Granger causal relationship in the study also indicate that there is no causal relationship between FDI inflows and Uganda’s tax revenue performance in the period under the review.The results for the long run relationship in the VECM estimates indicate that when FDI inflows increase by 1 percent economic growth increases by 50.6 percent. Secondly, in the long run, when FDI inflows increase by 1 percent, Tax revenue reduces by 1000 percent. Following the results for the long run relationship in the VECM estimates indicated in this study, it is therefore clear that FDI inflows do not promote increase in Uganda’s tax revenue. This result is perhaps because of tax holidays that are often awarded to foreign investors coming into the country.The results for the short run relationship in the VECM estimates indicate that 1percent increase in FDI inflows into the country reduces economic growth by 5.8 percent and 1 percent increase in FDI inflows increases tax revenue by 0.24 percent. Following the results for the short run relationship in the VECM estimates in this study, it is therefore clear that there exist positive and significant relationship between FDI inflows and Uganda’s tax revenue performance in the period under the review. This result is perhaps because the short run period is so short that not many FDIs will have entered the country to receive the tax holiday that are often awarded to them and thereby reducing the available tax revenue for the country.
4.2. Policy Implication for the Study
The policy implications for this study include the followings;The FDIs coming into the country should be allowed to pay taxes as this would boost the tax revenue performance for the country. Exempting the FDIs from tax liability is detrimental to the tax revenue as it narrows the tax base for the country.Secondly, other sources of tax revenue should be sought for the country. This is because over reliance on the current source of tax revenue may not increase the country’s revenue base.
References
| [1] | Ali, A., and Audi, M. (2018). Macroeconomic environment and taxes revenues in Pakistan: an application of ARDL approach. |
| [2] | Amoh, J. (2017). The determinants of tax revenue growth of an emerging economy - the case of Ghana. Economics and Accounting, Vol. 8, 337. |
| [3] | Joshi, A., Prichard, W., and Heady, C. (2014). Taxing the Informal Economy: The Current State of Knowledge and Agendas for Future Research. The Journal of Development Studies, 50(10), 1325-1347. doi: 10.1080/00220388.2014.940910. |
| [4] | Long, C., and Miller, M. (2017). Taxation and the Sustainable Development Goals. Do good things come to those who tax more. |
| [5] | Nnyanzi, J. B., Babyenda, P., and Bbale, J. M. (2016). Regional economic integration and tax revenue: East African community. Journal of Economic Integration, 932-967. |
| [6] | Oyinlola, M. A., Adedeji, A. A., Bolarinwa, M. O., and Olabisi, N. (2020). Governance, domestic resource mobilization, and inclusive growth in sub-Saharan Africa. Economic Analysis and Policy, 65, 68-88. |
| [7] | Van der Wielen, W. (2020). The macroeconomic effects of tax changes: Evidence using real-time data for the European Union. Economic Modelling, 90, 302-321. |
| [8] | Yohou, H. D., and Goujon, M. (2017). Reassessing tax effort in developing countries: a proposal of a vulnerability-adjusted tax effort index (VATEI). Development, pp.186. |

 Abstract
 Reference
 Full-Text PDF
 Full-text HTML