-
Paper Information
- Paper Submission
-
Journal Information
- About This Journal
- Editorial Board
- Current Issue
- Archive
- Author Guidelines
- Contact Us
American Journal of Economics
p-ISSN: 2166-4951 e-ISSN: 2166-496X
2022; 12(1): 6-19
doi:10.5923/j.economics.20221201.02
Received: Feb. 11, 2022; Accepted: Feb. 28, 2022; Published: Mar. 15, 2022

Demographic Transition, Human Capital Dynamics and Economic Growth: An Application of the LSDVC Approach in ECOWAS
 Abstract
 Reference
 Full-Text PDF
 Full-text HTML
Kifory Ouattara, Kidou J. C. Amenssin
Alassane Ouattara University, Ivory Coast
Correspondence to: Kifory Ouattara, Alassane Ouattara University, Ivory Coast.
| Email: |  |
Copyright © 2022 The Author(s). Published by Scientific & Academic Publishing.
This work is licensed under the Creative Commons Attribution International License (CC BY).
http://creativecommons.org/licenses/by/4.0/

This paper examines the effect of demographic transition with human capital dynamics on economic growth over the period from 1990 to 2020. We perform a bias corrected least square dummy variable (LSDVC) approach developed by Bruno (2005) for short dynamic panels with fixed effects and extended to accommodate unbalanced data. The empirical results reveal that demographic transition and human capital play an important role on economic growth. Working-age population, population growth rate and youth dependency ratio influence positively economic growth. As for human capital and its variation over time, findings reveal a positive contribution on economic growth as well as the lagged value of human capital in order to take into account the previous qualifications accumulation. The study provides implications for Policymakers to invest in people training in order to grow and accumulate working-age population qualifications and to create a dynamic labor market to insert youth people moving in working-age.
Keywords: Demographic transition, Human capital, Economic growth, Dynamic panel data, Bias corrected least square dummy variable (LSDVC) estimator
Cite this paper: Kifory Ouattara, Kidou J. C. Amenssin, Demographic Transition, Human Capital Dynamics and Economic Growth: An Application of the LSDVC Approach in ECOWAS, American Journal of Economics, Vol. 12 No. 1, 2022, pp. 6-19. doi: 10.5923/j.economics.20221201.02.
Article Outline
1. Introduction
- This article revisits the debate on the effect of population structure on economic growth. Since many decades, the population structure and demographic dividend became important factors in developing countries economic growth (see Zhu and Zhong, 2017; Cai and Lu, 2013). The debate was conducted by population optimists defending that fast population growth promotes technological and institutional innovation (see Boserup, 1981, Kuznets, 1967), population pessimists who contend that a high population growth is impoverishment (see Coale and Hoover, 1958; Ehrlich, 1968) and the population neutralist (see Bloom and Freeman, 1986; Kelly, 1988) for who, population growth has no positive or negative effects on economic growth.In the last two decades, the population growth has been decomposed into its fertility and mortality components and examined for their independent effects on economic growth (see Bloom and Williamson, 1998). The downward trend in mortality signal the beginning of all demographic transitions and changes in the age structure are observed. The demographic transition refers to the transition of a region or country from high death and birth rates to lower death and birth rates as the region or country develops from a pre-industrial to an industrialized economy.That demographic transition theory was firstly developed by Landry in the 1990s and Thompson in the 1930s. The demographic transition is divided into three stages (Figure 1). The first or preliminary stage is characterized by high birth rate, high death rate and low natural growth rate; the second is the transitory stage in which a decrease in death rate is followed by a decrease in birth rate and the natural population growth rate falls before a short-term rise. The third correspond to the modernization stage with low death rate, low birth rate and low natural growth rate (see Yuan and Gao, 2020). According to Bloom and Williamson (1998), the demographic transition might have separate influences on economic growth for reasons cited by population pessimists or optimists. Moreover, like previous works, other authors will focus their reflections on the repercussions of the demographic change on human capital (see Becker and al. 1990; Mankiw and al. 1992; Jones 2002). Indeed, a constant rate of investment in human capital leads to an increase in human capital per worker if labor force growth slows (Lee and Mason, 2010). According to Fry and Mason (1982); Bloom and al., (2003), the presence of children increases the consumption requirements of young families, so that high rates of youth dependency can depress saving and lower the impact on economic growth. In general, national savings are higher when dependency rates are low and economic growth is rapid (see Higgins, 1998; Leff, 1969).
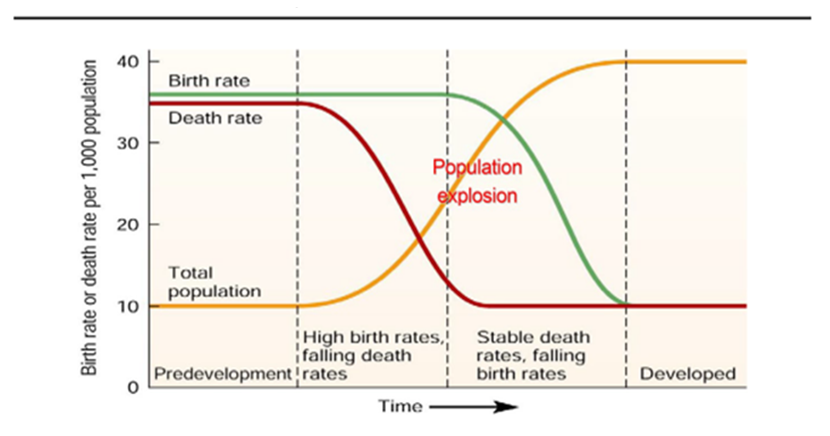 | Figure 1. Classic model of demographic transition (Yuan and Gao, 2020) |
2. Methodology
- This section presents the theoretical and empirical model binding age structure variables with human capital and economic growth using an augmented neoclassical growth framework.
2.1. Theoretical Economic Modeling
- The standard neoclassical growth models neglect the influence of demographic transition and assumed constant labor force participation and stable population growth. But, the importance of age-structural transition for economic growth became popular since nineties of last century. The pioneer’s studies in this field are Freedman and Bloom (1988), Higgins and Williamson (1997), Bloom and al. (2001) and Kelly and Schmidt (2005). For this, we use the augmented conditional convergence growth model by incorporating the variables of demographic transition unlike the standard neoclassical model. We then take the aggregate production function including human capital as a factor input to derive unified conditional convergence model augmented for demographic and human capital variables (see Mankiw and al., 1992; Hall and Jones, 1999; Benhabib and Spiegel, 2002; Ahmad and Khan, 2018):
 | (1) |
 is the GDP,
  represent the Total Factor Productivity,
  is the physical capital stock and
  is the total labor input.
  where
where  is the human capital per worker that is defined by
  while
while  refers to schooling and
  is average years of schooling of labor force used as proxy for human capital. To transform the expression (1) into per-worker form, we divide it by
  . Hence, we obtain the expression (2) in per-worker form:
 | (2) |
 | (3) |
 is the GDP per-worker and
  is the physical capital per-worker. The conversion of GDP per-worker to GDP per-capita given by:
 | (4) |
 is the output per-capita and
  is the total population. Substituting Eq. (4) in Eq. (3) yields:
 | (5) |
 | (6) |
 is the trend parameter and
  is the coefficient of initial GDP per-worker. Substituting Eq. (6) in Eq. (5) yields:
 | (7) |
 | (8) |
 the working-age population:
 | (9) |
 | (10) |
 | (11) |
 | (12) |
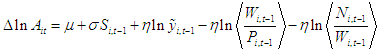
 represent the growth rate of GDP per-capita,
  is the lagged working-age population share of total population,
  is the lagged labor force participation ratio,
  denotes the growth rate of physical capital per-worker,
  reflects the growth rate of total labor force,
  is the growth rate of total population,
  shows the lagged level of human capital while
  is the change in human capital and
  is the log of lagged dependent variable used as regressor to represent convergence of the model we use the Least Squares Dummy Variable (LSDV) bias corrected. In the first case, the coefficient of
  should be negative (< 0) and statistically significant to ensure the conditional convergence of the model. Lagged variables other than the lagged dependent variable are instruments for the first differenced explanatory variables and level variable for the explained variable used to tackle the endogeneity problem. When
  and
and  when the net demographic effects are no more and the population is stable. When the population, in this study, is unstable during a dynamic transition so we can relax this theoretical restriction and consequently their coefficients would be different from unity.
2.2. Econometric Model Specifications and Method
- Based on the theoretical models, the econometric models for economic growth can be estimated as:
 | (13) |
 is the GDP per-capita growth rate,
  is the log of lagged value of GDP per-capita level,
  represents the log of lagged value of working-age population ratio,
  shows the log of lagged value of labor force participation ratio used as instrument. In addition,
  denotes the growth rate of capital stock,
  is growth rate of total labor force,
  shows the growth rate of total population and
  is the difference of observation specific error term left after the removal of fixed effects error.
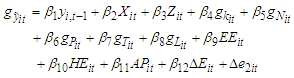 | (14) |
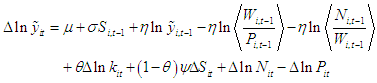
 which shows the growth rate of trade openness,
  representing the growth rate of life expectancy,
  represents education expenditures,
  denotes health expenditures,
  represents agriculture productivity and
  denoting the difference of human Capital. Similarly,
  is the difference of error term excluding country specific fixed effects as in case of model (13).
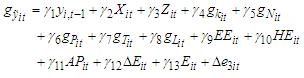 | (15) |
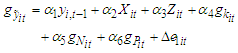
 which represents the lagged value of level of human capital.
  is similar than that explained earlier.
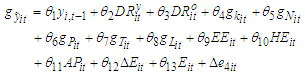 | (16) |
 which is log of lagged value of youth dependency ratio (ratio of population in the age bracket of below 15 years to population in the age bracket of between 15 and 65 years) and
  which denotes the log of lagged value of old dependency ratio (ratio of population in the age bracket of above 65 years to the population in the age bracket of 15-65 years). The remaining model is the same as model (13).
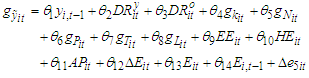 | (17) |
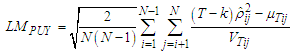
 which represents the lag of human capital variable in its level form. The lag term of human capital is included in the model because human capital accumulation may be important for economic growth.To analyze the influence of demographic and economic variables on economic growth, we then use the bias corrected least square dummy variable method.Tests and methodIn this sub-section, we present some preliminary tests namely the cross section dependence, the second generation unit root tests and the LSDVC estimator.Cross section dependence testsTo examine the cross-sectional dependence, we consider the sample estimate of the pair-wise correlation of the residuals,
 | (18) |
 | (19) |
 is the pair-wise correlation coefficient of the residuals. For
  fixed and
  , Breusch and Pagan (1980) proposed an LM test to test the null of no cross-sectional correlation in (19) without imposing any structure on this correlation. It is given by,
 | (20) |
 is asymptotically distributed as a Chi-squared distribution with
  degrees of freedom under the null. However, for a micro-panel dataset,
  is larger than
  , Breusch-Pagan LM test statistic is not valid under this large
 , small
  setup. Pesaran (2004) proposed a scaled version of this LM test as follows,
 | (21) |
 is distributed as
  with
with  first, then
  under the null hypothesis. However,
  is not correctly centered at zero with fixed
  and large
  . Hence, Pesaran and al. (2008) propose a bias adjusted version of this LM test, denoted by
  ,
, | (22) |
 and
and  depends on
  . Pesaran and al. (2008) show that
  is asymptotically distributed as under the null (22) and the normality assumption of the disturbances as
  followed by
  (see Baltagi and al., 2016). Pesaran (2004) proposes a test based on the average of pair-wise correlation coefficients rather than their squares and the test statistic is given by,
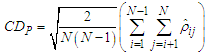 | (23) |
 and
and  . As
. As  in any order,
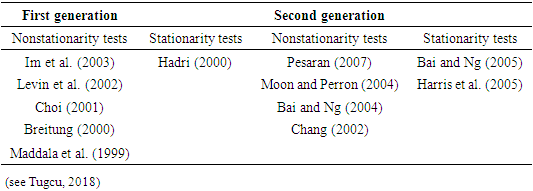
  tends approximately to a standardized normal.Unit roots testsFor panel unit root-testing there are two generation of tests. The first generation assumes that cross-section units are cross-sectionally independent while the second generation of panel unit root tests relaxes this assumption and allow for cross-sectional dependence. Table 1 summarize the first and second generation panel unit root tests generally used (Tugcu, 2018).
|
 | (24) |
 for all
  , whereas now the alternative hypothesis is given as
  | (25) |
 from the individual ADF regressions
  :
: | (26) |
 followed by
  converges to
  | (27) |
 and
and  , have been computed by IPS via simulation for various values of
  and
and  .The Maddala and Wu (1999) panel unit root test is inspired in a Fisher type test that combines P-values from unit root tests for each cross-section
  .The Maddala and Wu (MW) unit root test is defined as
 | (28) |
 being distributed as
  with
with  degrees of freedom as
  for all
  .Least Square dummy variable (LSDV)We apply Bruno’s (2005) bias-corrected least-square dummy variable estimator, developed for short dynamic panels with fixed effects, and extended to accommodate unbalanced data. When we consider the nature of dataset, this seems to be a solid choice.A strategy to correct for the fixed effects is to draw them out of the error term by entering dummies for each individual-the so called least-square dummy variables (LSDV) estimator. Since pioneer paper by Nickell (1981), where he shows that the LSDV estimator is not consistent for finite
  in autoregressive panel-data models, a number of consistent instrumental variable (IV) and generalized method of moments (GMM) estimators have been proposed in the econometric literature as an alternative to LSDV. Anderson and Hsiao (1982); Arellano-Bond (1991); Blundell-Bond (1998) suggest IV-GMM estimators. Then Kiviet (1995) use asymptotic expansion techniques to approximate the small sample bias of the LSDV estimator to also include terms of at most order
  , so offering a method to correct the LSDV estimator for samples where
  is small or only moderately large.Bun and Kiviet (2003) analyze the accuracy of Kiviet’s (1998) approximation using simpler formulas. Judson and Owen (1999), using a Monte Carlo simulation show that the corrected LSDV estimator (LSDVC) is strongly supports compared to more traditional GMM estimator when
  is only moderately large. However, the LSDVC for an unbalanced panel has not yet been implemented.We present here the LSDVC estimator building upon the theoretical estimation formulas in Bruno (2005) and estimates a bootstrap variance covariance matrix for the corrected estimator.Consider the standard autoregressive panel data model (see Stojkov and Warin, 2016; Bruno, 2005):
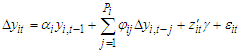
 | (29) |
 is the dependent variable;
  is the
  vector of strictly exogenous explanatory variable;
  is an unobserved individual effect and
  is an unobserved white noise disturbance.Collecting observations over time and across individuals gives
 | (30) |
 is the
  vector of observations for the dependent variable;
  is the
  matrix of individual dummies, with
  being the
  vector of all unity elements;
  is the
  vector of individual effects;
  is the
  matrix of explanatory variables;
  is
is  lagged one time;
  is the
  matrix of strictly exogenous explanatory variables;
  is the
  vector of white noise disturbances;
  is the
  vector of coefficients.Finally, with an increasing level of accuracy, the following three possible bias approximations emerge:
 | (31) |
 and
and  approximations (31) are not feasible for bias correction. Nevertheless, consistent estimators for
  and
and  plugging them into the bias-approximations formulas, and the subtracting the resulting bias approximation estimates,
  from LSDV as follows:
 | (32) |
 are
are  for example. Depending on the estimator of choice for
  , say
, say  , a consistent estimator for
  is then given by:
 | (33) |
 and
and  .To analyze the influence of demographic and economic variables on economic growth, we then use the bias corrected least square dummy variable method.
2.3. Variable Construction and Data
- Following Ahmad and Khan (2018) and regarding the theoretical and econometric modeling, the variable of GDP per-capita growth rate is used as a proxy for economic growth, gross capital formation as a proxy capital stock, total labor force, working-age population, total population, labor force participation ratio, life expectancy, education expenditures, health expenditures, female labor force participation rat, agriculture productivity and trade openness. Others variables could be adding but we cannot take all of them. In order to quantify the effect on human capital on economic performance, the empirical literature use different measures of human capital. These are most frequently the mean years of schooling (see Barro and Lee, 1996; Basu et al., 2013), literacy rate (see Benhabib and Spiegel, 1994), school enrolment rate (see Mankiw and al., 1992). The empirical literature shows that the quality of human capital should be taken into consideration (see Jones and Schneider, 2006). For that, two adjustments have been made (see Ahmad and Khan, 2018) in total mean years of schooling of population in 15 plus years’ age group. Firstly, the non-working people and unemployed labor have been excluded from the data:
 = mean years of schooling
  labor force
  labor force participation rateSecondly, human capital variable is used in three forms, i.e., level form, difference form and lagged form. The age-structure dynamics is represented by the ratio of working-age population to total population. The data of working-age population and total population has been transformed into working-age population ratio like this:Working-age population ratio
  = Working-age population/ Total population.Variables have been taken from World Development Indicators (WDI). We use annual data from 1990 to 2020 considering 15 Economic Community West African States (ECOWAS) countries which are: Benin, Burkina Faso, Capo-Verde, Côte d’Ivoire, Gambia, Ghana, Guinea, Guinea-Bissau, Liberia, Mali, Niger, Nigeria, Senegal, Sierra Leone, Togo. The variables of education expenditures (EE) and health expenditures (HE) are the public expenditures in education and health sectors in percentage of GDP form. The agriculture productivity (AP) is taken in the form of agriculture value added percentage of GDP. Finally, the data of openness (trade, percent of GDP) was also collected from WDI.
3. Empirical Results and Discussion
- This section presents the summary analysis, the cross-sectional dependence and unit root tests and then the estimation results and discussions.
3.1. Summary Analysis
- Table 2 reports the descriptive statistics for all variables used in the panel regressions. The mean value GDP per-capita growth rate is 1.325, which is between -29.461 and 21.027 with a standard deviation of 4.468. This mean value suggests that in ECOWAS, the GDP per capita growth rate is 1.325 annually. The average of human capital is 23.469, with a variability of 1.351, ranges between 20.637 and 26.477. The change in human capital has mean score of 0.033, which as minimum and maximum values of -0.527 and 0.340 respectively and variability of 0.07. The growth rate of gross capital formation has mean value of 19.862 and variation of 9.104, which ranges between -0.527 and 0.340. The growth rate of labor force has mean value of 7.964 and a standard deviation of 96.338, which is between -98.524 and 18.426. On average, the labor force participation ration, the population growth rate, the working-age population ration, the trade openness have mean values of 4.186, 8.456, 11.373, 4.022 respectively and standard deviation of 0.124, 103.250, 1.348, 0.336 respectively. In the end, life expectancy, education expenditures, health expenditures, youth dependency ratio and agriculture productivity have mean values of 0.001, 3.066, 1.809, 4.429 and 7.178 respectively with standard deviation of 0.029, 0.436, 0.472, 0.141 and 0.628 respectively.
|
 | Table 3. Correlation matrix analysis |
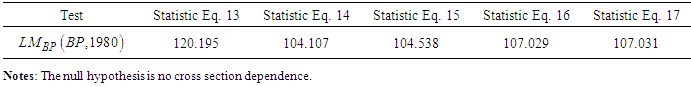
3.2. Cross Section Dependence Test
- We first test for the cross-section dependence using Breusch-Pagan (1980) test because
 . Table 4 shows statistics for cross-section independence in residuals of a fixed effect regression model under the null hypothesis of cross-section independence. The test use the residuals obtained from Eq. (13), Eq. (14), Eq. (15), Eq. (16) and Eq. (17). Results could not reject the null hypothesis of cross section independence. Thus, the absence of cross-section dependence (CD) makes the standard panel unit root tests appropriate.
|
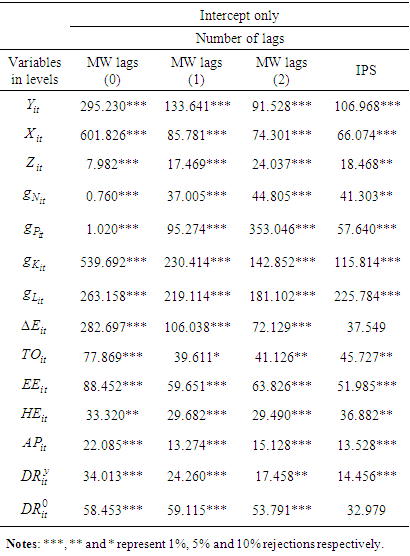
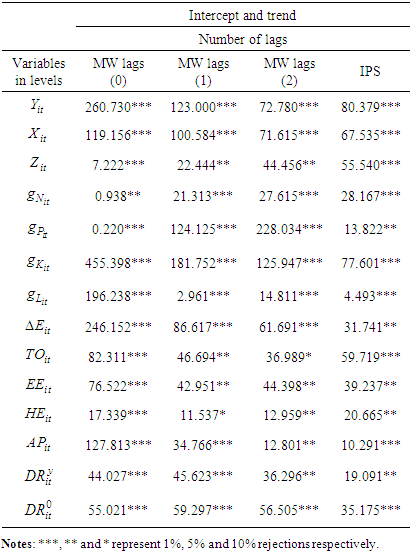
3.3. Unit Root Tests
- In table 5 and 6, we report the results of Maddala and Wu (1999) panel unit root test without trend and with trend at lag orders
 . These lags allow us to control for possible serial correlation in data. The results reveals that GDP per-capita growth rate, working age population ratio, labor force participation ratio, growth rate of total labor force, growth rate of population, growth rate of capital stock, growth rate of life expectancy, trade openness, education expenditures, health expenditures, agriculture productivity, difference of human capital, youth dependency ration and old dependency ratio are non-stationary at levels and stationary at first difference as well as without trend and with intercept and linear trend (generally with lags 0 and 1).
|
|
3.4. Empirical Linear Regression Analysis
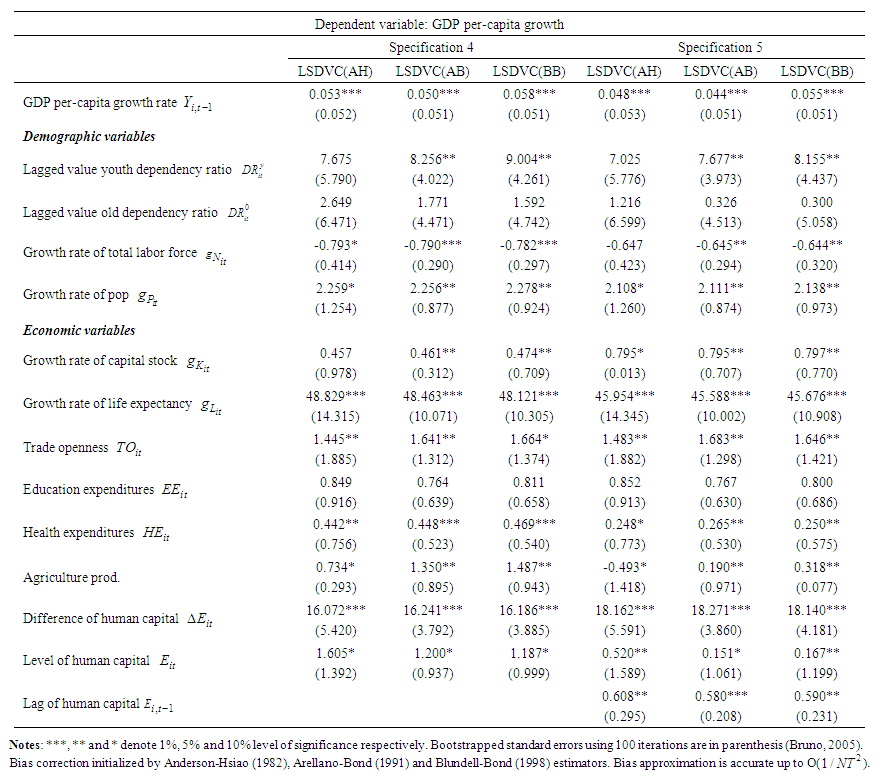
- One of efficient method to estimate the impact of demographic transition and human capital on economic growth is the panel data estimation. The use of panel data estimation provides several advantages: better estimates with large sample size, control for unobservable and immeasurable variables, control for individual heterogeneity and it tackles address the omitted variable bias problem (Ahmad and Khan, 2018). In this work, we apply LSDVC (AH), LSDVC (AB) and LSDVC (BB) estimates. Tables 7 shows results of the linear regression between economic growth, demographic transition and human capital variables through three differents specifications: the first specification displays empirical results of the baseline regression in columns 1, 2 and 3 (Eq. 13) and the second reported in columns 4, 5 and 6 (Eq. 14) and the third in columns 7, 8 and 9. We replicated 100 repetitions using a bootstrap procedure to produce the estimated standard errors. Furthermore, in order to save space, we will only interpret LSDVC (BB) results.
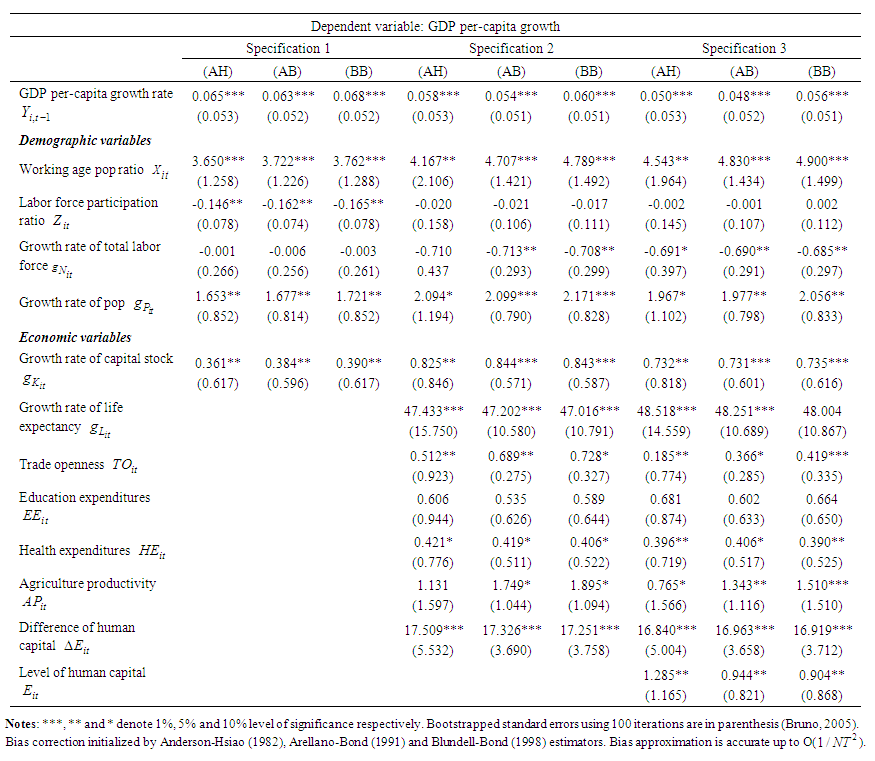 | Table 7. Influence of demographic transition and human capital on economic growth (Eq.13-14-15) using LSDVC |
 | Table 8. Influence of demographic transition and human capital on economic growth (Eq.16-17) |
4. Conclusions
- The aim of this paper is to analyze the influence of demographic transition and change in human capital on economic growth in ECOWAS countries using annual data covering the period from 1990 to 2020. The neoclassical growth model augmented for demographic and human capital dynamics have been used to estimate empirically these variables influence on economic growth. to analyze the dynamic panel data, the Bruno’s (2005) bias-corrected least-square dummy variable estimator is used with three alternative initial estimators: Anderson-Hsiao, Arellano-Bond and Blundell-Bond.As it can be seen, the working-age population ratio and population growth rate have a positive influence on economic growth for all specifications at different magnitudes. The negative and significant value of labor force participation ratio in model specification 1 become insignificant in model specifications 2 and 3 while the growth rate of total labor force insignificant in model specification 1 become significant and contributing negatively to economic growth in specifications 2 and 3. According to dependency ratios, the lagged value of youth dependency ratio leads to a positive effect on economic growth and the lagged value of old dependency ratio is insignificant.The economic variables (growth rate of capital stock, growth rate of life expectancy, trade openness, education expenditures, health expenditures agriculture productivity) used as control variables exercise positive and statistically significant effect on economic growth except for education expenditures variable which is insignificant.For human capital, the results show that the change in human capital, the human capital in level form and the lagged value of human capital have a positive and significant effect on economic growth. Finally, the coefficient of lagged value of GDP per-capita is non-negative. For this purpose, the conditional convergence hypothesis is rejected for each specification. The human capital dynamic and demographic transition have an important role on economic growth. Policy makers should create a dynamic labor market to insert youth people who will have working-age. Other policy is to invest in formation in order to grow and accumulate working-age population qualifications.