-
Paper Information
- Paper Submission
-
Journal Information
- About This Journal
- Editorial Board
- Current Issue
- Archive
- Author Guidelines
- Contact Us
American Journal of Economics
p-ISSN: 2166-4951 e-ISSN: 2166-496X
2021; 11(3): 95-105
doi:10.5923/j.economics.20211103.03
Received: Aug. 18, 2021; Accepted: Sep. 3, 2021; Published: Sep. 15, 2021

COVID-19 and Inequality: A Systematic Review and Policy Options
 Abstract
 Reference
 Full-Text PDF
 Full-text HTML
Adeniyi Foluso Opeyemi
The Chartered Institute of Management Accountants of Nigeria, Mulliner Towers, 39, 5th Floor, Alfred Rewane Rd, Ikoyi, Lagos
Correspondence to: Adeniyi Foluso Opeyemi, The Chartered Institute of Management Accountants of Nigeria, Mulliner Towers, 39, 5th Floor, Alfred Rewane Rd, Ikoyi, Lagos.
| Email: |  |
Copyright © 2021 The Author(s). Published by Scientific & Academic Publishing.
This work is licensed under the Creative Commons Attribution International License (CC BY).
http://creativecommons.org/licenses/by/4.0/

The covid-19 pandemic has elevated the level of inequality already in existence among and within countries. While the measures to contain the virus proved effective, its negative impact on the economy cannot be ignored. This systematic review highlighted the level of inequality before the covid-19 pandemic and examine how the pandemic has interacted with some major economic indicators. The paper also reviewed some lessons learnt from the pandemic and how countries can build a more resilient economy against future shocks – i.e., Climate Change. and suggested some policy recommendations.
Keywords: Covid-19, Inequality and Climate Change
Cite this paper: Adeniyi Foluso Opeyemi, COVID-19 and Inequality: A Systematic Review and Policy Options, American Journal of Economics, Vol. 11 No. 3, 2021, pp. 95-105. doi: 10.5923/j.economics.20211103.03.
Article Outline
1. Introduction
- The advent of the covid-19 pandemic has negatively affected the global economy. It has claimed over 2 million lives globally and worsens the living standard of people. While the measure to contain the virus proved effective, its negative impact on the economy cannot be ignored. The World Economic Outlook report released in April 2020 by the IMF projected the economy would contrast sharply by -3 per cent in 2020, much worse than during the 2008-09 financial crisis. The crisis has exacerbated the already existing inequality gap among and within countries. Widening inequality has significant implications for growth and macroeconomic stability; it can concentrate political and decision-making power in the hands of a few (Dabla-Norris. E et al. 2015). The economic and social fallout from the global financial crisis and the resultant headwinds to global growth and employment have heightened the attention to rising income inequality. (Dabla-Norris. E et al. 2015).On the other hand, inequality is the state of disparity, especially in status, rights, and opportunities (UN/DESA 2015) which can impede economic growth if not managed. Inequality can be viewed from the standpoint of people's backgrounds and what they have access to. i.e., For instance, people's background/origin, e.g. (Africans, Asians.) can influence what they have access to, i.e., quality education or broad-based internet access. High and sustained levels of inequality can entail high social costs; however, some degree of inequality may not be a problem as it provides the incentives for people to excel, compete, save, and invest in moving ahead in life (Dabla-Norris. E et al. 2015). Income inequality is an essential element of inequality. As found in UNDP 2017, Some groups systematically have less access to income and non-income resources than others. Women and girls are more deprived than men, and ensuring equal access to opportunities and services for women and girls would have significant positive implications for overall human development progress (UNDP 2017).Historically, past pandemics have had a significant impact on economic inequality, although there are limited official inequality data with considerable delay and these challenges policymakers in their objective to mitigate disparities and fine-tune public policies (Aspachs. O et al. 2021).While the pandemic has worsened the living standard of people by widening the inequality gap, i.e. some sectors (majorly contact-intensive sector) of the economy were hit hard while others experienced a boom, i.e. Information Technology Sector. However, all signals show that the global economy is on the recovery path, evidence in the IMF's projection of the world's economic growth to rebound by 6 per cent, as stated in the (IMF WEO April 2021). However, the recovery will be uneven, given the disparity in development across countries globally and how economies can build resilience against the looming shock of climate change.This article will assess the level of inequality before the advent of COVID-19 and how the crisis has exacerbated the inequality gap related to income, gender, employment, and education. It will also review the implications of the situation on probable future shock, i.e. Climate Change.
2. Literature Review
- The magnitude of the impact of the Covid-19 pandemic on inequality and economic growth compared to other past pandemics is enormous. Furceri. D et al. 2021 reviewed the effect of significant epidemics from the past two decades on income distribution, even though much smaller in scale than COVID-19. They found that major past epidemics have led to an increase in the Gini coefficient, raised the income share of higher-income deciles, and lowered the employment-to-population ratio for primary education compared to those with higher education. They provided some evidence that the distributional consequences from the Covid-19 pandemic may be more significant than those flowing from the historical pandemics and more prominent than those following typical recessions and financial crises and concluded that, in the absence of supportive policies to protect the vulnerable, the pandemic could end up exerting a significant impact on inequality.In the same vein, Blundell. R et al. 2020 bring together evidence from various data sources and the most recent studies to describe what they know so far about the impacts of the COVID-19 crisis on inequalities across several key domains of life, to show how the crisis interact with existing inequalities along various vital dimensions, including socioeconomic status, education, age, gender, ethnicity and geography. The authors find that the deep underlying inequalities and policy challenges already in existence are crucial in understanding the complex impacts of the pandemic itself and our response to it. The crisis has the potential to exacerbate some of these pre-existing inequalities directly. They concluded that the COVID19 pandemic has exacerbated existing inequalities (Deaton. A, 2021 also supported this assertion) and brought to the fore other inequalities that were perhaps less of concern before the pandemic. Furthermore, they added that the post-COVID world could see inequalities worsening further without a well-thought-out policy response. Schleicher, A. 2020 reviewed the impact of Covid-19 on public financing of education in OECD countries and concluded that while the long-term effects of the crisis are uncertain, he provided evidence that the pandemic may affect public spending on education as funds are diverted into the health sector. The author found that the pandemic exposed the vulnerability of each country to crisis, and each country's capacity to react effectively and efficiently in the future will hinge on governments' foresight, readiness, preparedness and commitment to the Sustainable Development Goals.Against the widespread belief that the COVID-19 pandemic has increased global income inequality, reducing per capita incomes in developing countries than in rich countries. Deaton. A, 2021 found out that rich countries experienced more deaths per head than have developing countries. Countries with more deaths saw more significant declines in income. There was thus not only no trade-off between lives and income; fewer deaths meant more income. He concluded that per capita incomes fell due to the high death rate in higher-income countries.United Nations 2020, in its policy brief on the Impact of COVID-19 on Women, reveals that women's economic and productive lives will be affected disproportionately and differently from men. Across the globe, women earn less, save less, hold less secure jobs, are more likely to be employed in the informal sector. They have less access to social protection and are primarily single-parent households. Their capacity to absorb economic shocks is, therefore, less than that of men. Also, using data from bank records to measure economic inequality, Aspachs. O et al. 2021 also found that the economic impact of the pandemic caused a significant increase in inequality. However, due to the devastating impact of the pandemic, the need to divert finance to respond to the crisis has taken priority, but this should not crowd out finance for Climate Change Adaptation but rather, lessons learnt from the devastating impact of Covid-19 should serve as an eye-opener to build a more resilient global economy (Quevedo. A et al. 2020). The author further stated that the pandemic had provided a unique opportunity to break away from 'business as usual' by shedding light on pre-existing societal inequalities and the interconnectedness and fragility of current systems to withstand global threats. An effective response to the climate change problem requires much more sweeping action globally than anything so far achieved. Economic policy instruments that have the power to alter patterns of energy use, industrial development, and income distribution are essential to any plan for mitigating or adapting to climate change Harris. J. et al. (2017).
3. Data Description
- For this research, various indicators and sources of data are reviewed.i. Income inequality – The level of disparity among countries is calculated using the Gini coefficient - a standardized measure of income distribution among the population – sourced from the World Income Inequality Database – WIID.ii. Gender inequality – The relationship between GDP ratio of male to female college enrollment is calculated using the average real GDP and male & female college enrollment data (1990-2018) - sourced from World Bank’s World Development Indicators (WDI) and United Nations Development Programme, Human Development Reports.iii. Unemployment rate - To review the unemployment rate in major economies of the world, data was sourced from the Organization for Economic Co-operation and Development (OECD) and: International Labour Organization (ILO).iv. To access the level of inequality gap since the onset of the Covid crisis, data from the IMF World Economic Outlook Report database: April, July 2021, IMF Data Mapper and Organization for Economic Co-operation and Development (OECD) were used to estimate the disruption to the supply and demand chain as it affects the trade volume of goods and services, General Government net lending and borrowing, Inflation rate , Debt level and GDP.v. Number of Students enrolled in secondary education was sourced from World Development Indicators World Bank, while the impact of Covid on Education was calculated using data sourced from the UNESCO Institute for statistics 2020.vi. Health Expenditure – Sourced from World Development Indicators World Bank.
4. Inequality before the Pandemic
- Equity and universal opportunities for people, in this generation and subsequent generations, to realize their full potential are central to Economic development (UNDP 2017). An economy with less inequality gap tends to thrive more than its contemporary. Much progress has been made over the years; people are more knowledgeable and have access to resources needed to support a decent standard of living; more children are going to school; incomes are higher, and more people live under democratic regimes with tremendous potential for political engagement (UNDP 2017). For instance, the number of students enrolled in secondary school education increased from 59.9% in 2000 to 75.9% in 2018, representing a 26% increase. East Asia & Pacific and Sub-Saharan Africa experienced an impressive growth rate between 2000 and 2018. In Sub-Saharan Africa, the enrollment rate increases from 25.8% to 43.2% representing 67% progress (Figure 1). While domestic general government health expenditure has also risen globally from 4.98% in 2000 to 5.87% in 2018, representing a 17.87% increase, and significantly in North America, from 5.57% in 2000 to 8.46% in 2018, representing 51.8% (Figure 2), the gain has not been equal as many people still experience deprivations in essential elements of life.
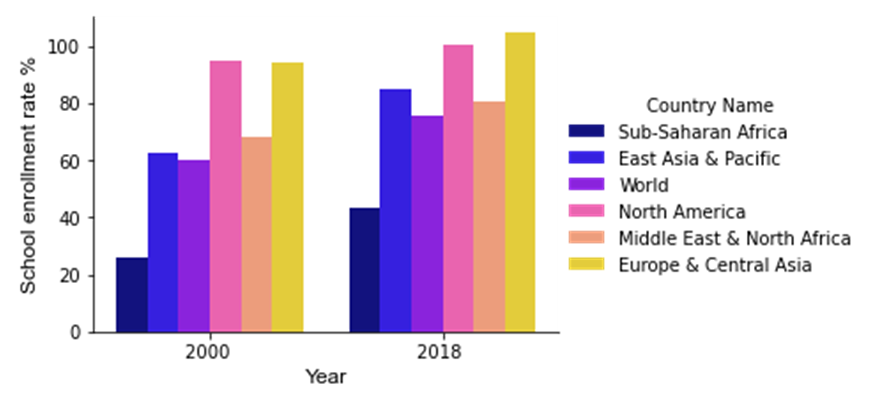 | Figure 1. Number of students enrolled in secondary school education (Source: Data Bank World Development Indicators World Bank Group and author’s calculations) |
 | Figure 2. Government Health Expenditure (% of GDP) (Source: Data Bank World Development Indicators, World Bank Group and author’s calculations) |
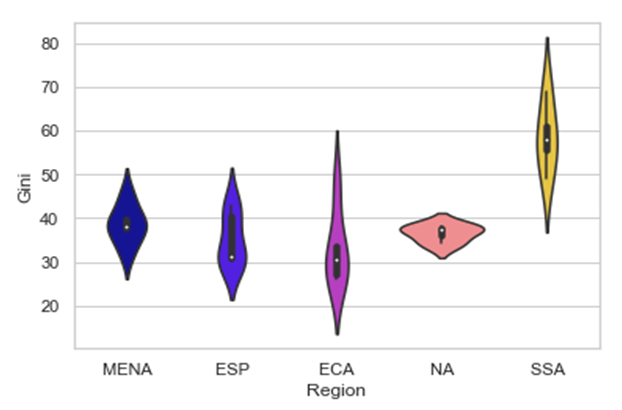 | Figure 3. Income Inequality (Source: World Income Inequality Database – WIID, and author’s calculations. Note: ESP = East Asia and the Pacific; ECA = Europe and Central Asia; NA = North America; MENA = Middle East and North Africa; SSA = Sub-Saharan Africa) |
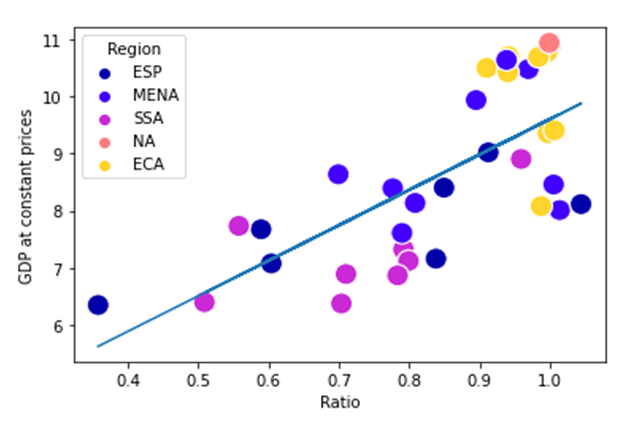 | Figure 4. Relationship between GDP & the ratio of male to female college enrollment (Source: World Bank World Development Indicators, United Nations Development Programme, Human Development Reports and author’s calculations. Note: ESP = East Asia and the Pacific; ECA = Europe and Central Asia; NA = North America; MENA = Middle East and North Africa; SSA = Sub-Saharan Africa) |
5. How the COVID-19 Crisis Interact with Inequality
- The Covid-19 crisis has undoubtedly affected the global economy by worsening the standard of living and widening the inequality gap already in existence. Although there is still much uncertainty around the crisis, the pandemic has been managed differently by countries due to pre-existing inequalities, preparedness, and the resiliency of the economy; the quality of public response, including reliance on science and expertise; citizens’ trust in government guidance. In addition, the crisis has larger welfare impacts in economies with greater pre-existing inequality (Stiglitz. J. 2020), (Hill R.V., and Narayan. A. 2020). Unlike the global financial crisis, which was mainly an economic crisis for the developed countries, covid- 19 – Great Lockdown- resulted in a more profound global recession. (Schmidhuber, J. and Qiao, B. 2020)The highly uneven impacts of the crisis are likely to widen opportunity gaps between the haves and have-nots in most societies, leading to lower social mobility and an unequal distribution of income and wealth (Hill. V & Narayan. A. 2020). Income distribution is essential for economic growth. Previous studies have found that the COVID19 pandemic has exacerbated existing inequalities and the absence of supportive policies to protect the vulnerable; the pandemic could end up exerting a significant impact on inequality (Furceri .D et al. 2021, Aspachs. O et al. 2021). Developing countries have suffered the hit of the pandemic more in terms of poverty and less in terms of mortality when compared with developed countries (Decerf et al. 2020 as seen in Deaton. A, 2021). The interaction of the crisis with some significant economic indicators might signal increased inequality.
5.1. Disruption to the Supply and Demand Chain
- One of the crisis's multiple impacts is the disruption to the supply and demand chain - an economic indicator (Figure 5) due to the mitigation measures such as - social distancing, closure of non-essential business - introduced to curb the spread of the virus. While authorities imposed restrictions, consumers also decreased their use of some unessential services. Hence, the pandemic combines aspects of supply and demand shocks by reducing the economy's capacity to produce goods and services at given prices and consumers' ability to purchase the goods and services produced at given prices (Brinca, P et al. 2020). COVID-19 has shown that businesses are interconnected (Xu, Z. et al., 2020).
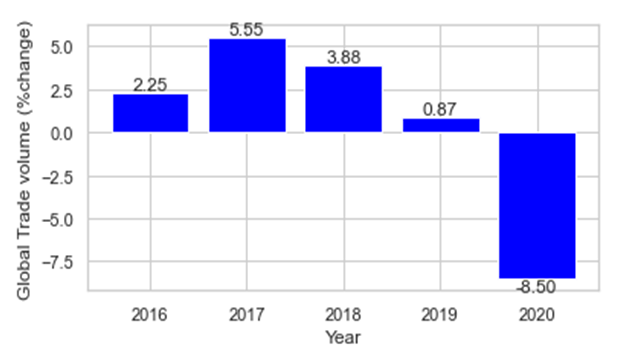 | Figure 5. Global Trade volume of goods and services (% change) (Source: IMF World Economic Outlook Report April 2021 and author’s calculations.) |
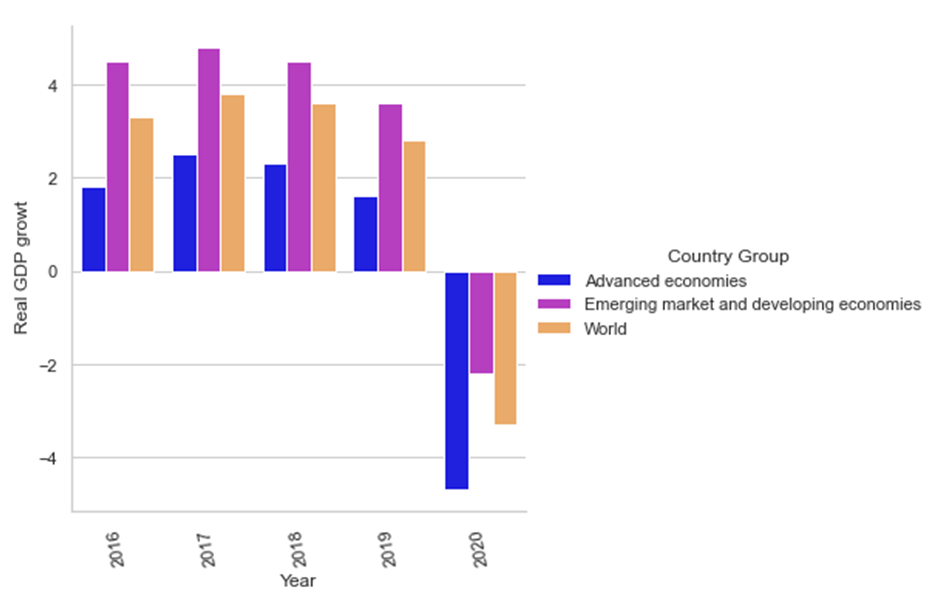 | Figure 6. Real GDP growth (Annual percent change) (Source: IMF data mapper and author’s calculations.) |
5.2. High Global Debt
- With existing high global debt of almost 60% of GDP by 2019 before the onset of the pandemic, most countries entered the COVID-19 crisis in a weaker position (WHO 2020). General government spending as a share of GDP increased globally in 2020, financed by rising deficits and debt levels, primarily to fund the emergency response to COVID-19 and implement countercyclical stimulus and social protection policies (WHO 2020). Many countries are faced with the dilemma of managing high public debt, supporting the high financing needs, and containing the virus (IMF FSR April 2021), hence the drastic increase in government primary net lending/borrowing and debt levels in 2020 (Figure 7 & 8).
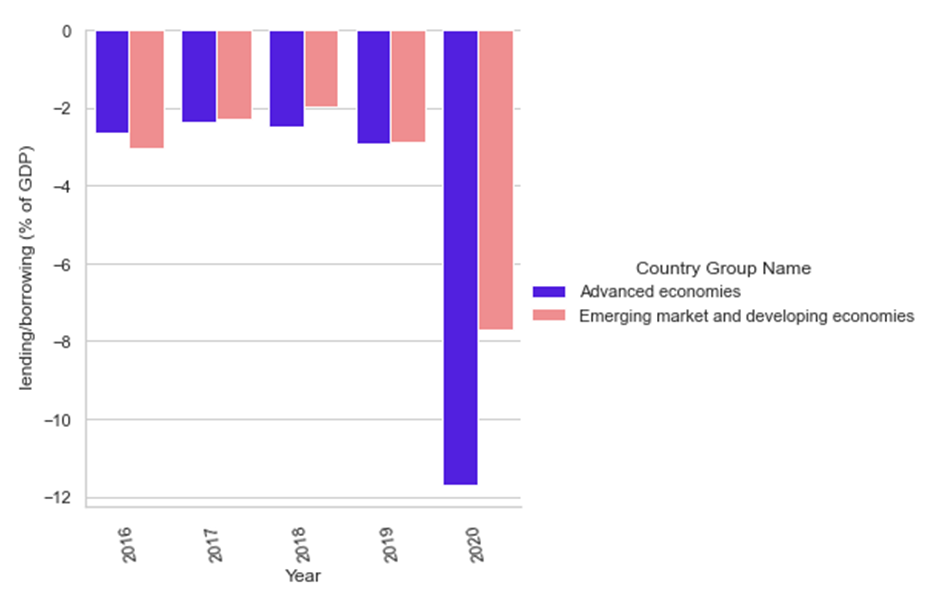 | Figure 7. General government primary net lending/borrowing (% of GDP) (Source: IMF WEO April 2021 and Authors calculations) |
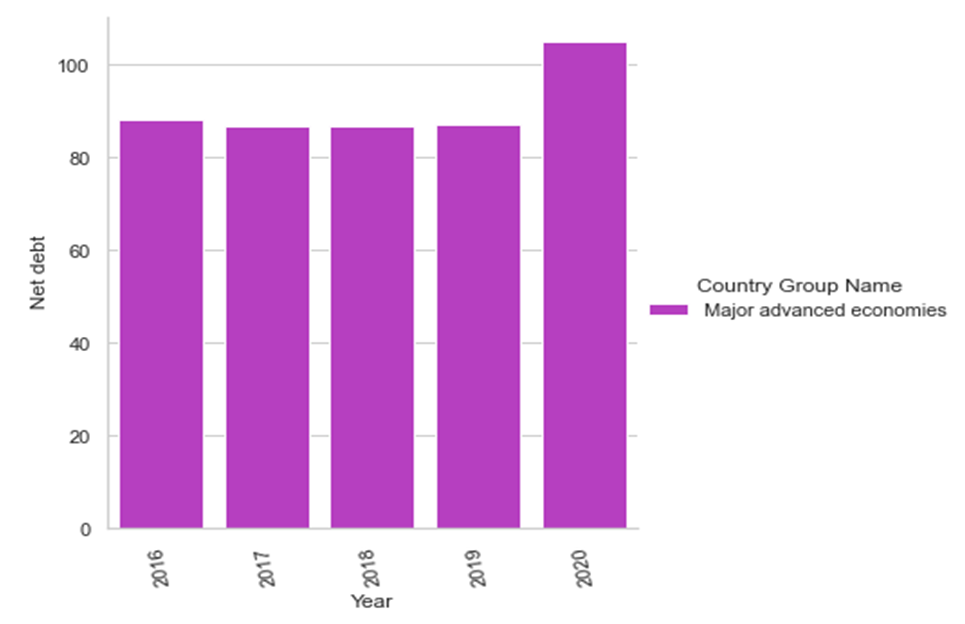 | Figure 8. General government net debt in MAE (% of GDP) (Source: IMF WEO April 2021 and Authors calculations) |
5.3. High Unemployment Rate
- Due to the disruption in the distribution chain, the employment level dropped drastically with more emphasis on the contact-intensive sector - Education Sector, Aviation Sector, e.t.c - which is majorly dominated by women. The severe impact on the labour market was fast; the unemployment rate rose in almost all the countries, i.e. in the United States of America, the unemployment rate increased from 3.6 in 2019 to 8.0 in 2020 (Figures 9). Evidence revealed that more women lost their jobs during the Covid-19 crisis (Figure 10).
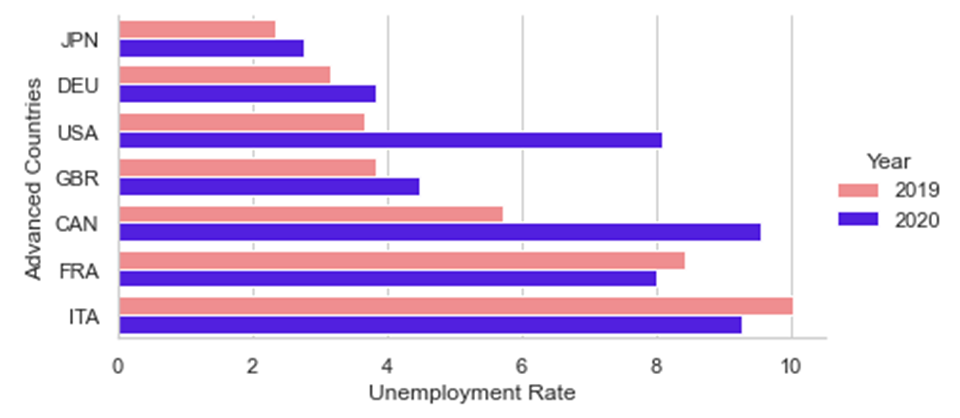 | Figure 9. Unemployment Rate in Major Advanced Countries (Source: OECD Data and author’s calculations. Note: JPN = Japan; DEU = Germany; USA = United States of America; GBR = United Kingdom; CAN = Canada, FRA = France, ITA = Italy) |
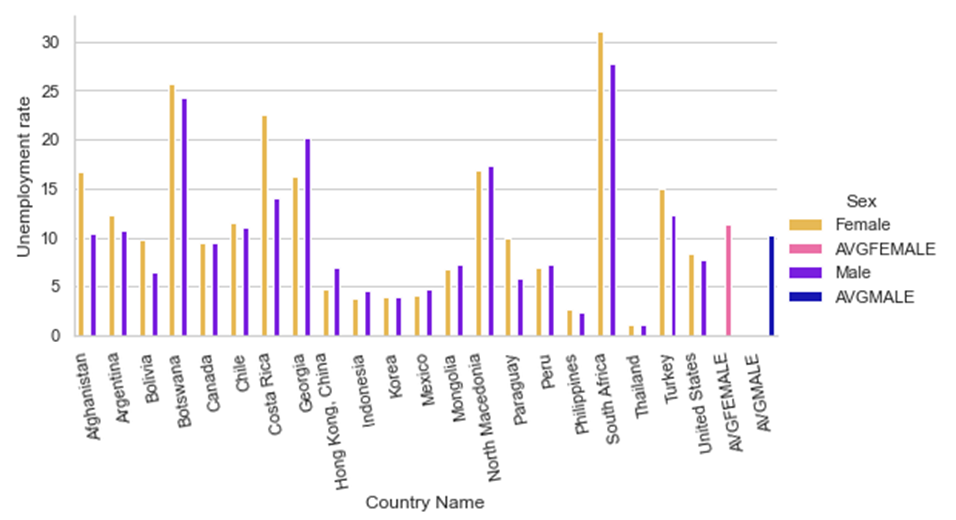 | Figure 10. Unemployment rate Female Vs Male (Source: International Labour Organization (ILO) and author’s calculations.) |
5.4. Access to Quality Education
- The crisis also influences people’s access to quality education (Figure 11). The level of education affects the choice of occupations and income level. Those that lost their job due to pandemic are mostly the ones with a low level of education. Those who are better educated can better switch sectors and types of jobs than those who are less well educated. Hill R.V., Narayan. A. 2020.
 | Figure 11. Impact of Covid-19 on Education (Source: UNESCO Institute for statistics 2020 and author’s calculations) |
5.5. Inflation Pressures
- At the onset of the crisis, inflationary pressures remained low in most advanced countries (Figure 12) except for some emerging markets and developing economies. While the crisis last, economies start to experience an accelerated inflation rate (especially from the last quarter of 2020). This inflationary pressure could be attributed to a mismatch of demand and supply, currency devaluation/depreciation and expansionary monetary policy (IMF WEO, July 2021). Inflationary pressure must be carefully managed to discourage the widening inequality gap.
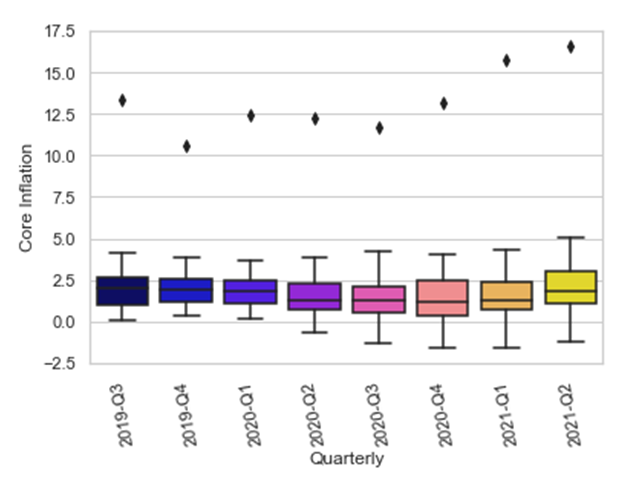 | Figure 12. Core Inflation (Source: Organisation for Economic Co-operation and Development (OECD), 44 OECD Countries and author’s calculations.) |
5.6. Gender Inequality
- While past recessions affected disproportionately male jobs, this time in most countries, women have faced larger employment losses since the start of the crisis. (Yahmed. B et al 2020). The onset of COVID-19 and the measures to contain the virus has exacerbated the gender inequality gap. According to United Nations, 2020 women are more likely to be front-line health workers, especially nurses, midwives, and community health workers, and as such, they are more likely to be exposed to the virus. Furthermore, despite all their contributions, women are often not reflected in national or global decision-making on the response to COVID-19.Sadly, as bad as inequality had been before the pandemic, and as enormously as the pandemic has elevated the disparities in our society, the post-pandemic world could experience even greater inequalities unless the government implements the well-targeted policy. The reason has been that: COVID-19 won't go away quickly, and the fear of another shock will linger – Climate Change Stiglitz. J. 2020.
6. Lesson Learnt from the Pandemic to Build a More Resilient Economy against Future Shocks – i.e., Climate Change
- The covid-19 pandemic has so far revealed several economic and social weaknesses of most countries of the world. It is essential to safeguard the world against any future shock. The adverse effect of Climate Change might be the next shock if not promptly addressed. The global population has been on the increase (figure 13) Conceicao, P. 2020, more humans and more activity increase the risk of a pandemic because an increase in either put more pressure on Earth's systems and while non-pharmaceutical/pharmaceutical measures will overcome COVID-19, the only cure for climate change is prevention. The planet’s climate is changing, and that human activity is responsible. Extreme heatwaves and rising sea levels will leave areas uninhabitable. Conceicao, P. 2020.
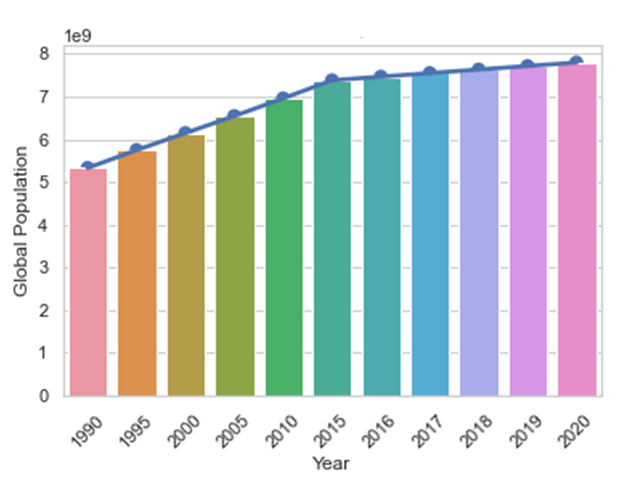 | Figure 13. Global Population (Source: Worldometer, and author’s calculations) |
7. Policy Recommendation
- Effective, efficient, and well-targeted policy measures are essential to achieve macroeconomic objectives and ensure a more resilient economy. A coherent policy tailored to each country's needs is required to builds buffers against future shocks, thereby eradicating countries' vulnerability to shocks.For a more resilient economy, fiscal policy and monetary policy must complement each other.
7.1. Fiscal Policy
7.1.1. Improving Healthcare Spending
- The Covid-19 crisis has revealed the importance of financial support to the health sector. Investment in the health sector is essential to improving economic growth. Authorities should ensure; improved and continuous financial support to the health sector, a conducive work environment and compensation scheme for health workers, procurement of vaccines (not limited to Covid vaccines), and encourage equal vaccine access. The health labour force is essential for economic growth. Evidence revealed a positive relationship between economic growth and current health spending in randomly selected European Countries in 2018 (Figure 14). Hence the importance of health spending.
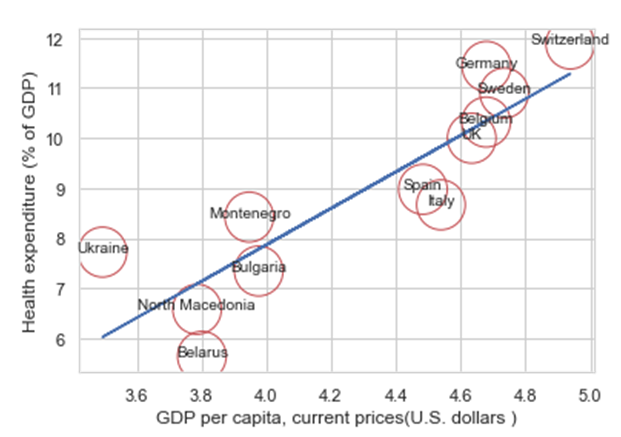 | Figure 14. Relationship between Health Expenditure and GDP (Source: IMF Data Mapper, World Bank Data Bank, and author’s calculations Year – 2018 data, 12 randomly selected European Countries.) |
7.1.2. Invest in Human Capital Development
- Not ignoring the progress made over the years, much still needs to be done, especially in low-income countries and emerging countries, to sustain the wins on the Covid-19 pandemic and prevent the adverse impact of possible future shocks, i.e., climate change. Recipients of quality education are more likely to understand the potential impact of shocks on economic growth and take preventive measures more seriously. They often contribute immensely to economic growth and are more likely to enjoy a high level of income.According to Monsalve. C and Watsa K 2020 Education can help people understand and address the impact of global warming. A more robust human capital base can help communities adapt to a changing climate, and reciprocally, investments in low-carbon, climate-resilient development can help countries unlock further human capital gains.To ensure inclusive and sustainable growth, Human Capital Development must be at the centre of policymaking. Authorities should ensure a well-targeted, adequate, and continuous investment in education, i.e., access to internet broadband network for all, good infrastructure to create a conducive learning environment and training and re-training of teachers. Education has contributed immensely to understanding the epidemiology of the virus; it can unlock further gains and combat climate change shocks.
7.1.3. Social Spending.
- Covid 19 pandemic took a significant toll on women and youths due to loss of jobs and access to quality education. The effects of climate change can be more devastating. Authorities should adopt more inclusive measures to protect the most vulnerable ones and empower them to contribute to economic growth. In addition to financially including the most vulnerable, women and youths must be enlightened on the possible impact of climate change shock. For instance, Agriculture dominates female employment in many countries in Africa (L. Adeniyi 2010), dearth of knowledge and financial capabilities for the most vulnerable can amplify the impact of natural disasters. Financial inclusion for the most vulnerable can improve economic growth.
7.1.4. Efficient Tax System
- An efficient Tax System can significantly improve the economic growth of any nation, build inequality gap, reduce vulnerabilities to shocks and dependence on international organizations. Authorities should put measures in place that will encourage transparency in taxation, a fair tax system and efficient utilization of revenue as this will encourage taxpayers.
7.2. Monetary Policy
- Monetary policy (Accommodative or Tight) is essential to either support the economy during downtown or build resilience against shock while ensuring stable macroeconomic objectives. Authorities should ensure that monetary policy tools are deployed countercyclically. Evidence revealed that inflationary pressure increased around the first and second quarters of 2021; hence, policymakers should carefully assess the trend and the likely causes before implementing any monetary policy action.It is also crucial that Central Banks carefully analyze the impact of Liquidity risk, Exchange rate risk, Interest rate risk, and credit risk on the bank's balance sheet before making monetary policy decisions.
7.3. Financial Sector
- Financial Sector can be seen as the major backbone for the real sector been a provider of funds. The Financial sector stability is essential for any economy to thrive. Thanks to the incredible support by the G20 reforms (FSB 2021), most financial institutions entered the crisis with a strong position, thereby not significantly affected by the shock. Financial sector policy measures should ensure periodic monitoring of the Financial Soundness Indicators (FSI) and quality Stress Test for all financial institutions to prevent insolvency and encourage continued support to the real sector and build a more resilient financial sector.Financial Soundness Indicators (FSI), including but not limited to; liquidity level, Capital adequacy ratio, the exposure to the exchange rate, Profitability, Asset quality, must constantly be in check to prevent instability and collapse of financial institutions.
7.4. External Sector
- The resultant effect of the pandemic on demand and supply chain could affect most countries' balance of payments, forcing some economies (especially commodity exporters) to devalue their currency in response to the shock. Countries should be more diversified to build resilience against external shocks and improve current account balance. While not ignoring the importance of Comparative cost advantage, economies should be less dependent on importation as high import dependence might discourage economic growth.Barriers to international trade, especially medical equipment, should be lifted to save lives. Low-income countries/ Fragile economies should endeavour to harness inwardly generated revenue while embracing support from international organizations.To build capacity for appropriate implementation of the above policies, a strong institution (a major driving force for growth) must be incorporated.
8. Conclusions
- This systematic review studies the level of inequality before the Covid-19 pandemic and how the pandemic has interacted with some major economic indicators. The paper also reviewed some lessons learnt from the pandemic and how countries can build a more resilient economy against future shocks – i.e., Climate Change. and suggested some policy recommendations.