Fallah Samuel Kassoh1, Kwasi Ohene-Yankara2, Fred Nimoh2, Ibrahim Latif Apaassongo3, Raymond Manna Bangura1
1Sierra Leone Agricultural Research Institute (SLARI), Tower Hill, Freetown, Sierra Leone
2Department of Agricultural Economics, Agribusiness and Extension, Kwame Nkrumah University of Science and Technology, Kumasi, Ghana
3Kwame Nkrumah University of Science and Technology, Kumasi, Ghana
Correspondence to: Fallah Samuel Kassoh, Sierra Leone Agricultural Research Institute (SLARI), Tower Hill, Freetown, Sierra Leone.
| Email: |  |
Copyright © 2021 The Author(s). Published by Scientific & Academic Publishing.
This work is licensed under the Creative Commons Attribution International License (CC BY).
http://creativecommons.org/licenses/by/4.0/

Abstract
We present the performance of urban small ruminants markets in Kumasi and Tamale of Ghana. Two hundred and eighty four sheep and goats traders were selected using the multistage sampling technique. Primary data was collected using structural questionnaire. The result revealed that (95%) of live small ruminant traders were dominated by men and were between the ages of (31) and (50) years. Purchasing cost for live animal constituted (84.68%) of the total marketing costs while (15.32%) accounted for transaction cost. The finding also indicates that sheep and goats marketing are profitable ventures in the study areas and, the average goat net marketing margin (24.85%) and was significantly higher than the average sheep net margin (17.73%). The results also show that every (Ghana Cedi (GH¢) 1.00) invested in sheep and goats results in (GH¢ 0.18) and (GH¢ 0.25) return on capital, respectively. Comparing this result with return on saving (22%) charged by the Central Bank of Ghana in 2015, goats trading was better off than saving.
Keywords:
Market, Performance, Small Ruminant, Traders
Cite this paper: Fallah Samuel Kassoh, Kwasi Ohene-Yankara, Fred Nimoh, Ibrahim Latif Apaassongo, Raymond Manna Bangura, Market Performance of Small Ruminant in Kumasi and Tamale of Ghana, American Journal of Economics, Vol. 11 No. 3, 2021, pp. 84-94. doi: 10.5923/j.economics.20211103.02.
1. Introduction
Small ruminants are economically significant in the agricultural sector of most developing nations, including Ghana. According to Wubie et al. [1], most sheep and goats are reared by household members and require; low maintenance costs, low start-up capital, faster growth rates, and increase herd size within the shortest period compared to large ruminants. Small ruminants also serve as sources of income, provide protein (meat and milk), manure, wool, and security against crop failure [2]. It serves as collateral for acquiring the loan, saving, and risk distribution mechanism for smallholder farmers in different farming systems and agro-ecologies in Ghana [3&4]. Furthermore, small ruminant farming is superior to direct saving money in financial institutions because their net annual returns are much higher than the interest realized from banks’ savings [5]. Similarly, small ruminants contribute immensely to household income and offer employment to the majority to enhance the sustainability of livelihoods and food security among poor rural households [2&3].In Ghana, 60%) of the population are directly employed in the agricultural sector and accounted for (34.5%) of the country’s Gross Domestic Product (GDP) [6]. The livestock in the sub-sector contributes (17.4%) of the total agricultural GDP (MOFA, 2010). GDP (MOFA, 2010). Ghana is rich in indigenous livestock production facilities, precisely small ruminants that are principal components of pastoral farming. Adzitey [7] estimated the total domestic population of live sheep and goats between 2001 and 2010 were (3,269,460) and (2,958,568) each. Sheep and goats form an integral part of livestock production in most urban and Peri-urban house-holds in Ghana. Oppong-Anane [8] reported that small ruminants are produced less by urban dwellers and constitute (25%) of the 13.3 million population. Most small ruminants are reared in the northern region of Ghana, while Tema, Kumasi, and Accra are the major consumption cities.In enhancing productivity, small ruminant producers need to consider the market as a principal aspect of production. The marketing system must provide information flows from the consumer back to the producer [9]. Livestock marketing encompasses the sale, purchase, or exchange of live animals and their products (milk, meat, skins, wool, and hides) for income or other commodities. Marketing as an economic activity bridges the gap between production and consumption and creates linkages between sellers and buyers [10]. The rural/village and roadside markets operate periodically, where sellers of livestock meet to offer animal trade with collectors, aggregators, and negotiators with other buyers. Butchers or negotiators who convey animals to towns/cities or abattoirs are the principal buyers from farmers. The market structure includes producers, traders, retailers, food service providers, and consumers. Public, privates, inputs, service providers, and regulatory institutions that involve; taxation, licensing, and warranties, are part of the structures [11&12].Small ruminants demand is driven by; the high population growth rate, rapid urbanization, increased income, health consciousness and a shift in consumption patter [13]. While Budisatria et al. [14] observed that major religious holidays have a market effect on supply, demand, and prices of small ruminants. In Ghana, most small ruminant flow from low-income surplus areas in the drier savannas to high-income and populous deficit areas via long-distance trade. The demand for sheep and goat meat currently outnumbers the supply in Ghana. Producers cannot simply catch up as demand has doubled the domestic production leaving a wide potential avenue for employment and income generation [15]. However socioeconomic factors such as age, experience, educational level and initial capital influence market performance. For instance, [16] found that experience, age, and educational level has positive impact on market performance. On the contrary [4] traders with higher educational level does not necessarily impact market performance.Despite these opportunities, several marketing issues hinder the performance effectiveness of small ruminant markets. These issues must be solved when developing a successful small ruminant production and marketing systems. Marketing of small ruminant in urban long-distance destination markets in Ghana consists of few square meters of open space where they keep sheep and goats for sale [16,17]. The livestock market structure is characteristically lengthy (about 3 to 5 stages between producers and consumers) without significant value addition [18,7]. The agricultural market performance of developing countries, observed by policymakers as a critical component to enhance development. The market performance depends on the output of the firm's accomplishment. Williams et al. [19] measured perfect information as an assumption of perfect competition where all traders in each market are acquainted with the market situation.Conversely, the marketing of sheep and goats is at a rudimentary level as indigenous management practices that are not market-oriented. Poor infrastructures, high transaction costs, limited financial facilities, road harassment, regulatory burden paperwork, unnecessary time wastage, and proliferation of brokers are principal factors that impede the performance of the small ruminant market [12]. According to Gebremedhin et al. [12] brokers charge too high unfixed commissions from buyers, sellers, and transporters, engage in price misinformation and hindrance of transactions. Another issue that hinders the performance of livestock markets is a spatial disconnection between production zone and high consumption zones [10].A malfunctioning market revealed by its structure and conducts having the potential of bringing up higher transaction costs and inequities in income distribution, among others. Thus, ex-communicated smallholder ruminant producers from market participation put the potential of the livestock sub-sector in jeopardy. This study aimed at analyzing the performance of the small ruminants market and identifying possible improvement options to enhance benefits to small-scale traders. Also, foster a better understanding of the challenges facing livestock traders and help to bridge the information gap identified in the livestock market. Therefore, this study sought to answer the following research questions: What are the costs and returns of sheep and goats marketing? What are the factor that influenced the performance?
2. Materials and Method
2.1. Description of Study Areas
Based on the predominant and consumption of small ruminants, we conducted this study in two urban cities (Kumasi and Tamale) in Ghana. Another reason for choosing these urban towns is the numerous sheep and goats markets found in different locations in these metropolis.Kumasi is the second-largest city in Ghana, situated at the transitional forest zone and is about 270 Km north of Accra. Kumasi municipality is the most populous district in the Ashanti region and has a population of (2,396,458) with an annual growth rate of (4.8%) [20] Tamale is the capital of Northern Region of Ghana and has a population of (371,351) [21]. Tamale is the third-largest settlement in Ghana and the second fastest growing city after Kumasi [21]. Most Tamale residents are moderate followers of Islam, as reflected in the multitude of mosques in Tamale [21].
2.2. Sampling Procedure and Sample Size
We employed a multi-stage sampling method for this research. Again, we purposively selected two urban cities due to distribution patterns of sheep and goats in the country. Furthermore, the selection of the study areas was due to the geographical disjoint in production and consumption of small ruminants. A pilot survey was conducted in Kumasi and Tamale cities to identify the existing markets and develop the sample frame. Data collected from key informants (market heads and experienced traders in the various markets. Based on the appreciable number of small ruminant traders, we chose ten (10) main markets in Kumasi and Tamale. We used a disproportionate stratified sampling technique to meet the sample of marketers in each stratum representing (market) the proportion of the chosen sample size. Finally, we randomly selected (284) small-ruminants traders consist of (149) traders in Kumasi and (135) traders in Tamale.
2.3. Data Collection
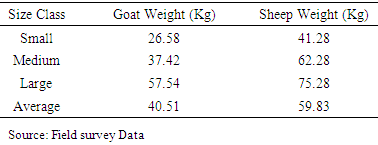
We used a pre-tested semi-structured questionnaire to collect primary data on small ruminant traders. The questionnaire was developed and pre-tested before commencing the actual survey. Some information captured in the questionnaire was the trader’s demographic characteristics, transaction cost, trading variables, and constraints of urban small ruminants markets. Focus group discussion and key informant interviews were also applicable in the primary data collection. We grouped sheep and goats into three categories in the data collection: small, medium, and large size classes based on their prices. We took weights of ten (10) goats and ten sheep in each size class to compute the average weight in each class sampled market. We show the weighted average of the different size classes in Table 1.Table 1. Weights of Sheep and Goat in their Size Classes
 |
| |
|
2.4. Data Analysis
The descriptive statistics used are; frequency distribution tables, arithmetic means, standard deviation, and percentage to analyze the socio-economic characteristics and marketing performance. Also, we used regression analysis to describe the relative performance of small ruminates trade. The model was used to measures the degree, cause, and effect relationship between the variables. For analysis, we processed the data in Statistical Package for Social Scientists version 21 (SPSS 21).
2.4.1. Market Performance
We assessed the performance by estimating marketing costs, marketing margins, and profitability. Gross margin measures the returns on own labor and capital can be a good indicator of business performance, and variable costs are influenced by assets and trading practices. Hence, we considered both variable cost and gross margin as indicators of measuring performance.
2.4.2. Estimation of Marketing Costs
There are different marketing costs related to the latest transaction of sheep and goat traders and recorded marketing costs to the last month of business for each trader. The weighted average method was used to obtain the average marketing costs for each respondent (trader), hence average marketing costs was computed as:  | (1) |
Where;  = Average marketing cost of quantity sheep and goat traded in an average batch,
  = quantity handled during the latest transaction for each trader; used as a weighing coefficient and
  = Different types of marketing costs of the latest transaction incurred by each trader.
2.4.3. Estimation of Marketing Margins
According to Maikasuwa and Jabo [4], marketing margin is almost to profit margin that shows the relationship between the amount a firm pays for a product and the amount its customers pay. Maikasuwa and Jabo [4] defined market margin as the difference between the cost of the seller and the consumer. The marketing margin gives a close approximation of the market performance. Firms use marketing margin as a way of figuring profitability. A high marketing margin signifies a higher level of profitability and a higher level of business stability [4]. The marketing margin can be expressed either in nominal terms or in percentages. We adopted the formula from [4] for estimating market margin that revealed the margin of a specific actor within the market channel.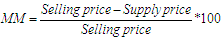 | (2) |
Where MM is market margin of actor.Net market margin is expressed as 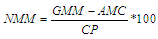 | (3) |
Where: NMM is net marketing margin of actors, GMM is gross marketing margin, AMC is average marketing cost and CP is consumer price.Net marketing margin of actor.
2.4.4. Regression Analysis
A linear multiple regression analysis was employed to determine the factors that influence the performance of small ruminant’s market. The linear regression model can be express as: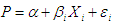 | (4) |
Where:  is constant;
  is the slope;
  is the explanatory variables and
  is the error term.The empirical model use to determine factors that influence the performance of small ruminant market can be expressed as:
  | (5) |
Where;  is Net marketing margin,
  is the constant,
  estimated regression coefficients,
  are the explanatory variables and
  is the stochastic term. X1 = Trader’s age, X2 = Year of Experience, X3 = Educational level, X4 = Initial capital, X5 = Access to credit, X6 = Cost of animals, X7 = Transaction cost, X8 = Regulatory cost, X9 = Total animal traded, X10 = Number of trips made per year and X11 = Gross revenue.
3. Results and Discussion
3.1. Socioeconomic Profile of SG Traders and Enterprises
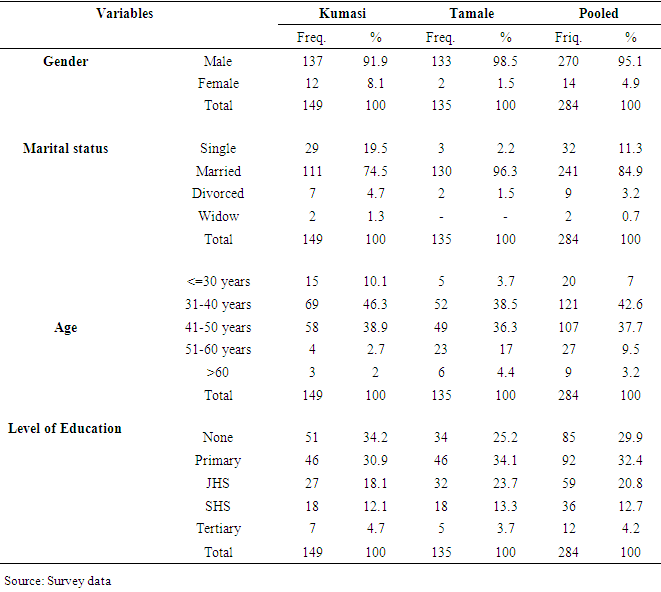
The result in Table 2 shows the socio-economic characteristic of small ruminant’s traders in Kumasi, Tamale, and the Pooled. A total of 284 small ruminants traders comprising (52.46%) in Kumasi and (47.53%) in Tamale were involved in the live sheep and goat trade. It was found that small ruminant trade in both cities is dominated by men (95%). This result is in line with [22] who reported a similar pattern in Ethiopia where (90.8%) of traders engaged in live sheep and goats’ trade were men. Nonetheless, 14 (4.9%) of the respondent were females found actively participating in the mobilization, transportation, and trade of live sheep and goats in Kumasi and Tamale. About (80%) of all traders were between the ages of (31) and (50) years, the majority of whom were married, (75%) in Kumasi and (96%) in Tamale. Regarding the level of education of traders, the survey results show that nearly (32.4%) of all respondents attained primary level. The majority of trader (34.2%) in Kumasi were illiterate while (34.1%) attained primary level in Tamale. Only a few trades in both cities Kumasi (4.7%) and (3.7%) had a maximum of tertiary school education.Table 2. Frequency Distribution of some Demographic Attributes of Traders
 |
| |
|
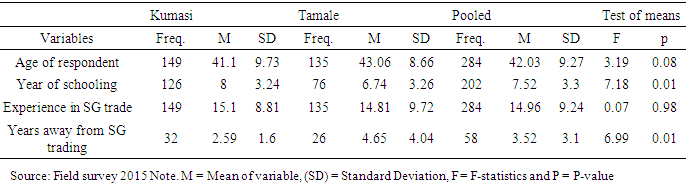
The comparative descriptive statistics in Table 3 reveals a significant difference in average ages of traders (p-value of 0.08). It implies that Tamale traders were older (average age of 43 years) compared to those in Kumasi (41 years). While Kumasi trader spent more years of schooling (8 years) than that of Tamale traders which is highly significant at 1%. The number of year’s traders have shifted away from sheep and goats’ trade for other activities was also significant (p-value 0.01). It was found that more traders in Kumasi (32 relative to 26 traders) shifted to other economic activities, but for relatively shorter periods (3 relative to 5 years) relative to those in Tamale. This situation is consistent with the economic differences between the two towns. It is the case that Kumasi for that matter is a more commercially oriented location and thus offers more options of commercial engagements. Experience was measured in term of number of years spent in the business the result reveal most of the traders in the pooled have been in a live small ruminant trade for (15 years).Table 3. Descriptive Statistics of Demographic Characteristics of Traders
 |
| |
|
3.2. Enterprise Characteristics
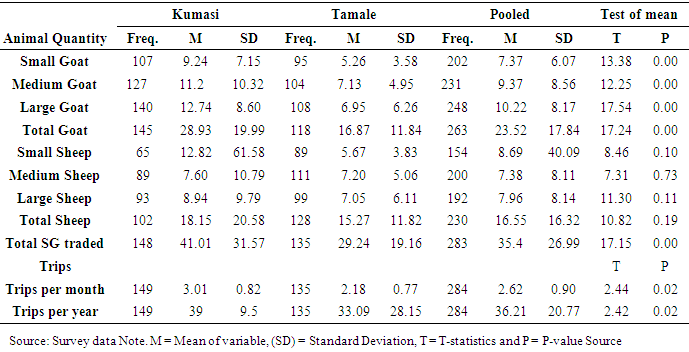
Table 4 indicates the average quantities of animal purchase and the number of trips made per month. The finding in the Pooled data shows an average of (24) goats, (17) sheep and three (3) trips are done per month. Test of means shows that the average number of sheep and goats handled in an average batch, and number of trips made during a month were significantly higher in Kumasi than that of Tamale. About (29) goats and (18) sheep and three trips per month were made in Kumasi while in Tamale, (17) goats and (15) sheep and two trips were made per month. This is due to the high demand for small ruminants in Kumasi which is linked with change in eating style, low production of livestock, high-income level of inhabitants and preference of high value food animal protein and consumers depend holistic the market for animal protein.Table 4. Average Sheep and Goats Traded per Trip and Number of Trips per Month and Year
 |
| |
|
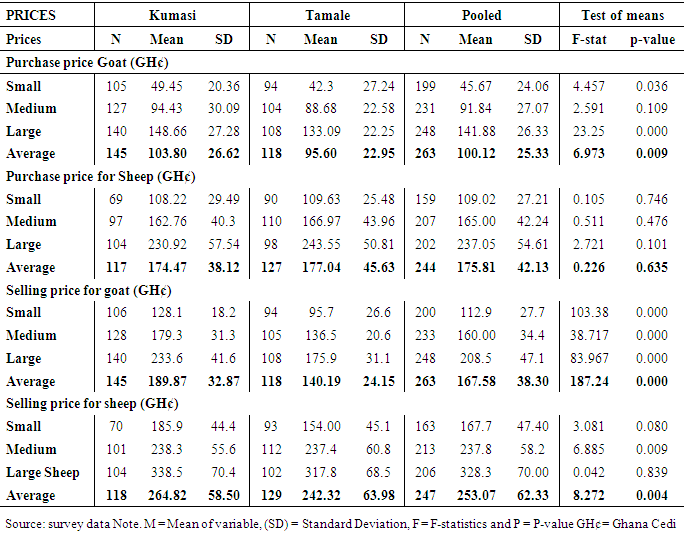
Table 5 shows descriptive statistics of buying and selling prices disaggregated at the city level. It may be inferred from the table that the cost price of goats but not sheep are significantly different between traders in Tamale and those in Kumasi. The former reports lower prices for goats and higher prices for sheep. Relative to size categories, small and medium goats cost Kumasi traders about (GH¢ 5.00) more, whereas large goats cost about (15.00) compared to Tamale. Sheep prices however are not significantly different between traders in the two cities as mean prices are (GH¢ 1.41, GH¢ 4.21 and GH¢ 12.63) higher among Tamale traders for the respective size classes.Table 5. Purchase and Selling Prices of SG among Traders in Kumasi and Tamale
 |
| |
|
The selling price of medium weighted sheep is statistically significant between Tamale and Kumasi at (5%) Significance level. For goat however, the selling price is (GH¢ 15.00, GHC 20.00 and GH¢25.00) higher in Kumasi for small medium and large sheep respectively at (1%) significance level. A typical goat offered in Tamale is sold for a mean price of (GH¢ 140), whereas a similar goat in Kumasi goes for (GH¢ 190.00). Purchase and selling prices of goats and sheep differ significantly relative to the location of the traders. For sheep, however, cost prices and selling prices are less likely to differ significantly among the traders in the two cities. Among other reasons, sheep consumption peaks with Muslim ceremonies and festivities, and goats with Christian festivities. Since there are more Muslims in Tamale than Kumasi, this is likely to be the case that the demand and hence prices of goats in Kumasi is higher relative to Tamale. High goat prices in Kumasi is buttressed by the relatively higher local demand for meat products. For sheep, high consumption may be in Tamale but proximity to sources of production and hence lower transaction costs relative to Kumasi, may absorb any likely growth in price resulting from higher demand. As a consequence, the price levels in the two cities vary only slightly.
3.3. Margins in the Trade of Small Ruminants
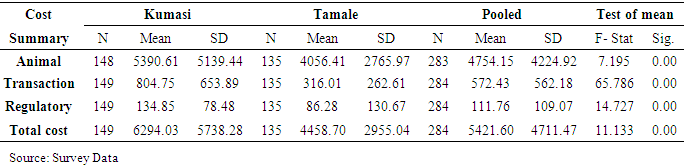
Margins as define by the net return per animal estimated through cost, revenue and size of operations (number of animals in a usual batch traded). Three (3) groups of cost items characterised the sheep and goat trade in the two Ghanaian towns. They include animal (stock), transaction and regulatory costs. Table 6 below depicts that animal (stock) cost constitutes the largest cost profile in magnitude, being about (GH¢ 4754.00) per batch traded followed by transaction costs. The latter reached an average amount of (GH¢ 562.00) per batch. Regulatory cost is the smallest amounting to (GH¢ 112.00) per batch. Kumasi traders report significantly larger costs in terms of all these categories as the f-statistics shows. Table 6. Sheep and Goat Trading Cost
 |
| |
|
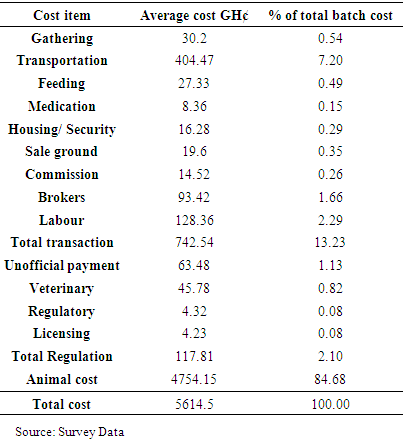
A disaggregated view of costs is presented in Table 7 showing a profile of costs in sheep and goats trade. When total cost is expressed as the sum of average costs from the pooled sample (see Table 7), the major cost items emerging included transportation costs (7.2%), payments to brokers (1.66%), unofficial payment during transit (1.13), and labour payments (2.29%). Other relatively significant costs identified were medication cost (0.84%), gathering (0.54%) and feeding (0.5%) costs. The cost profile of sheep and goat trade is dominated by animal cost, which averages (GH¢ 4754.00) on the whole and accounts for (85%) of total trade costs. Between Tamale and Kumasi, all cost categories except for veterinary costs are significantly different at (1%) payments to commission agents is significant only at (10%) alpha level. Whereas the Kumasi based traders reported higher costs on most key trade cost items, the local Tamale trader exceeded in feeding (GH¢ 35.00 relative to GH¢ 20.00), medication (GH¢ 10.00 relative to GH¢7.00), veterinary inspections (GHC 50.00 relative to GH¢ 42.00) and annual licensing (GH¢ 5.50 relative to GH¢ 3.80) costs.Table 7. Cost Items of Sheep and Goat Trade
 |
| |
|
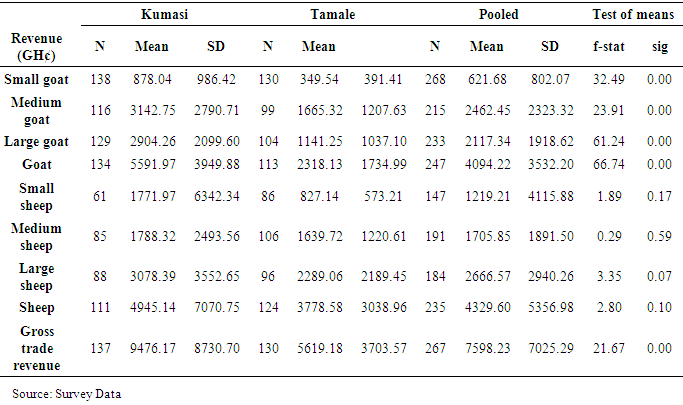
Variation of market margins with trader and enterprise featuresThe accompanying revenue per batch of all transactions are evaluated at size-class level with results displayed in Table 8. Average revenue from the sheep transactions alone is about (GH¢ 300) more than the goat trade. The latter averages (GH¢ 4094.00) across the two urban centres. Whereas most of the goat revenue emanates from medium size animals with a mean class revenue of (GH¢ 2462.00), most of sheep revenues is raked-in by large-sized sheep (class mean revenue of (GH¢ 2667.00). Total trade revenue per enterprise per batch averages (GH¢ 7598.23) Differences between Tamale and Kumasi in terms of all revenue parameters for goats were statistically significant at (1%) significance levels. For sheep however, only revenue from large sheep and the total revenue for sheep differs significantly between the towns at (10%) significance levels. While the average for sheep is (GH¢ 4945.00) in Kumasi and (GH¢ 3779) in Tamale. For goats, however, the revenue reported from Kumasi traders (GH¢ 5592.00) is more than double that reported in Tamale (GH¢ 2318.00). The pattern of contribution of each size-class to revenue in the pooled sample is maintained between Tamale and Kumasi.Table 8. Descriptive Statistics for Revenues in Sheep and Goat Trade
 |
| |
|
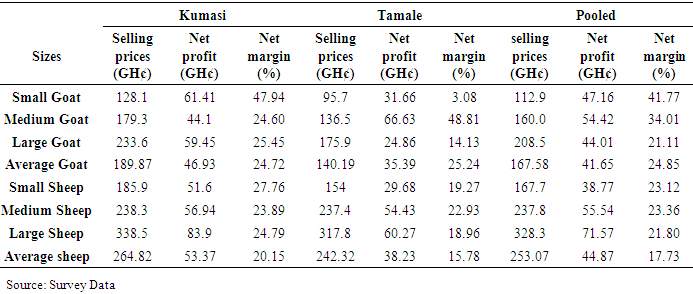
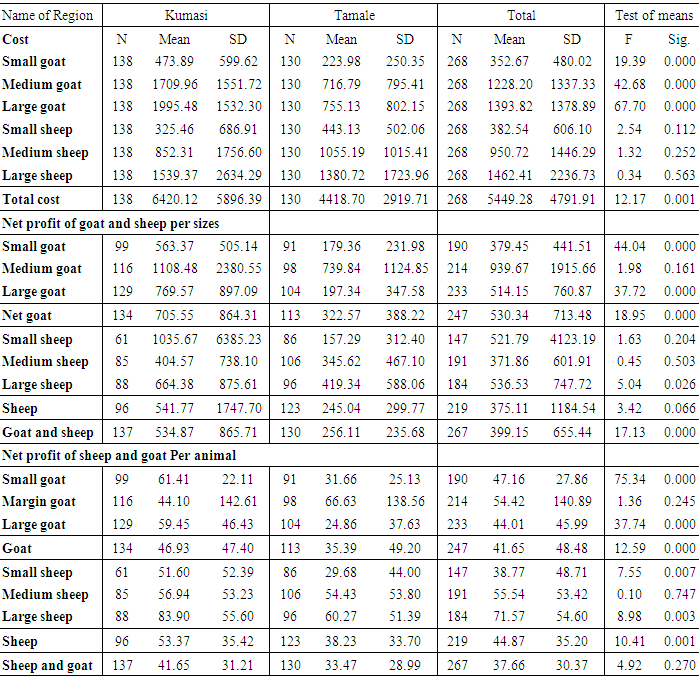
Again, costs have been elaborated above, Appendix 1 displays net profits and trade margins per animal traded after exclusion of outliers and unrealistic data points. The Total cost then averaged (GH¢ 6420.00) for Kumasi, (GH¢ 4419.00) for Tamale and (GH¢5449.00) over the survey having been summed from costs of the various animal size classes. Only small differences in total cost per size-class of sheep ranging from (GH¢100-200) were recorded between Tamale and Kumasi, but statistically not significant. Total costs among Kumasi trades for size classes of goats were very different and hence statistically significant. Consequently, small goat dealers made about (GH¢ 563) per batch in Kumasi, whereas their counterparts in Tamale made (GH¢179.00). Large goat dealers in Kumasi also made about (GH¢570) on a batch more than traders of similar animals in Tamale. Net profit differences between Tamale and Kumasi for medium goats and sheep were not statistically significant. Also, mean net profits for small and medium goats differed significantly at 1% significance level, only the difference for the large category of sheep is significant at (5%) level of significance.On the whole, Kumasi traders made significantly higher net profits in both the goat (GH¢ 706.00) and sheep (GH¢ 542.00) trade relative to Tamale traders (GH¢ 323.00) for goat and (GH¢245.00) for sheep. At the enterprise level, traders across both towns make very variable profits as can be judged from the large value of the standard deviation. Regardless of trader location (Pooled), net profits of enterprise operations average (GH¢ 399.00). Enterprise specific net profit per batch again is in favour of Kumasi traders with (GH¢ 535.00) and (GH¢ 256.00). The dominance of Kumasi over Tamale in terms of returns to trade is explained in part by the higher volumes traded. It may also be explained by the relatively higher urbanisation and income levels in Kumasi, which are natural drivers of demand for meat products, thereby increasing demand and purchase. Whereas net profits in Kumasi are almost twice the levels found in Tamale, an evaluation of the return per animal traded, margin, reveals rather interesting facts. For instance, net profits in Kumasi (GH¢ 42.00) per animal differ from those of Tamale (GH¢ 33.00) only by (GH¢ 9.00) per animal for a typical sheep and goat trade enterprise under the survey. At the species level, net profits were higher for sheep relative to goats in Kumasi, averaging (GH¢ 53.00) for sheep and GH¢ about (GH¢47.00). In Tamale, however, the difference is not significant. The Relative contribution of the various size classes may be seen in the lower portion of Appendix 1. The finding of this study is in line with [24] who reported that profit is positively correlated with the volume of start-up outlay investment for sheep marketing.Although the net profit per sheep was significantly higher than goat of all size classes, it was not found in the net marketing margin. The result in Table 9 revealed that an average goat (40.5kg) had a net marketing margin of (24.85%), and the average sheep (59.8kg) was (17.73%). This means that for everyone Ghana Cedi invested in goats and sheep the return on capital was (GH¢ 0.25) and (0.18), respectively. Results across the region highlighted that the net marketing margin for goats was almost the same for return on capital; but in the case of sheep, Kumasi traders made a higher net margin (20.15%) relative to Tamale traders’ margin per sheep (15.78%). Since the goat net margin was higher than the sheep margin, this implies that goat marketing is more stable and possesses more capacity to respond to competition in the enterprise by reducing prices.Table 9. Net Market Margin of Sheep and Goats
 |
| |
|
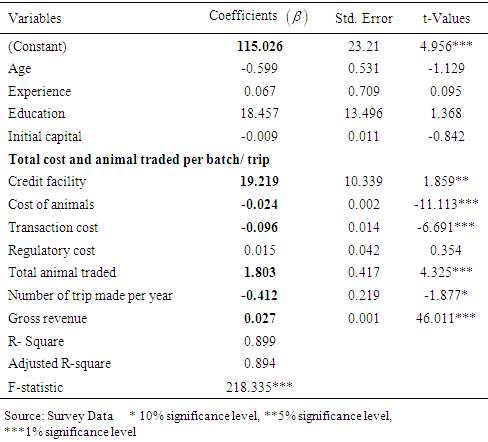
Results from the multiple regression analysis for small ruminants’ performance in Kumasi and Tamale is shown in Table 10. The overall regression model was statistically significant when all the independent variables used table 10 in predicting the dependent variable. That is the F-ratio test was F (11, 217) = 218.335, P <0.001. This means that the exogenous variables have adequately described the dependent variable included in the model and the regression model is a good fit for the data. The adjusted R-squares value of 0.898 implies that (89.8%) of variance in dependent variable is explained by the explanatory variables. The results revealed that access to credit facilities in the study area has positive and significant effect on the performance of small ruminants’ market (p < 0.05). This implies that a one unit increase in credit facility leads to a 19.219 increase in the performance of the small ruminant market in the two cities. Purchasing prices of sheep and goats had a negative and significant impact on the performance of the trade -0.024 (p<0.001). This means that a (GH¢ 1) increase in the cost of animals leads to (0.024) decrease in the performance of the tread in the study area. Similarly, transaction cost also had a negative and significant effect on the performance -0.096 (p<0.001), showing that a (GH¢ 1) increase in transaction cost will decrease the performance of small ruminant market by (0.096) in the study area. Furthermore, number of animal held per batch/trip has a positive and significant effect on the performance 1.803 (p<0.001), implies that an increase of one animal in urban small ruminate trade will lead to (1.803) performance of the trade. Finally, gross revenue shows a positive and significant on the performance of 0.027 (p<0.001). This means that an increase of (GH¢ 1) in gross revenue will lead to GH¢0.027 in the net market margin. This result is in line with; [24].Table 10. Factors that Influence the Performance of Small Ruminate Market
 |
| |
|
4. Conclusions
This study sought to analyze urban small ruminant markets, focusing on the cost performance of the enterprise. The study provided an accurate analysis of the sheep and goats trade in urban centres of Ghana. From the results, most of the traders sell both sheep and goats. The number of animals traded in an average batch was (35) animals. The performance of small ruminants’ sheep and goats’ markets was assessed by considering trading costs and margins. Also, animal costs accounted for the highest cost (85%), whereas transaction and regulatory costs for (15%) of the trading costs per batch. The study also revealed that sheep and goats marketing is profitable ventures in the study areas. However, goat marketers tend to acquire more profits given their high capital outlays as compared to sheep. The results also show that every (GH¢ 1.00) invested in sheep and goats results in (GH¢ 0.18) and (GH¢ 0.25) return on capital, respectively. Comparing this result with the return on saving (22%) charged by the Central Bank of Ghana in 2015, goats trading was better off than saving. Although the net margin for sheep was positive but lower than the returns on savings, the goat net margin was higher than the return on savings. So, sheep and goat traders should place more emphasis on goat trading rather than sheep. Transaction cost, number of animals per batch, gross revenue, and access to credit were principal factors influencing the performance of small ruminant trade. Based on the findings, policymakers and other stakeholders should improve the existing infrastructural facilities and provide loan facilities at a low-interest rate to the trader that will boost the performance of small ruminant markets.
ACKNOWLEDGEMENTS
We greatly appreciate the support of West Africa Productivity Programme Sierra Leone (WAAPP/SL) through the Sierra Leone Agricultural Research Institute (SLARI) for the unflinching support and financial contribution for the success of this research. A more in-depth thanks and appreciation to all staff in the Department of Agricultural Economics, Agribusiness and Extension especially Dr. Kwasi Ohene-Yankyera, Dr. Fred Nimoh, Dr. Robert Aidoo and the Head of department Dr. Dadson Awunyo-Victor for their support.
Appendix 1
Appendix 1. Net profits in SG Trade in Ghana Cedis
 |
| |
|
References
| [1] | R. S. Wubie, G. T. Kassie, A. Haile, J. Wamata and B. Rischkowsky, 2018 “Business Models for Selected Interventions for the Development of Small Ruminant Value Chains in Ethiopia.” International Center for Agricultural Research in the Dry Areas. |
| [2] | H. D. Wodajo, B. A. Gemeda, W. Kinati, A. A Mulem, A. van Eerdewijk and B. Wieland, 2020 “Contribution of small ruminants to food security for Ethiopian smallholder farmers”. Journal of Small Ruminant Research 184 (2020). |
| [3] | F. Adams, K. Ohene-Yankyera, R. Aidoo and C. A. Wongnaa, 2021 “Economic benefits of livestock management in Ghana.” Journal of Agricultural and Food Economics, 9(17). |
| [4] | M. A. Maikasuwa and M. S. Jabo, 2014 “Analysis of sheep and goats marketing in sokoto Metropolis, Sokoto State, Nigeria”. International Journal of Agricultural Science and Veterinary Medicience, 2(1). |
| [5] | A. A. Hatab, M. E .R. Cavinato and C. J. Lagerkvist, 2019 “Urbanisation, livestock systems and food security in developing countries: A systematic review of literature.” Food Security 11:279–299. |
| [6] | F. Adams and K. Ohene-Yankyera, 2014 “Socio-economic Characteristics of Subsistent Small Ruminant Farmers in Three Regions of Northern Ghana”. Asian Journal of Applied Science and Engineering, 3(3). |
| [7] | F. Adzitey, 2013 “Animal and Meat Production in Ghana-An Overview.” Journal of World’s Poultry Research, 3(1). |
| [8] | K. Oppong-Ananne, 2011 “Ghana livestock sector review report”. A report submitted to the Food and Agriculture Organization of the United Nations.” |
| [9] | D. Gambelli, F. Solfanelli, S. Orsini and R. Zanoli, 2021 “Measuring the Economic Performance of Small Ruminant Farms Using Balanced Scorecard and Importance-Performance Analysis: A European Case Study.” Sustainability, (13) 3321. |
| [10] | A. A. Girei, B. Dire, and B. H. Bello, 2013 “Assessment of cost and returns of cattle marketing in central zone of Adamawa state, Nigeria”. British Journal of Marketing Studies, 1(4). |
| [11] | E. R. Martey, R. M. Al-Hassan and J. K. M. Kuwomu, 2012. “Commerciazation of Small Holder Agriculture in Ghana: A Tobit Regression Aanalysis”. African journal of agricultural research 7(14). |
| [12] | F. S. Kassoh, J. Abdulai, O. Nabay and R. Bockarie, 2017 “Determinants of Inlet Choices of Sheep and Goats Traders in Ghana: A Case Study of Kumasi and Tamale.” Journal of Agricultural Science 9(7). |
| [13] | B. Armson, A. B. Ekiri, R. Alafiatayo and A. J. Cook, 2021 “Small Ruminant Production in Tanzania, Uganda, and Ethiopia: A Systematic Review of Constraints and Potential Solutions.” Veterinary Science, 8 (5). |
| [14] | I. Budisatria, S. Gede M. J. U. Henk A. J. van der Zijpp, E. Baliarti, and T. W. Murti, 2008 "Religious festivities and marketing of small ruminants in Central Java–Indonesia." Asian Journal of Agriculture and Development 5, (1362-2016-107701). |
| [15] | D. O. Yawson, B. J. Mulholland, T. Ball, M. O. Adu, S. Mohan and P. J. White 2017. “Effect of climate and agricultural land use changes on UK feed barley production and food security to the 2050s.” Land, 6(4), 74. |
| [16] | F. S. Kassoh, J. Abdulai, K. Ohene-Yankyera, 2017 “Assessing the Structural Arrangement of Small Ruminant Markets in Kumasi and Tamale, Ghana.” International Journal of Science and Research, 319-7064. |
| [17] | K. Amankwah, L. Klerkx, S. Oosting, O. Sakyi-Dawson and A. V. Zijpp, 2013. “Diagnosing constraints to market participation of small ruminant producers in northern Ghana: an innovation systems analysis”. NJAS Wageningen Journal of Live Sciences. |
| [18] | Y. Aklilu, P. D. Little, H. Mahmoud and J. McPeak, 2013 “Market access and trade issues affecting the drylands in the Horn of Africa. Kenya, Kenya: International Livestock Research Institute (ILRI)”. |
| [19] | T. O. Williams, B. Spycher and I. Okike, 2003 “Improving Livestock Marketing and Intra-Regional Trade in West Africa: Determining Appropriate Economic Incentives and Policy Framework”. International Livestock Research Institute (ILRI). Nairobi, Kenya. |
| [20] | Ghana Statistical Service (GSS), 2010. Ghana Living Standards Survey Round 5 (GLSS5). GSS, Accra, Ghana”. Retrieved from http://www.statsghana.gov.gh/docfiles/glss6/GLSS6_Main%20Report.pdf. |
| [21] | I. Fuseini, J. A. Yaro and G. A. Yiran., 2017. City profile: Tamale, Ghana. Cities, 60, 64-74. |
| [22] | K. Zewdie, 2014 “Assessment of the Performance of the Goat Marketing System in Afar Region, Ethiopia (Doctoral Thesis, Mekelle University). |
| [23] | J. A. Afolabi, J.A., 2007. Evaluation of Poultry Egg Marketing in South-Western Nigeria. International Journal of Poultry Science, 6(5). |
| [24] | A. Saleh, Y. Adamu. I. Mohammed, K. Hamidu, S. Yau and M. Hussaini Sani, 2019 “Analysis of Market Performance of Small Ruminants in Gombe State Nigeria”. Journal of Agricultural Science and Engineering, 5(1). |

 Abstract
 Reference
 Full-Text PDF
 Full-text HTML