Koffi Yovo
Department of Agricultural Economic, Agricultural School, University of Lome, Lome, Togo
Correspondence to: Koffi Yovo, Department of Agricultural Economic, Agricultural School, University of Lome, Lome, Togo.
| Email: |  |
Copyright © 2021 The Author(s). Published by Scientific & Academic Publishing.
This work is licensed under the Creative Commons Attribution International License (CC BY).
http://creativecommons.org/licenses/by/4.0/

Abstract
Since the liberalization took place in 1996 in Togo, smallholder coffee and cocoa producers have experienced large fluctuations in prices, resulting in falls of their incomes. This paper assesses the extent to which the price volatility affects the supply of coffee and cocoa and how producers react given the nature of price volatility. To this end, we used the Generalized Autoregressive Conditional Heteroscedastic (GARCH) model to assess producers’ expectations about expected price and expected price volatility. The symmetric and asymmetric GARCH models were tested and the asymmetric and nonlinear GARCH model appeared to be particularly appropriate to describe the coffee and cocoa prices response. The coffee and cocoa price volatility was found to have a high negative effect on production. The result indicated that coffee and cocoa producers are risk averse. Asymmetric effect was detected on price volatility and farmers seem to respond differently depending on whether the price decrease or increase. The supply price elasticities were found to be positive but the high negative effect of price volatility in coffee and cocoa production is likely to affect production decisions and is probably an important reason why there is stagnation in coffee and cocoa production during the last decade. There is a need to explore innovative way to mitigate the adverse effects of price volatility.
Keywords:
Coffee and cocoa supply, Price volatility, Asymmetry, GARCH
Cite this paper: Koffi Yovo, The Response of Coffee and Cocoa Supply to the Price Volatility: The Case of Togo, American Journal of Economics, Vol. 11 No. 2, 2021, pp. 49-56. doi: 10.5923/j.economics.20211102.01.
1. Introduction
In recent decades, changes in commodity markets have put producers in critical situation. The international context seems more and more unfavorable to producers. Indeed, the process of liberalization initiated since the 1980s has contributed to the transmission of price volatility from the world market to local markets (Rezitis and Stavropoulos, 2012). The volatility of international agricultural prices, usually defined as the average of price deviations from the trend, turned out to be much higher, following agricultural market liberalization which was accompanied by the removal of price stabilization mechanisms. Thus producers, whose capacity to manage shocks is low, are more exposed to international price volatility (Subervie, 2008). One of the main threats faced by producers in developing countries nowadays, concerns both the sharp drop of international price and by extension, the producer price of basic agricultural products. If these prices cannot be anticipated, production decisions cannot be made efficiently. In addition, small producers generally do not have effective insurance instruments to cope with large falls in income, which contributes to their vulnerability.Price volatility represents an important supply risk factor, especially in agricultural export products. Agricultural prices tend to be more volatile due to seasonality, inelastic demand, and production uncertainty (Assefa et al. 2015, Taya 2012) and also because many agricultural export products prices, such as coffee and cocoa, are determined on international markets. Price fluctuations translate into a significant price risk. Thus, an increase in price volatility implies higher uncertainty about future prices, a fact that can affect producers’ welfare, especially in the absence of a hedging mechanism. In the Togolese context, since the liberalization that took place in 1996, smallholder coffee and cocoa producers have faced large fluctuations in prices, resulting in falls in income. Some actors of rural sector think that the stagnation of production observed over the past ten years is due to the response of producers to the volatility of coffee and cocoa prices (Yovo, 2019). The objective of this paper is to analyze the effect of price volatility on the supply of coffee and cocoa. Specifically, the study firstly, assesses the extent to which the price volatility affects the supply of coffee and cocoa; secondly, to appreciate the nature of producer price volatility of coffee and cocoa; and third, to know how producers react given the asymmetric nature or not of price volatility.These research subjects are of capital importance for the Togolese economy given the place occupied by coffee and cocoa in the Togolese economy. Indeed, the coffee and cocoa sectors represent only 2% of Togolese GDP, but they are very important from a social and economic point of view, supporting a large number of direct and indirect actors, including 32,000 producer households. Second and third export crop after cotton, coffee and cocoa represent a source of income for rural households (Yovo, 2019). The coffee and cocoa remain strategic crops for Togo due to the fact that they bring a substantial amount of foreign currency into the country and also because they create a lot of jobs through the large amount of labor required by the different value chains. In 2016, the two sectors generated 32,000 direct jobs and 93,000 indirect jobs. Forecasts for the year 2030 indicate 41,700 direct jobs and 125,000 indirect jobs. The coffee and cocoa sectors also allow the development of production areas in terms of roads and various socio-economic infrastructures (Yovo, 2018).The rest of the paper is organized as follow. In the next section, the article presents the literature review on supply response and volatility. Section 2 relate to methodology depicts the theoretical and empirical model of the response to the price volatility and describes the data. The third section discusses the results and draws a conclusion.
2. Literature Review
Supply response analysis has long been a matter of interest in agricultural economics. Several authors have assessed the effect of price uncertainty in agricultural supply response. For example, Kane and Piot-Lepetit (2017) analyze the supply response to price and volatility of major staple crops grown by agricultural households in Cameroon. The results from the autoregressive distributed lag (ARDL) bounds testing approach suggest that farmers are not responsive to economic incentives such as prices in short-run. Moreover, results show that producers respond to price volatility by increasing the area under cultivation and reducing investments in improving yields. As for Rezitis and Stavropoulos (2009), they have estimated supply response of the Greek pork industry using alternative volatility models. In their study, the authors used the Generalized Autoregressive Conditional Heteroskedasticity (GARCH) process to characterize the time varying attributes of expected price and price volatility of pork market. In order to investigate the existence of possible asymmetry in the behavior of price volatility, the authors used an asymmetric GARCH models. Asymmetric price volatility is observed when different volatility is recorded between an increase and a decrease of price of the same amount. In the case of the agricultural markets, the existence of price asymmetry can provide useful information about possible market power. For example, the presence of positive asymmetric price volatility suggests that producers react faster to price increases due to ‘‘good news’’ than in case of ‘‘bad news’’ when the price decreases. This behavior implies that producers may have some market power, allowing them to take advantage of positive shocks by immediately increasing prices, while, in case of negative shocks, delaying price decreases. Negative asymmetric price volatility suggests that producers’ position in chain is weak and they are unable to exploit any ‘‘good news’’ by immediately increasing prices, while in the case of ‘‘bad news,’’ they are instantly forced to decrease prices. The hypothesis of asymmetric price volatility was also analytically investigated by Engle and Ng (1993) on finance markets and by Zheng et al. (2008) on the U.S. food market.The contribution of the current paper in the existing literature is to investigate the hypothesis of asymmetric price volatility and to see if the asymmetric GARCH model is appropriate to describe the cocoa and coffee response in Togo, one of the countries in West Africa that produces coffee and cocoa.
3. Methodology
The present section describes the theoretical model, the empirical model and the data.
3.1. Theoretical Model
The coffee or cocoa supply equation model can be described as: | (1) |
Where  is the coffee or cocoa production.
  is the expected price,
  is the expected price variance which measures volatility,
  is a vector of independent variables,
  is a mean zero normally distributed error term. Then the GARCH (p, q) process is used to generate the variables
  and
and  given as:
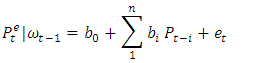 | (2) |
 | (3) |
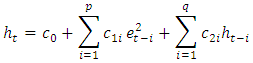
Where  The autoregressive conditional heteroskedastic (ARCH) model of Engle (1982) allows the conditional variance,
  to depend on past volatility measured as a linear function of past errors,
  while leaving unconditional variance constant. Thus, in Equation (2),
  is a discrete time stochastic error, and
  is the information set of all past states up to the time t-1.Bollerslev (1986) developed the generalized ARCH (p, q) [GARCH (p, q)] specification. Following this specification,
  is defined as in Equation (3), which is called GARCH conditional variance equation. According to Equation (3), the conditional variance
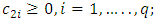
  is specified as a linear function of p lagged squared residuals and its own q lagged conditional variances. As the variance is expected to be positive, the coefficients
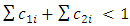
  are always positive. Also the stationarity of the variance is preserved by the restriction
 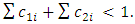 The predictions of
  and
and  generated by the GARCH model are used directly to estimate supply Equation 1 (Holt and Aradhyula, 1990). In particular, the authors used the simple symmetric GARCH model to generate the variables of expected price and price volatility, which are introduced in the supply response model. Although the simple GARCH model has been found to provide a good representation of volatility process, the literature offers many alternative specifications. A very important specification has to do with asymmetry. The asymmetric effect is observed when a different volatility is recorded in case of a fall in price or in case of an increase (i.e., bad and good news). The standard GARCH model used above cannot capture the asymmetry as far as the error term, et, which represents the unexpected price shock, enters the conditional variance equation as a square, indicating thus that there is no difference whether the price shock is positive or negative. Asymmetric GARCH model takes account of skewed distributions in which good news and bad news have a different effect on volatility. A characteristic asymmetric GARCH model is the nonlinear asymmetric GARCH (NAGARCH) developed by Engle and Ng. In this model Equations (2) and (3) presented above are described as:
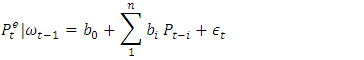 | (4) |
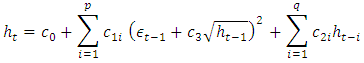 | (5) |
Where 
 This model defines volatility as a nonlinear asymmetric function of past periods’ shocks and volatility, and if
  then asymmetry is present. Thus, C3 is the asymmetry parameter and if C3 is positive, then a positive shock causes more volatility than a negative shock of the same size.Besides the NAGARCH model described above, Equations (4) and (5) have been properly modified to specify four additional symmetric and asymmetric GARCH models, in order to detect which one of them fits better. Finally, the 4 GARCH models estimated in this study are: linear symmetric GARCH developed by Bollerslev (1986), nonlinear symmetric GARCH (NGARCH) developed by Engle and Bollerslev (1986), asymmetric GARCH (AGARCH) developed by Engle (1990), nonlinear asymmetric GARCH (NAGARCH) developed by Engle and Ng (1993).
3.2. Empirical Model
The coffee and cocoa response equation (1) is specified as: | (6) |
Where: is the coffee or cocoa production in time t;
 is the expected coffee or cocoa price in time t;
  is the expected price variance which measures volatility;
 is a trend component;
 : Real Exchange Rate in time t;
 is real price of pesticide;
 is the quantity of rain fallen in time t;
 is error termThe expected price,
  and the price volatility term,
  are considered to be important risk factors of supply. A trend component (Trend) is used to capture technological change in the production process. The variable
  , the real exchange rate in year t is introduced in the model in order to capture the effect of international price;
  is the quantity of rain fallen in the year, as climate factor affecting the supply. The specification of the expected price equation is given as:
 | (7) |
Where: is the expected coffee or cocoa price in time t;
  is the coffee or cocoa price in time t-1;
 is the coffee or cocoa price in time t-2;
  is a trend component;
 is error termTwo lags were found sufficient to capture the effect of past price in equation (8). The trend component (Trend) is used to capture the behavior of prices during the sample period. Equation (8) is estimated for all the four different GARCH models retained for the analysis. Thus, the variance equation of the GARCH (1, 1) model is used and it is given by:
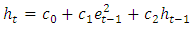 | (8) |
The equation (8) is modified according to the four specifications of GARCH retained for the analysis.
3.3. Data Description
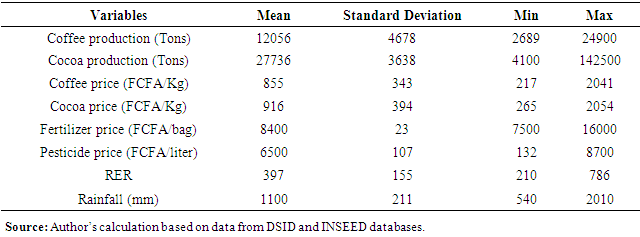
Data used in this study are annual time series for the period of January 1980 to 2018. They are drawn from three different sources. The coffee and cocoa quantities, the rainfall amount, the producer prices of coffee and cocoa were extracted from the database of DSID, the National Office of Statistics, Informatics and Documentation which is the department of Agriculture Ministry in charge of agricultural statistics. The price of fertilizer, the price of fungi and the real exchange rate are extracted from National Institute of Economic Statistics and Demographic Studies (INSEED) database. All variables were transformed into logarithms and all prices were deflated by the consumer price index (1990).Table 1 in appendix shows descriptive statistics of variables related to the models estimated. It appears that during the period 1980-2018, coffee production fluctuated between 2,689 and 24,900 tons with an annual average of 12,056 tons. As for cocoa, its production fluctuates more, between 4,100 and 142,500 tons with an annual average of 27,736 tons. The coffee and cocoa prices also experienced large fluctuations during the period with an annual average price of 855 FCFA / Kg for coffee and 916 FCFA / Kg for cocoa.
4. Empirical Result and Discussion
Figure 1 in appendix depicts the evolution of coffee and cocoa price volatility from 1960 to 2018. In general, price volatility increased from 3-15% before liberalization to 30-40% with liberalization. It appears that the volatility of coffee and cocoa prices, defined as the average of the price deviations from the trend, turned out to be much higher following the liberalization of the two markets. This volatility increase can be explained by the removal of price stabilization mechanisms. A similar effect on agricultural price volatility due to market liberalization was found by Subervie (2008) who concluded that in the developing countries, agricultural liberalization policy caused an increase in price volatility for some agricultural products such as coffee and cocoa. Price volatility represents an important risk factor of supply, especially in agricultural products. An increase in price volatility implies higher uncertainty about future prices, a fact that can affect producers’ welfare especially in the absence of a hedging mechanism.To test the effect of price volatility on coffee and cocoa supply, we first performed the unit root test then we estimated expected price equation and supply equation with alternative GARCH model.
4.1. Unit Root Test
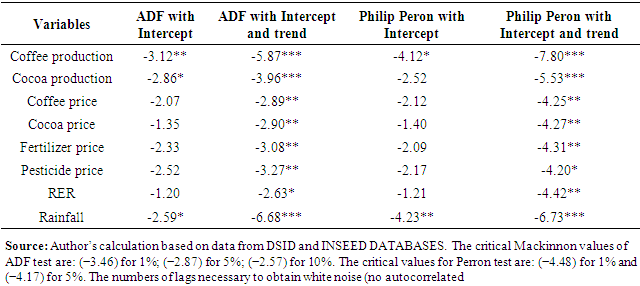
Table 2 in appendix provides the results of unit root tests on the data. Augmented Dickey Fuller (ADF) and Phillips-Perron (PP) tests are evaluated. The results show that all the variables are stationary when we consider the trend. These results justify the inclusion of time trend (Trend) in estimated equations of supply and expected price.
4.2. Estimations Results
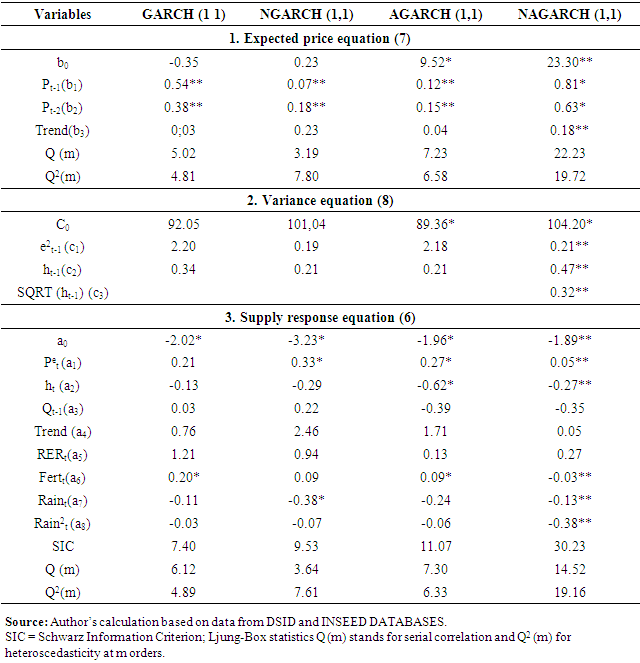
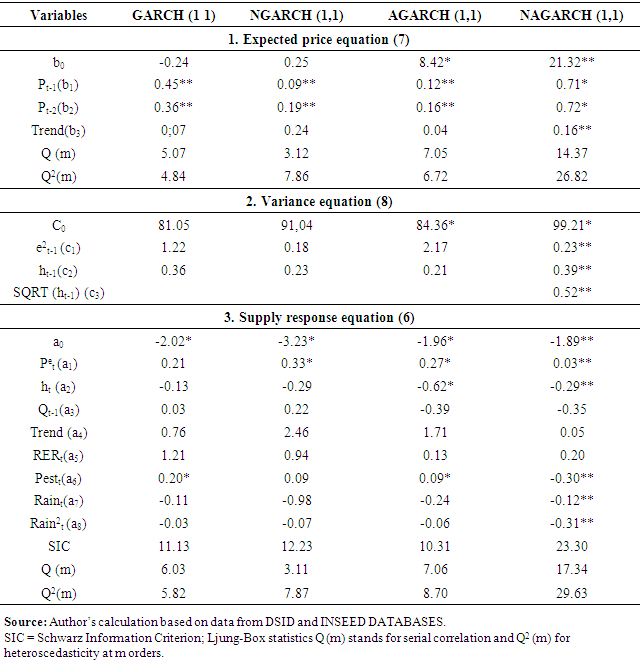
The purpose of the GARCH, NGARCH, AGARCH and NAGARCH tests of supply response and expected price equation is to identify the effects of positive and negative changes in price on coffee and cocoa supply in Togo. The results of the alternatives GARCH estimation for the expected price equation and supply response are shown in Table 3 and table 4 in appendix for coffee and cocoa respectively. It appeared necessary to separate the two results because of the specificity of each product. Firstly, the trend and the magnitude of the prices series are not the same. Secondly, the production technology is also not the same. To produce coffee, producers use fertilizer whereas for cocoa production pesticide is required as factor production. Despite the apparent differences, the estimation results are similar for the four alternative GARCH models.In order to evaluate the effect of price volatility on the coffee and cocoa response, the expected price and variance equations are estimated first before executing the supply response equations. As a result, the expected real producer price  and expected variance of real producer price
  can be included in supply response equation as one of independent variables. Tables 3 and 4 present the estimated parameters of the supply response and price equations for the alternative GARCH models. Residual diagnostic tests are performed in order to check the explanatory power of the four alternative supply-price systems. In particular, Ljung-Box Q(m) statistics are performed for the standardized residuals and squared standardized residuals in order to check upon serial correlation and heteroscedasticity, respectively, and the Schwarz information criterion (SIC) is also used to rank the models because it allows a degree of freedom free comparison of the models’ performance. As aforementioned, four GARCH models are estimated in this study: the linear symmetric GARCH; the nonlinear symmetric GARCH (NGARCH); the asymmetric GARCH (AGARCH) and the nonlinear asymmetric GARCH (NAGARCH).The residual tests for the supply response equation for each of the four models presented in Tables 3 and 4 in appendix indicate that the best performance belongs to NAGARCH model which presents no heteroscedasticity for all the examined lags at the 5% level of significance, no autocorrelation at the 5% level of significance. With regard to the price equation, residual tests presented in the two tables, all four models present no heteroscedasticity and no autocorrelation for all the examined alternatives at the 5% level of significance. Thus, the residual tests in both supply and price equations indicate that NAGARCH model achieves the best performance. Finally, a comparison of SIC values indicates that the NAGARCH model is the most appropriate one to describe the supply-price equation system for coffee and cocoa production.Analyzing the estimated parameters of the NAGARCH model, presented in Table 3 in appendix, it is apparent that the magnitude of c2 is larger than the magnitude of c1, that is, 0.47 and 0.21 respectively. The size of c1 and c2 parameters determines the short-run dynamics of price volatility. Since c2 has a larger value, this indicates that volatility is persistent and shocks to conditional variance take a long time to die out. A similar result is obtained for cocoa in table 4.The asymmetry factor, c3, is statistically significant for the two products, indicating the presence of asymmetric price volatility for coffee and cocoa markets. This means that a negative shock does not causes equal price volatility with a positive shock of the same size. The coffee and cocoa producers seem to react differently in case of ‘‘bad news’’ (which pushes them to decrease prices) as in case of ‘‘good news’’ (when they increase prices). The fact that producers do not respond equally to unexpected price increases and decreases, suggests that there is evidence of market power. In other words, producers appear to react asymmetrically in case of ‘‘good’’ or ‘‘bad’’ news. This result is in line with Yovo (2019) findings relate to coffee and cocoa market in Togo. Using tests based on the TAR model, Yovo (2019) demonstrated the existence of asymmetric transmission of international price shocks to producer prices of coffee and cocoa in Togo. The author showed that domestic prices for coffee and cocoa respond less quickly to increases in international prices than to decreases, confirming the thesis of producers relating to the inflexibility in the transmission of increases in international prices of coffee and cocoa in Togo. Furthermore the study highlighted how commercial intermediaries influence the dynamics of adjustment of the producer price, introducing into the transmission between prices an asymmetry clearly unfavorable to producers. The asymmetry in price transmission had been also highlighted by Yovo (2017) in cereals sub sector in Togo.Table 3 and 4 in appendix presents also the estimated parameters of the supply response equation of the NAGARCH model. All the estimated coefficients have the theoretically expected signs and they are significant at 5%. Short-run supply price elasticity given by the estimated coefficient is small but still positive, that is, a1= 0.05 and 0.03 respectively for coffee and cocoa, indicating that an expected coffee and cocoa prices increase induce low reaction of producers. In line with the literature who finds that generally in Africa, farmers react slowly to prices increase. Some studies showed that the price elasticities of the aggregate supply reaction function are generally low, varying between 0.2 and 0.4. Other studies indicated that the elasticities of aggregate supply to price incentives vary between 0.3 and 0.9.and are lower than the elasticities of the other variables incorporated in a supply model (Koffi-Tessio, 2000).Moreover, the sign of the estimated coefficient for the expected price volatility is negative, that is, a2 = -0.27 for coffee and –0.29 for cocoa. The sign is what is expected. This result means that the coffee and cocoa supply can decrease respectively for 27% and 29% if the volatility doubles. This is relatively important, if we considered that the price volatility can easily vary from 5% à 10%. It can be concluded that price volatility is a serious risk factor in the coffee and cocoa production. This result is in accordance with Subervie (2008) who found similar values. In fact, Subervie (2008) estimated the elasticity of aggregate supply with respect to the price volatility of 10 agricultural products including coffee and cocoa in 25 countries over the period 1991-2005, a period when most agricultural sectors were liberalized. The author obtained an elasticity of -0.23 for the short term and -0.37 for the long term.Furthermore, the coefficients of the fertilizer price for coffee production and the pesticide price for cocoa production are respectively a6 = -0.03 and -0.06 are negative but small. These results indicate that these production costs are less important. The rainfall affect negatively the coffee and cocoa supply. The coefficients are respectively a7 = -0.13 and -0.12. These results show that beyond or below a threshold level of rainfall, the supply decreases indicating that this climate variable is not an insignificant risk factor of coffee and cocoa production.Overall, the important constraint which faced farmers, in their attempt to expand their farm size and invest in more productive technologies in order to boost their production, is the price volatility and is probably an important reason why there is a decline in coffee and cocoa production during the last two decades. There is a need to explore innovative way to mitigate the adverse effects of price volatility. For example, policymakers can improve producers’ flexibility in response to price changes by supporting contract farming and price insurance mechanisms.
5. Conclusions and Policy Implication
Since the liberalization took place in 1996 in Togo, smallholder coffee and cocoa producers have experienced large fluctuations in prices, resulting in falls of their incomes. This paper assesses the extent to which the price volatility affects the supply of coffee and cocoa and how producers react given the nature of price volatility. To this end, we used data from DSID and INSEED, the national statistical databases. The empirical analysis used the GARCH process to model producers’ expectations about expected price and expected price volatility. Several different symmetric and asymmetric GARCH models were tested and the NAGARCH model appeared to be particularly appropriate to describe the coffee and cocoa prices response. Coffee and cocoa price volatility was found to have a negative effect on production, a result indicating that coffee and cocoa producers are risk averse. Asymmetric effect was detected on price volatility and producers seem to respond differently in case of decrease prices as in case of increase prices. The supply price elasticities were found to be positive. The Price uncertainty appears to have a strong negative effect on coffee and cocoa producers, which might be an important constraint in their attempt to expand their farm size and invest in more productive technologies. This high negative effect of price volatility in coffee and cocoa production is likely to affect production decisions and is probably an important reason why there is a decline in coffee and cocoa production during the last two decades. There is a need to explore innovative way to mitigate the adverse effects of price volatility. For example, policymakers can improve producers’ flexibility in response to price changes by supporting contract farming and price insurance mechanisms.
Appendix
Table 1. Descriptive statistics
 |
| |
|
Table 2. Results with unit roots tests
 |
| |
|
Table 3. Results of coffee Price Volatility and Supply Response
 |
| |
|
Table 4. Results of cocoa Price Volatility and Supply Response
 |
| |
|
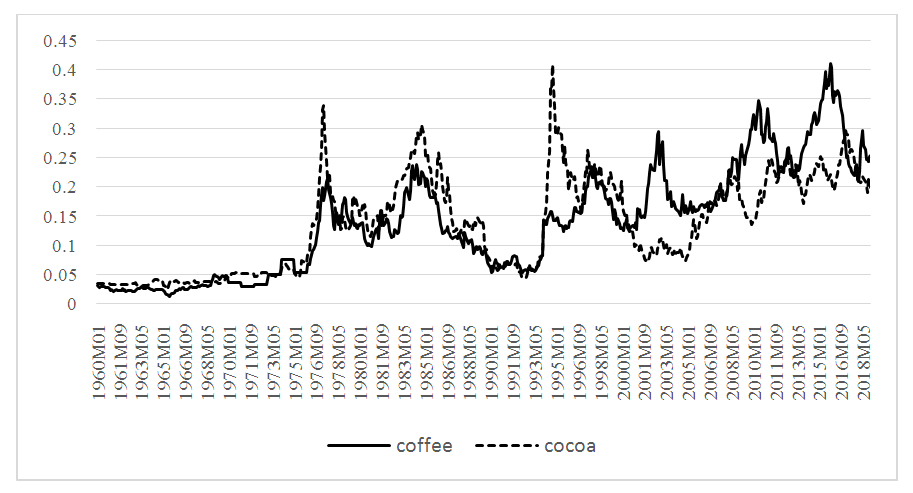 | Figure 1. Evolution of coffee and cocoa prices volatility from 1960 to 2018 in Togo (Source: DSID and INSEED databases) |
References
| [1] | Assefa, T.T., Meuwissen M. P. M., Oude Lansink A.G.J.M. 2015. Price Volatility Transmission in Food Supply Chains: A Literature Review. Agribusiness, 31, 3–13. https://doi.org/10.1002/agr.21380. |
| [2] | Bollerslev, T. 1986. Generalized Autoregressive Conditional Heteroskedasticity. Journal of Econometrics, 31, 307–327. https://doi.org/10.1016/0304-4076(86)90063-1. |
| [3] | Engle, R.F., Ng V. 1993. Measuring and Testing the Impact of News in Volatility. The Journal of Finance, 48, 1749–1778. https://doi.org/10.1111/j.1540-6261.1993.tb05127.x. |
| [4] | Engle, R.F. 1990. Discussion: Stock Market Volatility and the Crash of 87. Review of Financial Studies, 3, 103–106. |
| [5] | Engle, R. F. 1982. Autoregressive Conditional Heteroskedasticity with Estimates of the Variances of the United Kingdom Inflation. Econometrica, 50, 987–1007. |
| [6] | Engle, R.F., Bollerslev T. 1986. Modeling the Persistence of Conditional Variances. Models: A Multivariate Generalized ARCH-M Approach. Journal of Empirical Finance, 5, 99–129. https://doi.org/10.1016/S0927-5398(97)00014-5. |
| [7] | Holt, M.T., Aradhyula S. V. 1990. Price Risk in Supply Equations: An Application of GARCH Time-Series Models to the U.S. Broiler Market. Southern Economic Journal, 57, 230–242. |
| [8] | Kane, G. K. and Piot-Lepetit I. 2017. Agricultural supply response to food price volatility in Cameroon. In Cameroon in the 21st Century: Prospects and Challenges - Volume 2, Nova Science Publishers, Inc. |
| [9] | Koffi-Tessio, E. 2000. Incitations et offre du coton au Togo. Une estimation économétrique. Économie rurale, 257, 78-88. DOI: https://doi.org/10.3406/ecoru.2000.5183. |
| [10] | Nelson, D. 1991. Conditional Heteroscedasticity in Asset Returns: A New Approach. Econometrica, 59, 347–370. |
| [11] | Rezitis A.N. and Stavropoulos K.S. 2012. Greek Meat Supply Response and Price Volatility in a Rational Expectations Framework: A Multivariate GARCH Approach. European Review of Agricultural Economics, 39, 309-333. https://doi.org/10.1093/erae/jbr038. |
| [12] | Rezitis, A., Stavropoulos K. 2009. Modelling pork supply response and price volatility: The case of Greece. Journal of agricultural and applied economics, 41, 145-162. DOI: 10.22004/ag.econ.48764. |
| [13] | Subervie, J. 2008. The variable response of agricultural supply to world price instability in developing countries. Journal of Agricultural Economics, 59, 72-92. https://doi.org/10.1111/j.1477-9552.2007.00136.x. |
| [14] | Taya, S. 2012. Stochastic model development and price volatility analysis. OECD food, agricultural and fisheries working papers 57, OECD Publishing. |
| [15] | Yovo K. (2018): Evaluation des besoins en capital humain le long des chaines de valeurs en agriculture au Togo. Rapport de mission, Ministère de l’Agriculture de l’Elevage et de l’Hydraulique. |
| [16] | Yovo, K. 2019. Transmission of international price shocks and asymmetry: the case of coffee and cocoa in Togo. Paper presented at the 4th CAMES International conference held from 01 to 04 October 2019 in Ouidah, Benin. |
| [17] | Yovo, K. 2017. Spatial Price transmission and Asymmetry in the Togolese maize markets. American Journal of Economics, 2, 76-87. https://doi:10.5923/j.economics.20170702.02. |
| [18] | Zheng, Y., Kinnucan H.W., Thompson H. 2008. News and Food Price Volatility. Applied Economics, 40, 1629–1635. https://doi.org/10.1080/00036840600892910. |

 Abstract
 Reference
 Full-Text PDF
 Full-text HTML