-
Paper Information
- Previous Paper
- Paper Submission
-
Journal Information
- About This Journal
- Editorial Board
- Current Issue
- Archive
- Author Guidelines
- Contact Us
American Journal of Economics
p-ISSN: 2166-4951 e-ISSN: 2166-496X
2020; 10(6): 418-424
doi:10.5923/j.economics.20201006.11
Received: Aug. 15, 2020; Accepted: Sep. 12, 2020; Published: Sep. 26, 2020

Impact of Human Educational Capital on Economic Growth in Republic of Congo
 Abstract
 Reference
 Full-Text PDF
 Full-text HTML
Bambi Prince Dorian Rivel 1, Ossou Ndzila Fred Nelson 1, Ying Yirong 2
1Ph.D. Researcher in Finance at Shanghai University, Shanghai, China
2Professor in College of Economics, Shanghai University, Shanghai, China
Correspondence to: Bambi Prince Dorian Rivel , Ph.D. Researcher in Finance at Shanghai University, Shanghai, China.
| Email: |  |
Copyright © 2020 The Author(s). Published by Scientific & Academic Publishing.
This work is licensed under the Creative Commons Attribution International License (CC BY).
http://creativecommons.org/licenses/by/4.0/

The present work aims to determine the contribution of different levels of education to economic growth in Congo Brazzaville. The analysis of these results shows that there is a positive relationship between human capital and short-term economic growth, validating our hypothesis that human capital positively influences economic growth. On the other hand, in the long term, human capital does not explain economic growth in either primary or secondary education. In this perspective, Pritchett (2001), in his article, wondering where did the education go? Or, in other words, what was the use of public spending education, has once again provided the following explanations: - the increase in individual wages can lead to a decline in the country if new graduates head in mass towards unproductive sectors such as public administration; - The quality of education can be so low that there are not the skills needed to achieve economic growth. This analysis does not spare the Republic of Congo whose largest employer is the civil service and whose level of education is gradually deteriorating.
Keywords: Human Capital, Economic Growth, Education, GDP
Cite this paper: Bambi Prince Dorian Rivel , Ossou Ndzila Fred Nelson , Ying Yirong , Impact of Human Educational Capital on Economic Growth in Republic of Congo, American Journal of Economics, Vol. 10 No. 6, 2020, pp. 418-424. doi: 10.5923/j.economics.20201006.11.
Article Outline
1. Introduction
1.1. Background and Justification
- The development strategies implemented by a state have always aimed at finding key elements allowing to create more wealth in the country in order to considerably improve the well-being of the populations. Among the search for its elements, much more emphasis was placed on the accumulation of physical capital, labor, the exploitation of natural resources, institutions.Many of the African countries, including the Republic of Congo at the end of their independence, have started the process of industrialization. To this, the majority of African leaders had a strong certainty that this industrialization was essential to reduce dependence on developed countries. Given the fact that the economy of African countries was very archaic at the end of their independence, African leaders expected that new industrialization would accelerate the process of transition from a traditional economy to a modern and diversified economy, improving living conditions populations and their income. However, the appearance and contraction of possible debts due to successive oil shocks has led to a major slowdown in industrialization linked to imports. To remedy this situation, a structural adjustment program was implemented in the 1980s to boost the economy of African countries, unfortunately African countries have left without assistance the specific actions they should take to promote industrialization and for the elimination of factors hindering exports and high-end specialization according to comparative advantage. The idea was that competitive pressures made economic activity dynamic by favoring the survival of the strongest; unfortunately this policy has not worked.Assistance in September 2000 in the formulation of the Millennium Development Goals, whose deadline was set for 2015. With the encouragement of the United Nations, these objectives have been strongly endorsed by most African countries, including the Republic of Congo. However, by the set deadline, these objectives remain far from being achieved by the latter. In September 2015, the redefinition of the global development strategy, in particular the declaration of the Sustainable Development Goals, symbolizes a new impetus for these African countries, since many of them did not take advantage of the period marked by strong growth thanks to the exploitation of natural resources (the export of petroleum, minerals, etc.), to promote the achievement of the millennium development goals. This is certainly due to the lack of real consideration of an inevitable factor for sustained development, a factor which is none other than human capital. If not, in the areas where it was taken into account, the following questions would make no sense: "Why has the wealth produced in developed countries increased fourteen-fold since 1820? Why has Japan grown much faster since the Second World War than Western countries? 1 ". This is what has certainly led Africa to become aware and to want to take matters into its own hands by developing, through its development bank, a 2014-2018 human capital strategy. This strategy consists of achieving inclusive and green growth based on the high qualification of Human Capital. This report indicates, according to the projections of the African Development Bank (May 2014, p.1), that the African population which is 1 billion inhabitants should reach 2.3 billion inhabitants in 2050 and this, mainly youth. And in the face of this, African countries will gain from following the example of the countries of Southeast Asia by investing massively at all levels of education in order to hope to have a substantial impact on human capital and to stimulate the transformation of industrial region.The predominant role of the link between human capital and economic growth was mentioned by Adam Smith (1776), which first allowed T. Schultz (1961) and then G. Becker (1964) to propose theoretical and empirical analyzes on the link between investment in human capital and remuneration.Investment in Human Capital remains today one of the main themes of economic policy in both developed and developing countries. It seems to provide solutions to several development problems that policy makers have faced in recent decades. These include increasing inequality and the impoverishment of the population, rising unemployment.
1.2. Problematic
- The development economy in its many questions tries to understand why some countries are poor and others are rich. The necessary need for human capital already dates back to (1776) in the Wealth of Nations which stipulated that investment in capital increases future productivity which therefore affirmed the importance of the role of education and training as a determinant of individual productivity and income. In the second half of the 20th century, the works of Mincer (1958) Schultz (1961) and Becker (1964) returned to the importance of human capital and proposed an in-depth theory of human capital. Becker (1964) proposed a formalization of the conceptual framework of the theory of human capital. It formalizes the choices of education as rational choices of optimizing agents, which compare over the duration of their life cycle, the present value of the gains to be expected from education and the costs incurred.Republic of Congo, which is one of the countries of Central Africa, is very closely concerned by this strategy of the African Development Bank on human capital since it is one of the countries which have not been able to reach the Millennium Goals for Development (MDG). Despite the strong will and motivation of the State to diversify the economy by instituting the National Development Program (PND 2012-2016) - through which it intends to improve the quality of its human capital in order to move from an economy of In a knowledge-based economy, the situation remains worrying. The proof is that the Congolese economy is essentially based on the exploitation of natural resources, in particular petroleum which contributes to more than 50% of the GDP from the 1990s to the present day. Therefore, can we hope that taking into account human capital will help the Congo achieve sustained growth? This is the question that this study sets out to answer.
1.3. Objectives of the Study
- To achieve this, the present work have the general objective of seeing the impact of human capital on economic growth in the Republic Congo through an analysis based on the period from 1980 to 2016, taking into account the characteristics of the series used. Specifically, it is about:• Research the contribution of primary education to improving real per capita income; • See the influence of secondary education on real GDP per capita;
2. Literature Review
- Here I need the thesis and the antithesis of the literary review, that is to say the assertion of certain authors and the disaffirmation of other authors of the impact of educational human capital on economic growth and then take the summary part).Synthesis of the literature reviewAt the end of this review of the relevant literature, Two (2) main lessons emerge from the theoretical and empirical studies: The first is that the theoretical studies suggest that economic growth can be explained by several factors, notably human capital (education). It goes without saying that economic growth requires a good knowledge of the most determining factors in order to orient policies effectively; such is the interest of this work which is a contribution to the debate on the capacity of human capital to influence economic growth in developing countries in general and in the Republic of Congo in particular. The second lesson concerns the results of empirical work. These suggest that the relationship between human capital and economic growth is not linear. Results differ from region to region, from country to country, and even from period to period. In this context, such results cannot be generalized, because each region or country having its specificity. Also, does not examining this relationship in the case of the Republic of Congo require special research? Furthermore, it can be seen that the causal link between education and economic growth is not always clearly defined.Does a country have a high growth rate because its population is highly educated, or does a country have a highly educated population because it benefits from a high growth rate? We can say that the role of education in economic growth from a review of the literature is clearer. It is therefore necessary for the study that we have conducted to set the theoretical referential framework in which we are registered and to show what place education occupies in the approach that we adopt. Our theoretical frame of reference is therefore the responsibility of the endogenous growth model developed by Lucas at the macroeconomic level. Our empirical choice refers to the report on education and growth: Philippe Aghion and Elie Cohen, (2003) show that it is at primary and secondary education that education can contribute to economic growth in countries far technological frontier such as the countries south of the Sahara in general and the Congo in particular. Higher education remains the essential level of economic growth for a higher level of development, taking as a condition that education cannot have 'positive effects on economic growth only if the political-economic-social environment is favorable to it (Claude Diebolt, 2001).
2.1. Measuring Human Capital and Economic Growth
2.1.1. Human Capital Measurement
- There are several types of capital stock that influence well-being. The measurement problem arises according to the nature of the capital. Here, we will focus on the stock of human capital. Measuring human capital remains difficult to achieve despite its importance. Currently, there are different methods for measuring the existing capacity of an individual's stock of knowledge.According to Wössman (2000), there is a review of human capital indicators. The most used measures as an indicator of human capital are: • The increased work of education (skilled and unskilled work, for example) found in the works of Denison (1967) and Jorgenson (1995).• The literacy rate used in the work of Azariadis and Drazen (1990), Romer (1990).• The enrollment rate (average or primary, secondary) found in Barro (1991), Mankiw et al. (1992) as well as Levine and Renelt (1992).• The average number of years of study found in numerous studies such as Barro and Sala-i-martin (1995), Barro (1997, 1999), Benhabib and Spiegel (1994).Wössman (2000) proposes two evolutions for the specification of human capital based on the Minerian theory of human capital and the quality index proposed by Hanushek and Kimko (2000). The latter combine all the information available on developments in mathematics and science up to 1991 to build a single measure of the quality of education in each country. Wössman (2000) uses this measure and the Mincer specification to propose another indicator allowing to take into account, not only the quantitative aspect of human capital but also its quality, by taking into account these diminishing returns and the efficiency of the education system.
2.1.2. Measuring Economic Growth
- Economic growth is generally measured by the increase in gross domestic product measured in volume. This aggregate of national accounts is the subject of critical reflections.Indeed, as an indicator of the production of goods and services of an economy, it is based on conventions which lead to counting only the productions produced with market factors of production. Undeclared and voluntary productions, domestic activities are therefore not counted, which affects the rigor of the comparisons in time and space. In addition, the GDP does not take into account negative externalities, in particular those concerning the environment.Besides this, the GDP does not take into account the nature of the production carried out (weapons or foodstuffs), nor the distribution of production (degree of inequality, etc.). These shortcomings lead to questioning the ability of this indicator to measure the level of development. This is why other indicators are proposed today, in particular the Human Development Indicator (HDI). More generally, work on new wealth indicators is increasing today: ecological footprint, Barometer of inequalities and poverty or BIP 40, etc.
3. Methodology
- In this work, we propose to study the relationship between human capital and economic growth. The majority of theoretical analyzes have confirmed that human capital has a positive and significant effect on growth. However, these results are not always verified. Our study aims to explore the causality between human capital and economic growth in the Republic of Congo over the 1980-2016 periods in time series.After that, we will test empirically, using time series econometrics techniques, the impact of education on economic growth by using enrollment rates in each level of study as an indicator of capital human.
3.1. Presentation of the Model
- The econometric estimate was carried out using a Cobb-Douglas type production function over the period 1980-2016 and considering a production factor, work (education level of the active population).Formally, we note this function:
 Where Y is the GDP, L the work, H solar level reached by the active population and i represents the index of the different skill levels.The transformation of the function into logarithm takes the following form:
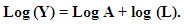 | (1) |
 | (2) |
 | (3) |
 is constant and
  : the error term.
 = Logarithm of GDP growth
 = Logarithm of human capital representing the primary school enrollment rate
 = Logarithm of human capital representing the secondary school enrollment rate
 = logarithm of total public education investment expenditure
3.2. Data Source and Processing
- The data used for the estimate comes from the World Bank (WB). The data will be processed using Microsoft Excel 2007 and IBM SPSS Statistics software.
4. Presentation and Analysis of Results
- This section will be focus on the presentation of the descriptive and econometric analysis of our study.
4.1. Results of the Descriptive Approach
- This subsection enables us to make a descriptive analysis of the different trends of each variable used in our study.
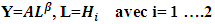
 | Figure 1. Evolution primary school enrollment rate from 1980 to 2016 (Source: Author from World Bank Data.) |
 | Figure 2. Secondary school enrollment rate from 1980 to 2016 |
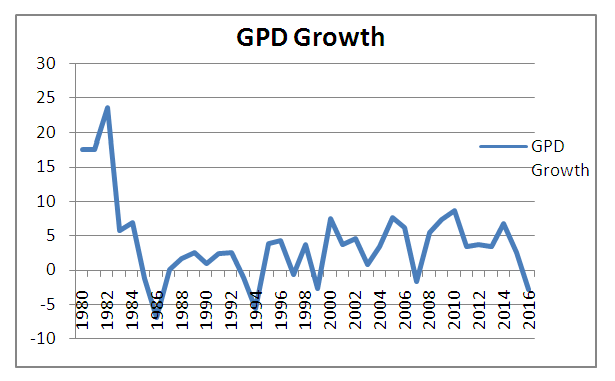 | Figure 3. Evolution of GDP growth in relation to total public expenditure on schooling (Source: Author from World Bank Data) |
4.2. Econometric Results
- This section will focus on the presentation of the econometric and economic results of this study and will assess the impact of educational human capital on economic growth in the Republic of Congo.
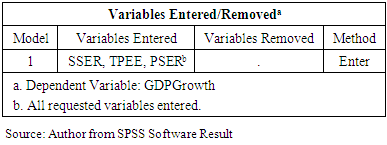
4.2.1. Presentation of Tables’ Results Obtained During the Regression of Our Data on the SPSS Statistic Software
- So as we can already notice, the SPSS software has another way of presenting the results of the tests carried out during our regression compared to other software such as Eviews, Stata etc. This is why we will comment them as far as possible as they appear while taking into account what was mentioned a little earlier in the literature review in order to see if educational human capital has an impact or not on economic growth in the Republic of the Congo.
|
|
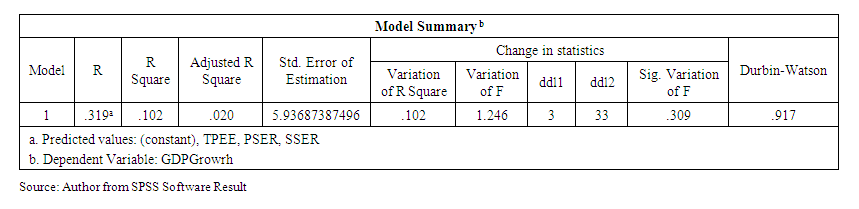 | Table 3. Durbin-Watson result model Summary |
 .- Concerning Durbin-Watson, as we know it already in its definition the Durbin Watson (DW) statistic is a test for autocorrelation in the residuals from a statistical regression analysis. He will always have a value between 0 and 4. A value of 2.0 means that there is no autocorrelation detected in the sample. Values from 0 to less than 2 indicate positive autocorrelation and values from 2 to 4 indicate negative autocorrelation.In our study, the result of Durbin-Watson value is 0,917, which indicates that the assumption that the error terms are independent has been fulfilled.- The
  as for him in its definition is the measure of the amount of variance in dependent variable that the independent variables account for when taken as a group. Its measurement is not based on how much an individual predictor or a given individual variable represents, but only when we take them all as a group, this model summary table says overall, the regression model, which is what is referred to sometimes as a model, these three (3) predictors predicting GDP Growth that overall model account for 10.2% of the variance. And as we can see in the table 3 the amount of the
  is 0.102 which is equal to 10.2, which simply means taken as a set the predictor PSER, SSER, and TPEE account of 10.2% of the variance in GDP Growth.
|
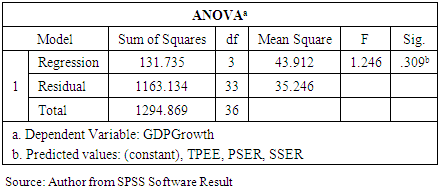
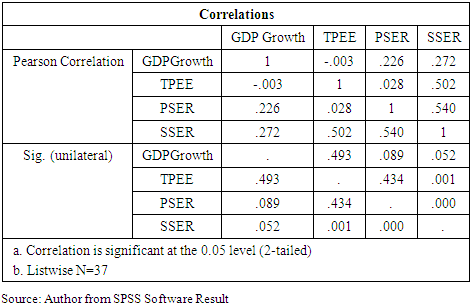
 is significant at 0.So, as the p-value is less than 0.5 we know that the value of
  is significant and greater than 0 and this means that our independent variables are capable of taking into account a significant amount of variance in growth of GDP. So in other words, the regression model is significant.ANOVA table (test with alpha = 0.5)The regression model is globally significant and here we have F (3 and 33) for the regression and residual = 1.246, p<0.309, R square = 10.2.This is to tell us that our regression analysis is statistically significant when I take these three (3) predictors together as a group, they predict GDP growth significantly.
|
5. Conclusions
- The objective of this study was to study the impact of human capital on economic growth in Congo Brazzaville. Using level of education as a proxy variable for human capital, the analyzes carried out yielded both short-term and long-term results. It should be remembered that primary education contributes to growth in the short term while secondary education does not impact growth in the long term. These results highlight the fact that human capital is a growth factor in Congo Brazzaville. This clearly confirms our choice of reference to the relationship between education and growth, because as previously indicated, Philippe Aghion and Elie Cohen (2003) show that it is at the level of primary education that education can contribute to economic growth in countries far from the technological frontier, knowing that higher education remains the essential level of economic growth for a higher level of development, taking as a condition that education cannot have positive effects on the economic growth only if the politico-economic-social environment is favorable to it.However, for lack of availability of data which could have captured human capital at best, such as the labor force by level of study to name only this one, we were forced to use the Enrollment Rate for each level of study considered. This is a limitation to this study although the use of the latter has resulted in a positive impact on growth in the short term. Since the enrollment rate at a given level of study is not sufficient to assess the stock of knowledge available to the individuals who have enrolled, even less the experience that these individuals have acquired following the completion of a given job.This study does not claim to have identified all of the contours of the relationship between human capital and economic growth. Thus, other studies may therefore seek, in the case of the Congo, the main axes of educational human capital, better training to allow the authorities to channel the efforts to be undertaken in this area for the promotion of sustainable development.