-
Paper Information
- Paper Submission
-
Journal Information
- About This Journal
- Editorial Board
- Current Issue
- Archive
- Author Guidelines
- Contact Us
American Journal of Economics
p-ISSN: 2166-4951 e-ISSN: 2166-496X
2020; 10(4): 257-265
doi:10.5923/j.economics.20201004.05

Input Tariffs, Product Scope and Employment: Case of Manufacturing Firms in Ethiopia
 Abstract
 Reference
 Full-Text PDF
 Full-text HTML
Zenebech Admasu Gebreamilack
School of Economics, Shanghai University, Shangda, Shanghai, China
Correspondence to: Zenebech Admasu Gebreamilack , School of Economics, Shanghai University, Shangda, Shanghai, China.
| Email: |  |
Copyright © 2020 The Author(s). Published by Scientific & Academic Publishing.
This work is licensed under the Creative Commons Attribution International License (CC BY).
http://creativecommons.org/licenses/by/4.0/

This article assesses the impact of input trade liberalization on firm level employment and product scope. Panel data of manufacturing firms from Ethiopian manufacturing census for the period 2000 to 2016 are utilized; FE and System GMM estimation techniques are employed. Results suggest that input tariffs reduction increase firm level product scope; and firms’ participation in international trade has also positive impact; moreover, firms who expand their product scope tend to employ more. Further, tariff reduction helps firms to increase employment at least in the short run and different impact for exporter and importer.
Keywords: Input Tariffs, Manufacturing firm, Product Scope, Employment
Cite this paper: Zenebech Admasu Gebreamilack , Input Tariffs, Product Scope and Employment: Case of Manufacturing Firms in Ethiopia, American Journal of Economics, Vol. 10 No. 4, 2020, pp. 257-265. doi: 10.5923/j.economics.20201004.05.
Article Outline
1. Introduction
- Creating jobs is a key government objective especially in developing countries; and many of these countries have been implemented trade liberalization measures as a major part of their economic reforms in the past decades [1]. Countries in Sub Saharan Africa (SSA) are not an exception; they had implemented such measures as part of Structural Adjustment Programs (SAPs) and later other regional free trade agreements. Trade liberalization measures are made aiming at reducing trade barriers and consequently increase firms’ access to new technologies and intermediate inputs which in turn contribute to the improvement in productivity and growth in product scope [2]. Besides, it has role in job creation and poverty alleviation for some other [3]. According to World Trade Report [4] trade opening tends to increase wages and employment; however, regional and individual differences determine how widely gains are shared and mere openness cannot guarantee benefit rather it should be supported by growth in competitiveness at home [5]. Moreover, domestic policies, macroeconomic conditions and institutional factors are important; hence, trade liberalization measures need to be implemented within a coherent set of macroeconomic, structural and social policies [6]. Recent researches highlight that the impact of trade openness on labor market outcome remains a concern of both developed and developing economies. Liberalization1 measures contribute in widening unemployment and wage inequality in developed countries. This has been associated with the growth of low-wage manufactured exports from developing countries. For instance, it is a cause for the growth of unemployment in Australia [8], wage inequality in the United States [9] and cause for reduction in labor demand at industries for United Kingdom [10]. Moreover, trade liberalization is associated with rise in imports and it has caused reduction in employment in less technology intensive industries in Europe [11]. Looking further evidences from advanced economies; another point of view that explains loss of jobs in US manufacturing is associated with import competition and innovations in production and related increase in labor productivity which in turn force less productive and labor intensive firm to relocate to overseas as in [12 and 13]. In fact, trade liberalization move contribute to expand export markets and resulting in greater demand for domestic products, greater domestic production, and hence create more domestic job for some countries. For instance, it improves productivity of firms in China though heterogeneous impact with the type of firm as in [14]. On the other hand, the export of SSA remain far below the performance of other developing countries in the region in the post- liberalization [15]; besides, liberalization measures are blamed for exploitation of workers and de-industrialization in developing countries as in [16 and 17]. Further, different employment and earning outcome for firms with large and small tariff reduction and large tariff reduction regions have experience of loss of jobs and earnings than others [18]. Further, empirical studies that examine the impact of trade liberalization on manufacturing employment in developing countries stress the impact is specific to countries circumstance in which trade liberalization has been implemented [19]. Another study that analyzes the situation in four countries (Bangladesh, Kenya, South Africa and Vietnam) documents that Africa loss jobs than Asia [20]. However, the impact of trade on India’s manufacturing employment is found similar to African countries than Asian [21]. Again, employment growth has lessened in the post-liberalization period [22]. Moreover, labor-intensive industries were not benefited in India and South Africa [23]. There are studies that document positive association between export intensity on employment and negative import of importing such as [24] in South Africa; [25] in Ghana, Besides, [26] blame that trade liberalization measures have exacerbated the already high unemployment rates in Nigeria; whereas the role of trade, foreign direct investment and technology on employment and skills in Ethiopia found to be labor–augmenting and skill-bias for foreign owned firms and firm’s are located to the environs of capital city [27].The existing studies on SSA countries focused on the impact of trade liberalization on employment. This research; however, measure the impact of input tariff reduction on firm level product scope and further on firm employment which is with similar inquiry as in [28] for Ecuador and slightly as in [29] for India but with different approach and context. We utilize panel data from Ethiopian manufacturing census from 2000-2016 which is collected by Central Statistical Agency. Ethiopia is among the SSA countries that implemented SAPs where trade- liberalization was one aspects of the program. Hence, this study relates input-trade liberalization to firm product scope and employment in African context.System GMM estimation techniques to panel data are employed. Results suggest that input tariff reduction improve firm level product scope and firms who expand their product scope tend to employ more. Moreover, firms’ participation in international trade has positive impact on firm product scope. Further, input tariff reduction helps firms to increase employment at least in the short run, and being exporter help firms to employ more while importing to employ less. Following introduction, the rest of the paper is organized in to 5 more sections. Section 2 specifies the empirical model based on theoretical basis, presents the data used for analysis and outlines the estimation method. Further, section 3 overviews the economy where the research is based and section 4 provides the descriptive statistics while section 5 presents estimation results; and finally section 6 concludes.
2. Data and Methodology
2.1. The Empirical Model
- The standard international trade models such as Heckscher-Ohlin (HO) model and its extensions predict about trade liberalization impact on labor market outcomes such as employment and wage. However, international trade can be guided by other than HO principle, such as heterogeneous firm trade. Firms participating in international trade improve productivity than non-trading firms [30]; hence, firms employ fewer employees per output [31]. Methodologies used in the literatures for analyzing the impact of trade liberalization on manufacturing employment grouped in four approaches: factor content approach, competitiveness approach, growth accounting decomposition approach and econometric based or labor demand approach. We adopt the econometric based approach. Model is specified based on Cobb-Douglas production process as in [32] and augmented to fit our purpose. The production function specification is in equation (1).
 | (1) |
 | (2) |
 | (3) |
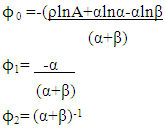 Technical efficiency increases over time and rate of technology adoption is correlated with trade variables and given that parameter A in the production function could change with time and it is a function of import penetration and export penetration [33]. Here, our objective is to estimate the effects of trade liberalization on firm-level employment; to that end, we apply firm level input tariff, product scope, demand for firm’s output or sales, capital stock, input importer status and exporter status. Besides, since employment is persistent with delay in adjustment which depends on firms’ output, capital stock and wage; we add the lagged values of dependent variable and augmented the labor demand equation as equation (4):
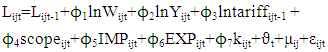 | (4) |
2.2. Data
- The objective is to examine the impact of input trade liberalization on firms’ employment and product scope; to that end, we combine firm level manufacturing data and tariff data. Firm level data are from annual census of large and medium manufacturing firms which is collected by the Central Statistical Agency (CSA) of Ethiopia, covering the period from 2000 to 2016. The firm level data from CSA are belonging to the manufacturing sector, and industry is defined at the 4-digit level according to the International Standard for Industrial Classification (ISIC) Rev. 3 classification code. The tariff data; on the other hand, is obtained from the World Integrated Trade Solution (WITS) website and corresponds to Ethiopia’s effectively applied most favored nation import tariffs with respect to the rest of the world. The tariff data from WITS defined at Harmonized System (HS) six-digit product code for each product. The tariff data is mapped to firm level data from CSA. This study considers manufacturing sectors of food and beverage, textiles, apparels, leather and leather products, and furniture sectors. These sectors are policy priority of the government under its growth and transformation plans for their potential in generating employment and exports.
2.3. Estimation Method
- Given the dynamic nature of the augmented labor demand equation, we apply System GMM (SysGMM, hereafter) as it fits best given the characteristics of our data and the specification of the model. In GMM estimation, we normally use moment restrictions of a simultaneous system of first-differenced equations and the equations in level that is the first-differenced equations they use the lagged level values of the variables as instruments, and in the level equations they use differences as instruments. This technique minimizes data loss and applicable to unbalanced panels and it also help avoid the bias of endogeneity independent variables; the upward or downward bias of coefficient in the fixed effect estimates or difference GMM; the inconsistency problem introduced by the lagged dependent variable as an independent variable in regressions. SysGMM is efficient and robust to heteroskedasticity and autocorrelation [34]. The consistency of the GMM estimator depends on the validity of the assumption that error term does not exhibit serial correlation and on the validity of the instruments. Hereby, we test for the null hypothesis of no first-order serial correlation should be rejected under the identifying but the test for the null hypothesis of no second-order serial correlation should not be rejected; whereas, the validity of the instruments is detected by Hansen test for the potential problem of over-identification caused by the proliferation of instruments [35] and our estimation made with Windmeijer corrected standard errors, orthogonal deviations.
3. Overview of Economy
3.1. Contribution of Sectors
- The Ethiopian economy basically agriculture based where more than 70 percent of population is engaged in. The share of agriculture in 1996 was 55 percent of GDP; and recently its share is 34 percent as of 2017. The share of service sector has increased significantly over time surpassing the share of agriculture; it contributed about 43 percent in 2003. In 2017, the share of industry in GDP rose to 27 percent while share service increased to 39 percent; whereas, the share of agriculture decreased to 34 percent in the same period. The increase share of industry in recent period partly from the rise in the construction sector and the manufacturing sector’s increment remains low. Figure 1 illustrates the sectors percentage share of GDP over time.
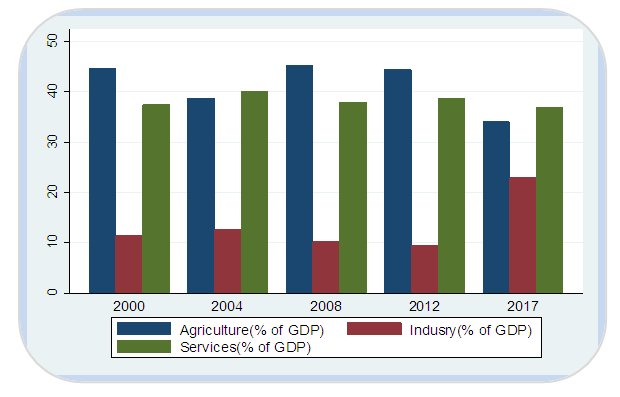 | Figure 1. Composition of GDP (share of industry represented in the middle bar) (Source: Own Computation from World Development Indicators, 2019) |
3.2. Industry Employment
- Regardless of the government attention under its Growth and Transformation Plans, the performance of industry remains low; however, it is a promising sector for future prospect the country. In 2017 industry grew by 23 percent and in terms of employment generation it shows growth over time even if it is still small. In 1991, industry employs merely 5.9 percent of GDP and it has grown to 6.79 percent in 2000 and 12 percent in 2018. Figure 2 depicts the trend of industry employment as percentage of total employment over the period 1991 to 2018.
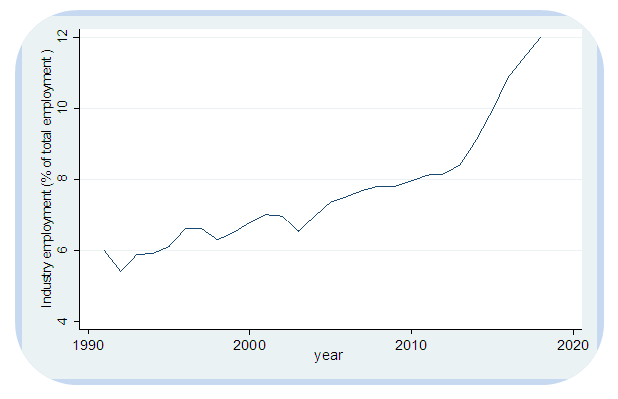 | Figure 2. Industry Employment (% of total Employment) over 1991-2018 (Source: computed based on World Development Indicators, 2019.) |
4. Descriptive Statistics
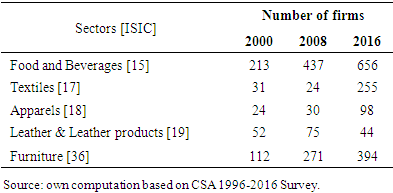
4.1. Firm Size
- Total numbers of firms are used to measure firm size and number of firms in general increases over time except in leather and leather products firms where they have fewer firms in recent period. Whereas textiles show remarkable progress recently, it has been slow down from 31 in 2000 to 24 in 2008 but later it rise to 255 in 2016. On the other hand, food and beverages represent the largest number firms and their number increase from 213 in 2000, to 437 in 2008 and 656 in 2016. Table 1 presents this trend.
|
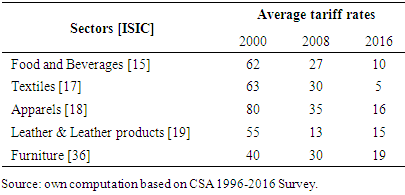
4.2. Average Tariff Rates by Sector
- Prior to the reform the maximum tariff was above 80 percent and it has reduced to 35 percent, where sizeable tariff reductions at the beginning of the reform principally for sectors with higher tariff rates and lesser at later periods. Table 2 shows the import tariff rates applied for sectors at 2-digit ISIC. The apparels sector enjoyed the maximum tariff reduction which is from 80 percent at the beginning of reform period to 35 percent in 2008 and even become 16 percent 2016. Textile sector also enjoyed significant tariff cut from 60 percent at the beginning of the reform to 5 percent on average in 2016.This shows government’s attention to such sectors as the countries potentials in such sector of manufacturing; besides, employment and export potential of sector. Food and beverages and furniture sectors also got relatively highest tariff cuts.
|
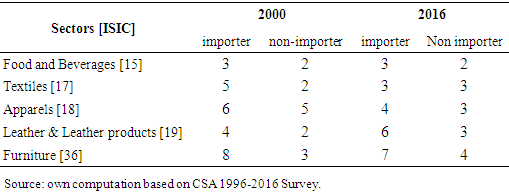
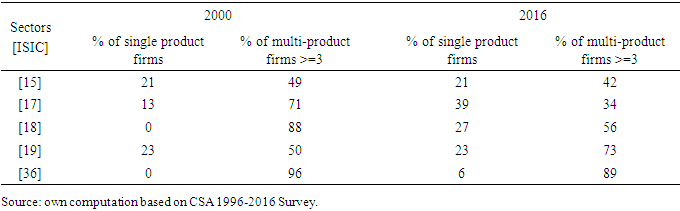
4.3. Product Scope
- Here, product scope is measured by the number of products firms produce; however, average numbers are taken once firms are aggregated by their ISIC-2. Further, average product number for input importer and non-importer firms are identified and provided in table 3. Moreover, percentage of firms with single product and multi- product firms having three or more products, aggregated by their sector are presented in table 4.
|
|
4.4. Firms’ Performance
- Firms’ performance is measured by share of exports by sector as percentage of total sales value, sector’s employment as percentage of total manufacturing employment and labor productivity.
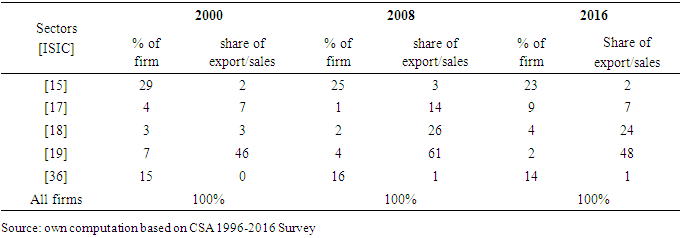
4.4.1. Share of Export
- The largest share of export from total sales is found in leather and leather products which represent 46 percent in 2000, 61 percent in 2008 and 48 percent in 2016. It followed by apparels which account for 3 percent, 26 percent and 24 percent in 2000, 2008 and 2016, respectively; while the smallest share in furniture sector. Table 5 depicts this trend with the percentage of firms in each industry classification.
|
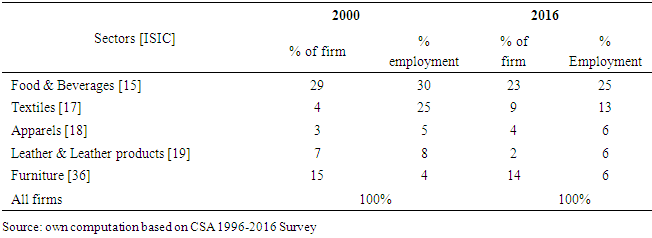
4.4.2. Employment
- Here, employment is measured as the percentages share of employment in each sector to total manufacturing employment. Accordingly, food and beverage constitute the largest number of manufacturing firms and it also accounts for largest share manufacturing employment which account for 30 percent in 2000 and 2008, and 25 percent in 2016. It followed by the textile sector which employs 25 percent in 2000. However, its employment has decline to 10 percent and 13 percent in 2008 and 2016 recent periods, respectively; despite sector’s potential and policy priority. On the other hand, the furniture sector employs smallest share of manufacturing employment; for instance in 2016 it employ only 6 percent of manufacturing employment. Detail of each sector is summarized in table 6.
|
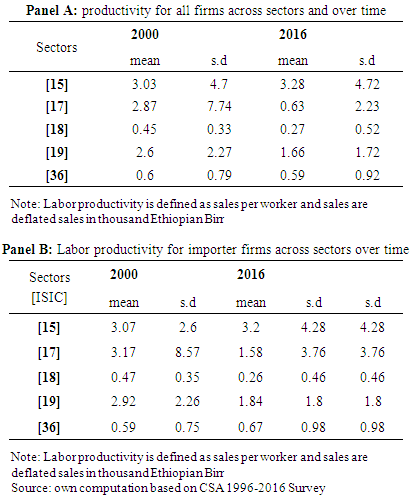
4.4.3. Labour Productivity
- Table 7 presents mean and standard deviation of labour productivity of sectors over time. Panel A provides labour productivity for both importer and non- importer whereas panel B presents labour productivity of importer only.
|
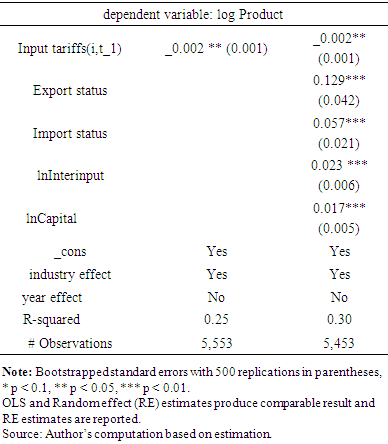
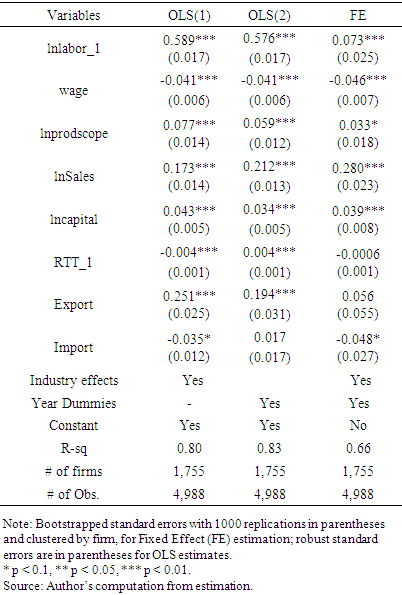
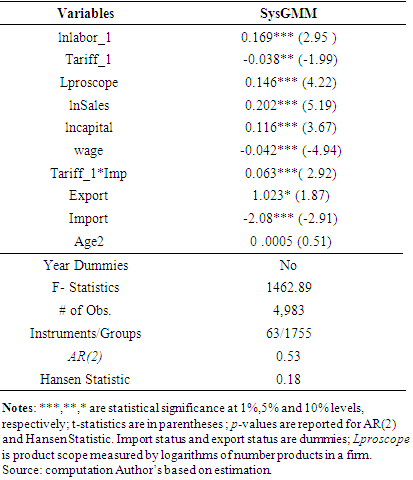
5. Estimation Results
- The objectives in this study are assessing the impact of trade liberalization on firm product scope and examining the impact of trade liberalization on firm employment. In order to achieve these objectives, utilizing panel data of selected industries over time period 2000 to 2016 and tariff data; OLS, FE/RE and SysGMM estimation techniques are applied as estimation technique. The coefficient of input tariff in product scope estimation equation in table 8 is negative and significant and implies that the input tariff reduction contribute to product growth. For instance, a 10 percent input tariff reduction induces firms to add new product by 0.02 percent. Moreover, the coefficients of input importer status and export status are positive and significant, which implies input importer firms have a chance to produce various output than non-importer firms on average.
|
|
|
6. Conclusions
- In order to investigate the impact of trade liberalization on impact of trade liberalization on manufacturing employment and firm level product scope, two channels are identified for the impact of trade liberalization on firm level employment. One is the impact of tariff reduction on product scope and also product scope on employment. The other is the impact of tariff reduction directly on firm employment. In order to examine this, firm level manufacturing data from CSA census survey are used and the manufacturing sector defined at the 4-digit according to ISIC. Panel data of manufacturing sectors of textiles, apparels, leather and leather products, food and beverages and furniture from Ethiopian manufacturing census over the period 2000 to 2016; whereas the tariff data, defined at Harmonized System six-digit product code, is obtained from WITS are combined.Panel data estimation techniques of OLS, FE and SysGMM are employed; and results indicate that input tariff reduction improves firm level product scope and firms who expand their product scope tend to employ more. Moreover, firms’ participation in international trade has positive impact on firms’ product scope growth. Further, SysGMM results suggest that input tariff reduction helps firms to increase employment at least in the short turn, and exporting help firms to employ more while input importing to employ less; this result implies that such firms import high-tech intermediaries and thus employ less of labor as a result. Hence, findings suggest that working on export oriented firms and penetrate the export market is imperative to benefit from trade openness and to create the demanding employment opportunities for the growing young population.
ACKNOWLEDGEMENTS
- I’m thankful to Central Statistical Agency of Ethiopian for providing me the Census Data over the period 1996-2016 which is used in this research.
Note
- 1. On the other hand, trade protection could also cause within industry job- reallocation that increase jobs in import competing sector with a possible shrink of jobs in export-oriented sectors [7].