-
Paper Information
- Previous Paper
- Paper Submission
-
Journal Information
- About This Journal
- Editorial Board
- Current Issue
- Archive
- Author Guidelines
- Contact Us
American Journal of Economics
p-ISSN: 2166-4951 e-ISSN: 2166-496X
2020; 10(4): 241-256
doi:10.5923/j.economics.20201004.04

Impact of Adopting Motor Pump Technology on Smallholder Farmers’ Income: Empirical Evidence from Southern Ethiopia
 Abstract
 Reference
 Full-Text PDF
 Full-text HTML
1Bureau of Agriculture, IFAD Office of Irrigation, Hawassa, Ethiopia
2Department of Economics, College of Business and Economics, Wolkite University, Wolkite, Ethiopia
Correspondence to: Lemma Shallo, Department of Economics, College of Business and Economics, Wolkite University, Wolkite, Ethiopia.
| Email: |  |
Copyright © 2020 The Author(s). Published by Scientific & Academic Publishing.
This work is licensed under the Creative Commons Attribution International License (CC BY).
http://creativecommons.org/licenses/by/4.0/

The purpose of this study was to identify determinants of motor pump adoption and its impact on Smallholders Farmers’ income, in Southern Ethiopia. Primary data were collected from 140 sample respondents drawn from both motor pump adopting and non-adopting households. Secondary data were also collected from different sources. Descriptive statistics and econometric model were employed for data analysis. The logistic regression estimation of factors determining adoption of motor pump revealed that age of household head, gender, education level, availability of shallow ground water, number of adult family members, farm land size, participation in local organization and access to credit significantly influenced adoption of motor pump. Propensity score matching method was applied to analyze impact of motor pump adoption on outcome variable. The result revealed that motor pump adopting households had increased annual agricultural income on average 88047.49(Birr) per year compared to non-adopting households. Result showed that adoption of motor pump has significant positive impact on household annual agricultural income. Therefore, the study recommends establishing private manual well drilling enterprises at local and regional level to provide low cost access to ground water for pro-poor farmers that would expand the irrigated farm production area, and encouraging enterprises that combine the supply of standard pumps, technical support and spare parts to farmers and market for the produce would greatly improve the use of water lifting technologies (motor pump) and brings economic benefits to farmers. In addition, provision of well-functioning credit facility to improve adoption rate by female farmers to address gender imbalances.
Keywords: Irrigation, Motor pumps, Adoption, Logit model, Propensity score matching
Cite this paper: Mira Mohammed, Lemma Shallo, Impact of Adopting Motor Pump Technology on Smallholder Farmers’ Income: Empirical Evidence from Southern Ethiopia, American Journal of Economics, Vol. 10 No. 4, 2020, pp. 241-256. doi: 10.5923/j.economics.20201004.04.
Article Outline
1. Introduction
- The development of irrigation and agricultural water management holds significant potential to improve productivity and reduce vulnerability to climatic volatility in any country [1]. Irrigation expansion is seen as a significant leverage to food security, livelihoods, rural development, and agricultural and broader economic development in Africa, especially in sub-Saharan Africa [2]. National and regional policies and plans stress irrigation development, and more broadly sustainable land and water management, as a key component to poverty alleviation and gains in food productivity [3,4].Poverty reduction is at the center of the development agenda of the Ethiopian government in general and the regional governments in particular. To this end, investment in irrigation development has been considered as one of the possible strategies for achieving food security [5]. Irrigated agriculture can reduce poverty through increasing production and income, protecting against risks of crop loss due to erratic and insufficient water supplies, promoting greater use of yield enhancing inputs and creation of additional employment [6].Ethiopia is one of the abundant water-receiving countries in the east African region [7], which has approximately 12 river basins with an annual runoff of 122 billion m3 and with 2.6 billion m3 of ground water. With all this potential, however, the country fails to produce enough food to feed its population. The country’s perennial dependence on food aid has been then attributed largely to an over-reliance on rain fed smallholder agriculture. For example, post GTP-1 report shows that only 2 million hectares (30-35%) of the 4.25 million hectares of irrigable land is currently developed through traditional, small, medium, and large-scale irrigation schemes [8].Investment in irrigation, particularly in small-scale irrigation development, has been identified as one of the core strategies to delink agricultural performance from rainfall and then to ensure sustainable growth and development [9,10,11]. In line with this, expansion of small, medium and large-scale irrigation in Ethiopia has been emphasized in the five year plan of (GTP-1) [12]. Although scheme level irrigation expansion is still important, it is capital intensive to address all smallholders and limited in land coverage, implying that it cannot fully exploit available opportunities that can be adopted and used at household level, while smallholder irrigation is seen as cost effective compared to scheme level irrigation projects, because they are managed by farmers themselves. Given the surface and ground water potential of the country, promoting adoption of household level irrigation technologies is vital for improved production and food security at household level [13,14]. The study area, Gurage zone of Meskan district is one of drought prone and food insecure highly populated area with degraded and small plot of land holdings implying that agricultural intensification is the best available option to increase agricultural production and food security [15]. There are few research studies at the national and local level on related topic [13,14]. However, these studies did not identified district’s specific level factors that determine adoption of motor pump and they didn’t show the income difference between adopting and non-adopting households clearly. In case of policy gaps there is no clear map of accurate ground water availability at national and local level, alternative strategies for the lack of skilled labour for well drilling, supply chain of standardized motor pump, import taxes and subsidies. The main motives of this research are due to erratic rain fall smallholder farmers in the study area suffered critically for the repeated years. The premise is that smallholders can play a significant role in irrigation development provided they have access to appropriate low-cost water lifting technologies. Therefore, the objective of this study was to examine factors affecting farm household adoption decisions of motor pumps and its impact on smallholder farmers’ income in the study area.
2. Materials and Methods
2.1. Description of the Study Area
- Gurage zone is located in the southwestern and northern most part of region of the Southern Region. According to the Central Statistical Agency (CSA) population projection in 2013, the total number of the population of the zone is estimated at 1,597,360 in 2016 (48.5% male and 51.5% female). The overwhelming majority (84.9%) lives in rural area, depending on agriculture as a means of livelihood [16,17].The study area, Meskan district, is one of thirteen districts and two town administrations of Gurage zone in Southern Nation, Nationalities and People’s Regional State (SNNPRS). The district is bounded in the East and South-east by Mareko District, in the North and North-east by Sodo District, in the West Muheraklil and in the North-west Gedebano Gutazer Welene District in Gurage zone and Silti zone in the South and in the South-west. It is located in 7°.99’- 8°.28’N latitude and 38°.26’-38°.58’E longitude (Fig. 1). The total land area is estimated 446.7 square km. Butajira is the capital town of the district, which is located at a distance of 130 km from capital city Addis Ababa, 166 km from regional capital Hawassa and 96 km from zonal capital Wolkite. According to Ethiopian Central Statistics Agency (CSA), the total human population of the district for the year 2017 is estimated about 196,045 (49% male and 51% female) [16].
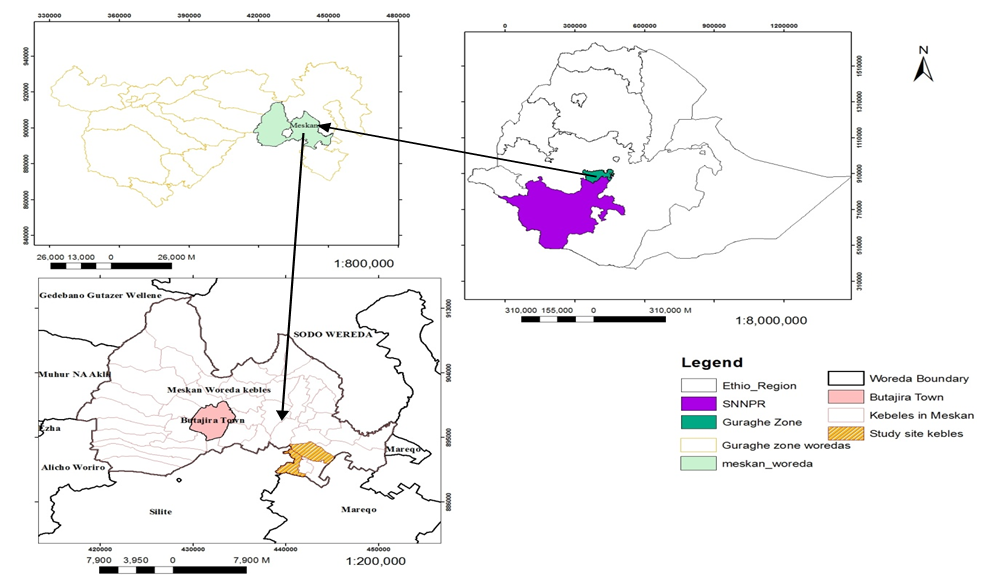 | Figure 1. Location map of Study area |
2.2. Data Sources, Instruments for Collection and Sampling Procedures
- The study was a cross-sectional survey design that involved both primary and secondary data sources. The primary data were collected from sample household farmers. Secondary data was collected from relevant sources such as published and unpublished documents, office reports, books, journals, research articles, proceedings and others.A structured questionnaire was used to collect primary data from 140 sample households’ of motor pump adopters and non-adopters related to households’ personal data, socio economic and demographic related data, irrigation practices and challenges related adoption of water lifting technologies and agro ecological and institutional related issues. The sampling procedure followed for this study was a multi-stage sampling technique. In the First stage, the researcher selected district with high concentration of smallholders’ irrigation technologies like motor pump using Shallow ground water/Surface water where Meskan District (district) was selected purposively. In the second stage, information used from Meskan district Agriculture and Natural Resource office to select kebele’s that have high adoption rates of motor pump using Shallow Ground water/Surface water, from 20 kebele’s with better irrigation potential and where household irrigation technology was promoted intensively, the researcher found Battifuto and Ensenousme kebele’s purposively. In the third stage, before conducting the selection of sample households in the selected kebeles, sampling frame was established by taking the complete list of households from the record available in the kebeles’ administration and agriculture office and disaggregated them into adopters and non-adopters. The sample households were selected through simple random sampling method. Out of the total households of the two kebeles 1313 (463 adopters and 747 non-adopters), finally, 50 adopters and 90 non-adopters were randomly selected for the study using proportionate sampling procedure. A structured and semi-structured questionnaire was used to capture both qualitative and quantitative information from sample households.
|
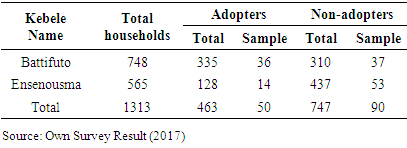
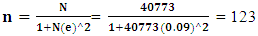 Where n is the sample size, N is the population size (total household size), and e is the level of precision. Based on the number of the total households in the sampling frame, the formula equated and reached a minimum of respondents which is 123. However, the sample size used was 140 respondents in order to increase the number of counterfactuals households.
 2.3. Method of Data Analysis
- To analyze the data both descriptive and econometrics models were used. Descriptive statistics such as mean, percentage, standard deviation and frequency of occurrence were used. The statistical significance of the variables was tested for both dummy and continuous variables using chi-square and t-tests, respectively. Whereas, Propensity score matching method (PSM) was used to estimate the impact of motor pump adoption on their income (for impact evaluation). Propensity score matching (PSM) method was chosen to analyze the impact of motor pump adoption on households’ income due to the following reasons. Firstly, the method does not need baseline data on participants and nonparticipants. Secondly, the participants of motor pump were either purposefully placed or self-selected to participate. Thirdly, the available field data was based on a cross-sectional survey. Finally, it was possible to identify some features, in this case socio economic, agro-climatic parameters and physical characteristics, to match the participants and non-participants.
2.4. Empirical Model
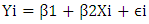
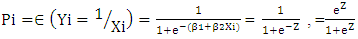
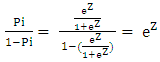
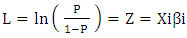
- The logit and probit model are the two most commonly used models for assessing the effects of various factors that affect the probability of adoption of a given technology. These models can also provide the predicted probability of adoption. Both models usually yield similar results. However, the logit model is simpler in estimation than probit model [13]. Hence, the logit model will be used in this study to analyze the determinant of Smallholders adoption of motor pump. Following Gujarati [19] and the logistic distribution function for the adoption of motor pump is specified as:
 | (1) |
 | (2) |
 | (3) |
 | (4) |
 are parameters to be estimated. A binomial logit model is useful for investigating the influences of household and farm level attributes on household’s technology adoption relating the probability of smallholder irrigation technology adoption to the underlying characteristics. The dependent variable (Y) will be the logarithm of the odds in favor of motor pump adoption, and the parameters will be interpreted as derivatives of this logarithm with respect to the independent variables. The estimated coefficients can be used to predict the adoption probability of motor pump. In the logit model, like in any nonlinear regression model, the parameters are not necessarily the marginal effects [13,14], but represent changes in the natural log of odds ratio for a unit change in the explanatory variables. The logit model specified above estimates the probability of adoption of motor pump. On the other hand, to estimate the effect of motor pump adoption on agricultural income, the research used propensity score matching methods.Since the adoption of motor pumps is not random, a selection bias is still a potential problem, as the adoption of motor pumps can be related to a number of factors (such as: unobserved household characteristics; proximity to water source; access to information and others). In addition, the remaining non-adopter sample households may not properly approximate the adopting sample households to serve as a counterfactual (control group). Hence, comparing adopters with the non-adopters without matching may still result in biased and inconsistent results [14].
2.4.1. Propensity Score Matching (PSM) Method
- The impact of the adoption of motor pump on income is the difference in households’ mean income with the participation and non-participation in household irrigation. However, households participating in the program cannot be simultaneously observed in two statuses. A household can either be in the program or outside the program. Thus, the fundamental problem of such an impact evaluation is a missing data problem. In other words, we are interested in answering the research question “what would have been the income of motor pump adopting households be if not adopted?” Hence, this study applied a propensity score matching technique, which is a widely applied impact evaluation instrument in the absence of baseline survey data and randomization [20].
2.4.1.1. Analytical Framework
- The standard framework in evaluation analysis to formalize this problem is the potential outcome approach or Rubin-model [21]. The main pillars of this model are individuals, treatment and potential outcomes. In the case of a binary treatment the treatment indicator Di equals one if individual i receive treatment and zero otherwise.The potential outcomes are then defined as
 for each individual, where
  and N denotes the total sample size. The treatment for an individual
  noted
noted  is defined as the difference between the potential outcome in case of treatment and the potential outcome in absence of treatment:
 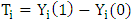 | (5) |
 The unobserved outcome is called counterfactual outcome. Hence, estimating the individual treatment effect
  is not possible and one has to concentrate on (population) average treatment effects.Parameter of interest: Another quantity of interest is the Average Treatment Effect on the Treated, or ATT, which measures the impact of the program on those individuals who participated:
  | (6) |
 As the counterfactual mean for those being treated
  is not observed, one has to choose a proper substitute for it in order to estimate ATT. Using the mean outcome of untreated individuals
  in non-experimental studies is usually not a good idea, because it is most likely that components which determine the treatment decision also determine the outcome variable of interest. Thus, the outcomes of individuals from treatment and comparison group would differ even in the absence of treatment leading to a `self-selection bias'. For
  it can be noted as:
 | (7) |
 is the so-called `self-selection bias'. The true parameter
  is only identified, if:
 In general, an evaluation seeks to estimate the mean impact of the program, obtained by Averaging the impact across all the individuals in the population. This parameter is known as Average Treatment Effect or ATE:
  | (8) |
 And
And  have to be constructed.
2.4.1.2. Defining Region of Common Support
- Imposing a common support condition ensures that any combination of characteristics observed in the treatment group can also be observed among the control group. The common support region is the area which contains the minimum and maximum propensity scores of treatment and control group households, respectively. It requires deleting of all observations whose propensity scores is smaller than the minimum and larger than the maximum of treatment and control, respectively [22].
2.4.1.3. Matching Estimators
- After estimation of the propensity scores, seeking an appropriate matching estimator is the major task of a program evaluator. There are different matching estimators in theory. Below, only the most commonly applied matching estimators are described.Nearest-neighbor (NN) matching: One of the most frequently used matching techniques is NN matching, where each treatment unit is matched to the comparison unit with the closest propensity score [23]. One can also choose n nearest neighbors and do matching (usually n = 5 is used). Matching can be done with or without replacement. Matching with replacement, for example, means that the same nonparticipant can be used as a match for different participants, which would result in increased quality of matches and decreased precision of estimates. On the other hand, in the case of NN matching without replacement, a comparison individual can be used only once. Matching without replacement increases bias but it could improve the precision of the estimates. Caliper or radius matching: One problem with NN matching is that the difference in propensity scores for a participant and its closest nonparticipant neighbor may still be very high. This situation results in poor matches and can be avoided by imposing a threshold or tolerance on the maximum propensity score distance (caliper). This procedure therefore involves matching with replacement, only among propensity scores within a certain range. A higher number of dropped nonparticipants are likely, however, potentially increasing the chance of sampling bias. Kernel matching: This is another matching method whereby all treated units are matched with a weighted average of all controls with weights which are inversely proportional to the distance between the propensity scores of treated and controls [24]. One risk with the methods just described is that only a small subset of nonparticipants will ultimately satisfy the criteria to fall within the common support and thus construct the counterfactual outcome. Nonparametric matching estimators such as kernel matching use a weighted average of all nonparticipants to construct the counterfactual match for each participant. If Pi is the propensity score for participant i and Pj is the propensity score for nonparticipant j, the weights for kernel matching can be computed.
2.4.1.4. Testing Matching Quality
- One important concern that should be taken care of while doing PSM is balancing test. While differences in covariates are expected before matching, these should be avoided after matching. The primary purpose of the PSM is that it serves as a balancing method for covariates between the two groups that participants and non-participants. Consequently, the idea behind balancing tests is to check whether the propensity score is adequately balanced. In other words, a balancing test seeks to examine if at each value of the propensity score, a given characteristic has the same distribution for the treatment and comparison groups. The propensity scores themselves serve only as devices to balance the observed distribution of covariates between the treated and comparison groups. The success of propensity score estimation is therefore assessed by the resultant balance rather than by the fit of the models used to create the estimated propensity scores [25].Finally, using predicted probabilities of participation in the program (i.e. propensity score) match pairs are constructed using alternative methods of matching estimators. Then the impact estimation is the difference between simple mean of outcome variable of interest for participant and non-participant households. So the impact of adoption of motor pump on household income will be analyzed accordingly. Finding the match for motor pump adopting household based on a vector of characteristics is equivalent to finding the match based on the probability of participating in adopting motor pump, conditional on the vector of farm household characteristics, i.e.,

 Thus, the problem reduces to matching the adopting and non-adopting households along their conditional probability of access to water lifting technology (motor pump), a scalar variable that can be estimated from an empirical model such as a logit or probit model. In the present case, the logit regression model was used to derive the propensity scores. A propensity score for every sampled participant and non-participant household was identified.
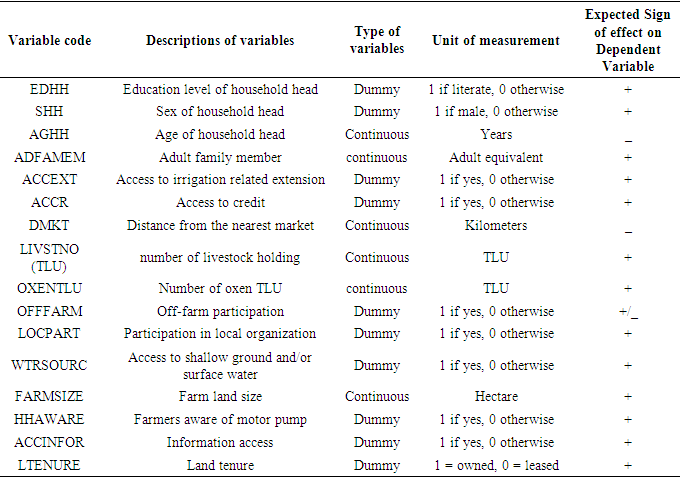
 2.5. Definition of Variables and Hypotheses
- Dependent variable: Adoption of motor pump (Yi) in the study area and the impact of motor pump adoption were the dependent variable.Outcome variable: Annual agricultural income of farm households can be used as a variable of interest in impact estimation.
3. Results and Discussion
3.1. Descriptive Statistics Results
- The demographic, social and economic characteristics of sample households in the study area are discussed as follow. The variables discussed under this topic were those expected to have certain relations with the adoption of motor pump.
|
|
3.1.1. Demographic Characteristics
3.1.1.1. Age of Household Head
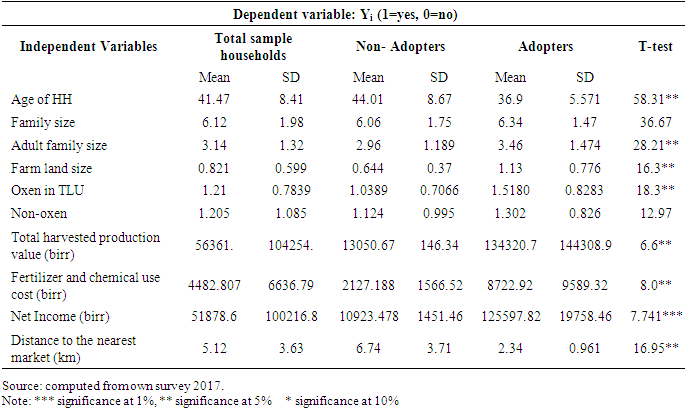
- As depicted above in table 5 the average age of sample households in the study area was 41 years with a minimum 22 years and maximum 70 years. When we compared adopters and non-adapters sample households motor pump adopter sample households have lower age (36.9) as compared to non-adopters age (44). The implication is that older farmers have more farming experience but they are less likely to have formal education and tend to stick to traditional farming systems. The younger farmers are more likely to adopt motor pumps as compared to older farmers. This is consistent with literature and empirical findings in other parts of Ethiopia [14,26].
3.1.1.2. Adult Family Members
- The descriptive result above revealed that average adult family members in the study area was 3. When compared adopters and non-adaptors sample households motor pump adopters have significantly more adult family members 3.46) than non-adopter sample households (2.96). This is consistence with [13] in Tigray. The implication is that small holders’ irrigation is generally considered as labour intensive. The availability of higher number of adult family members working on the farm reduces the farm external labour requirements. Moreover, in a situation where the opportunity cost of family labour is low, farm households with higher number of adult labour are likely to adopt labour intensive technologies. This is in line with the policy direction that gives due consideration for the use of agricultural technologies that can intensively use farm household labour and land.
3.1.1.3. Gender of Household Head
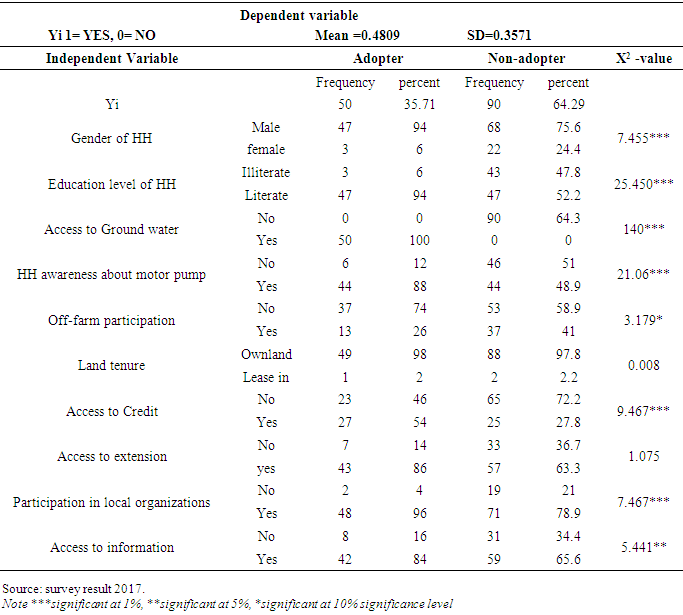
- The descriptive analysis presented in Table 7 revealed that the farming system is male dominated. Female headed households constitute 22% of the non-adopters and only 6% of adopters, implying that female headed households are less likely to adopt irrigation technologies as compared to male headed households. The Chi-square test shows that the difference is statistically significant at less than 1 percent of probability level. Since female headed households are among the poor, capital constraints and lack of access to credit may explain the reason for less female adopters.
3.1.1.4. Education Level of Household Head
- The descriptive statistics result showed that 67 percent of the sample household heads were found to be literate; where as 33 percent of the sample household heads were illiterate. The comparison by adopters of motor pump showed that 94 percent of adopters and 52% of non-adopters were literate. The chi-square test showed that there is a significant relationship between motor pump adopters and level of education below 1percent probability level. The implication is that education plays a vital role in technology adoption including agricultural technology.
3.1.2. Socio Economic Characteristics
3.1.2.1. Number of Oxen in TLU
- The number of oxen owned by the sample household heads ranged from 0 to 3.3 with mean holding of 1.21 oxen and standard deviation of 0.7839. The average number of oxen owned by the motor pump adopters was 1.5, whereas for non-adopters it was 1.034. The t-test result of mean difference in oxen holding was found to be statistically significant at 5 percent probability level. Livestock ownership is a proxy of wealth. It acts as a source of manure and draft power. Wealthier farmers are better able to bear risks associated to adoption of motor pump. This is consistence with [14] in Ethiopia.
3.1.2.2. Farm Land Size
- The average farm land holding of sample households in the study area was 0.82 hectare with maximum 5ha and minimum 0 hectare. The mean farm land size of adopters and non-adopters of motor pump was 1.13 and 0.64 hectares respectively. The t-test revealed that means difference between the two groups with regarding farm land holding sized was statistically significant at 5 percent probability level.
3.1.2.3. Total Harvested Production Value (Birr)
- The total value of production produced sample households in the study area by rain fed and irrigation ranges from 1600(birr) to 699200(birr) with a mean production value of 56361.41(birr) and standard deviation of 104254.2. The average value of production harvested by motor pump adopting households was 134320.74(birr), whereas by non-adopters it was 13050.67. The t-test result of mean difference in total harvested by motor pump adopters was found to be statistically significant at 1 percent probability level. This is in line with the literature that irrigation increases household production and income.
|
3.1.2.4. Adoption of Motor Pump
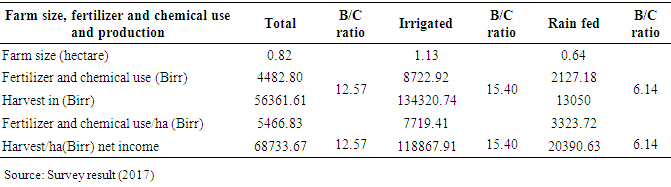
- The total value of fertilizer and chemical expenditure by irrigated and rain fed sample households of motor pump adopters and non-adopters in the study area ranges from 0 to 39800(birr) with a mean expenditure value of 4482.807(birr) and standard deviation of 6636.794. The average value of fertilizer and chemical expenditure by motor pump adopters (irrigated farmers) was 8722.92(birr), whereas by non-adopters (rain fed farmers) it was 2127.188(birr). The difference in fertilizer use was mirrored in the production difference between irrigated and rain fed agriculture, which indicates that access to irrigation boosts fertilizer and chemical use leading to improved yield per hectare. This is in line with previous empirical findings by [13,14]. Table 5 showed that motor pump adopters (irrigation users can produce nearly six times more production than rain fed farmers.
|
3.1.3. Personal and Institutional Characteristics
3.1.3.1. Distance to the Nearest Market
- The total mean distance to the nearest market in the study area ranges from 2km to 15km with a mean of 5.12km and standard deviation of 3.63. The mean distance for adopters was 2.34 km whereas, it was 6.74km for non-adopters. The t-test result of mean difference distance for motor pump adopters was found to be statistically significant at 5 percent probability level. The implication is that the further away a village or farming household is from a market, the less likely it is to adopt new technology.
3.1.3.2. Awareness of Motor Pump
- Awareness of farmers about utilization of motor pump before adopting the technology is very important to effectively use and increase the life time or reduce frequent break down of motor pumps. According to survey result 88 percent of adopters and 49 percent of non-adopters were aware of motor pumps. A chi^2 test showed that there was a significant positive relationship between motor pump adopters and awareness of motor pump below 1 percent level of significance. The implication is that households awareness of motor pump can extend the service life of motor pump by effective utilization like cleaning, repairing oils and lubricants on time and others.
3.1.3.3. Information Access
- Mass media play the greatest role in creating awareness in the shortest time possible over a large area of coverage. Rural farmers create awareness using Medias like national and regional medias like different agricultural best practices, market information and metrological forecasts. The survey results revealed that 84 percent of motor pump adopters and 66 percent of non-adopters own radio. The chi^2 test showed that ownership of radio is statistically significant with the adoption of motor pump below 5% significance level. The implication is that information access plays important role in agricultural technology adoption.
3.1.3.4. Access to Credit
- The survey result revealed that 54 percent of adopters and 28 percent of non-adopters have got credit access from different sources. The chi^2 test showed that it was statistically significant with motor pump adopters at 5% level of significance. The implication is that for irrigation to be profitable, a combination of complementary inputs is required (such as, fertilizers, improved seeds, fuel, and credit). Investment in irrigation equipment (e.g. motor pump) requires sufficient startup capital for which access to credit is crucial. However, when we look the type and sources of credit, it was mainly fertilizer from the government for non-adopters and motor pump adopters have got credit mainly from relatives and friends.
3.1.3.5. Social Participation
- Community leadership in farmers association, cooperative societies and different extension units can play an important role in disseminating innovation and exchanging valuable information. The survey result showed that 96% of motor pump adopters and 79% percent of non- adopters were actively participated in farmers association in leadership status starting from village to kebele level. The chi^2 test shows that it was statistically significant with motor pump adopters at 1% level of probability level. The implication is that household heads that participate in different social organizations acquired different irrigation related information like input and output prices from their relatives, district agricultural and cooperative office experts and development agents that helped them improved irrigation practices. This was consistent with [13] in Ethiopia.
3.1.3.6. Off-farm participation
- The survey result showed that 26% of adopters and 41% of non-adopters participated in off-farm activities. Farmers who participate in off-farm activity are less likely to adopt motor pumps. The chi^2 test showed that it was negatively related to motor pump adoption. Although we can assume that participation in off-farm activity is a means to generate additional income, in the study area, the Productive Safety Net Program (PNSP) is the main off-farm activity, where the poorest farm households get priority.
3.1.4. Bio Physical Characteristics
3.1.4.1. Water Availability
- Irrigation technologies such as motor pumps do not stand alone. The type and source of irrigation water is important as is storage. Access to a body of water is a key factor that affects farmers’ investment in irrigation technologies. The survey result revealed that 36% of the sample respondents have access to shallow ground water, whereas 64% have access to neither ground nor surface water for irrigation. Adopters have 100% access to ground water. The chi^2 test showed that there is a significant relationship between motor pump adopters and shallow ground water below one percent significance of probability level. The implication is that farm households which have better access to water sources are more likely to adopt water lifting technology (motor pump) than those households who have no access to water sources. In other words availability of water sources is not the only factor but also the cost of accessing water is an important factor for the adoption of irrigation technology. Lack of easily accessible water sources and storage structures often hampers farmers’ capacity to adopt and use motor pump.
3.2. Econometric Results and Discussion
3.2.1. Logit Model Estimation Results and Discussions
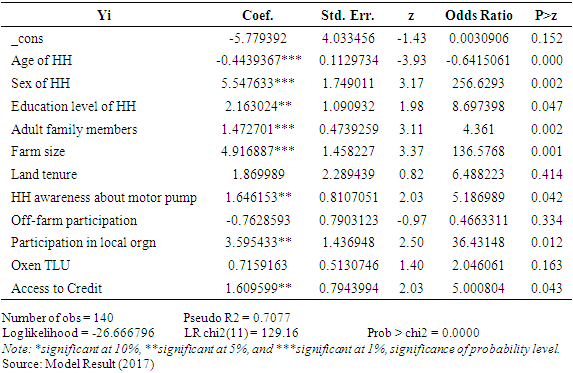
- Before performing the econometric estimation, different econometric assumptions were tested using appropriate techniques. First, the presence of multicolinearity among continuous explanatory variables was tested using variance inflation factors (VIF). Second, contingence coefficient (CC) was used to check the existence of multicollinerty between discrete variables. There was no any continuous or discrete explanatory variable dropped from the estimated model since no serious problem of multicollinearity were detected from both the VIF and contingency coefficient results. Similarly, heteroscedasticity was tested by using Breusch-Pagen test. This test resulted in rejection of the existence of heteroscedasticity hypothesis as (p= 0.0865) using STATA 13. The pseudo-R2 indicates how well the regressors explain the participation probability. The goodness of fit confirmed that the model fit the data. The value of Pearson chi-square test shows the overall goodness of fit of the model significant at one percent probability level. This indicates the models estimate fit the data at an acceptable level. Table 6, shows the logistic regression results. It revealed that factors determining smallholder’s adoption of motor pump are age, gender, education level, ground water availability, number of adult family members, farm land size, social participation, household head aware of motor pump and access to credit.
|
3.2.2. Estimation of Propensity Scores
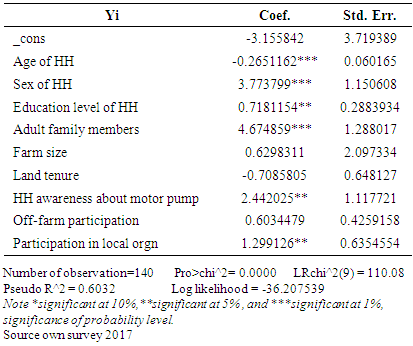
- The logistic regression model was used to estimate propensity score matching for adopting and non-adopting households. As, mentioned earlier, the dependent variable is binary that indicate households’ adoption decision in motor pump. This section presents the results of the logistic regression model which is used to estimate propensity scores for matching adopting households with non-adopting households. As indicated earlier, the dependent variable in this model is a binary variable indicating whether the household was adopting motor pump or not. In the estimation data from the two groups; namely, adopters and non-adopter households were pooled such that the dependent variable takes a value 1 if the household was adopted motor pump (treated) and 0 otherwise. Results presented in Table 8 shows the estimated model appears to perform well for the intended matching exercise. The pseudo-R2 value is 0.6032. A low pseudo-R2 value shows that participant households do not have much distinct characteristics overall and as such finding a good match between treated and non-treated households becomes simple.
|
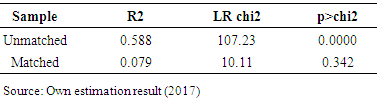
3.2.3. Matching Participants and Non-Participants
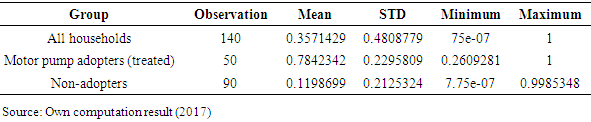
- There are tasks that should be accomplished before one launches the matching task itself. First, predicted values of treatment participation (propensity scores) should be estimated for all participated households and non-participant. Second, a common support condition should be imposed on the propensity score distributions of participant household and non-participant household. Third, discard observations whose predicted propensity scores fall outside the range of the common support region. The pseudo-R2 indicates how well the regressors explain the adoption probability. After matching there should be no systematic differences in the distribution of covariates between both groups and therefore, the pseudo- R2 should be fairly low [22].As shown in Table 9, the common support region would then lie between 0.2609281 and 0.9985348. In other words, households whose estimated propensity scores are less than 0.2609281 and larger than 0.9985348 are not considered for the matching exercise. As a result of this restriction, 4 treated households were discarded. This shows that the study does not have to drop many households from the sample in computing the impact estimator.
|
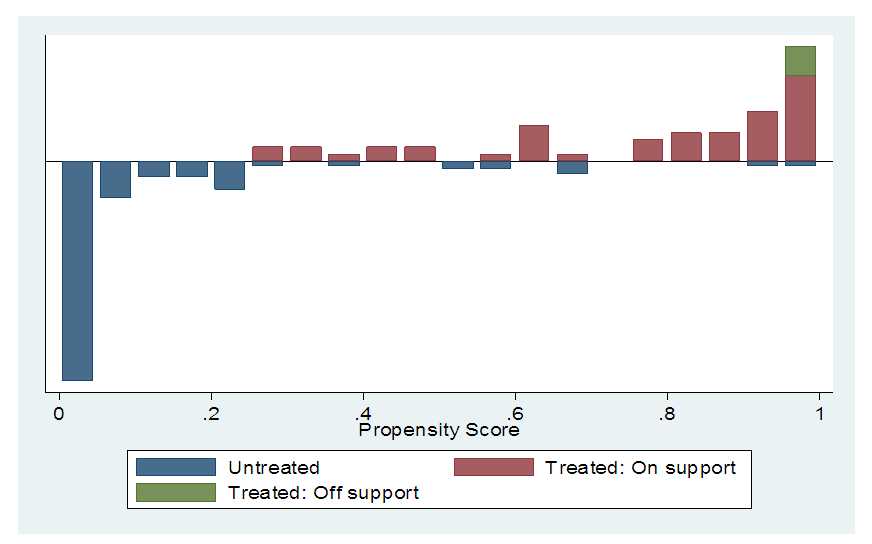 | Figure 2. Propensity score distribution and common support region for propensity score estimation |
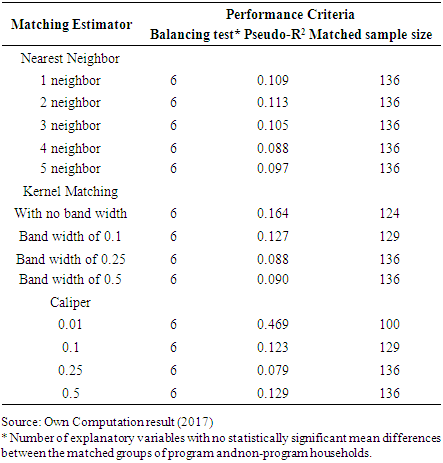
3.2.4. Choice of Matching Algorithm
- The choice of matching estimator is decided based on the balancing qualities of the estimators. According to Dehejia and Wahba [29], the final choice of a matching estimator was guided by different criteria such as equal means test referred to as the balancing test, pseudo-R2 matched sample size. Balancing test is a test conducted to know whether there is statistically significant difference in mean value of the two groups of the respondents and preferred when there is no significant difference after matched. Thus, matching estimators were evaluated by matching the adopter and non-adopter households in common support region. Therefore, a matching estimator having balanced or insignificant mean differences in all explanatory variables, bears a low pseudo-R2 value and also the one that results in large matched sample size is preferred.
|
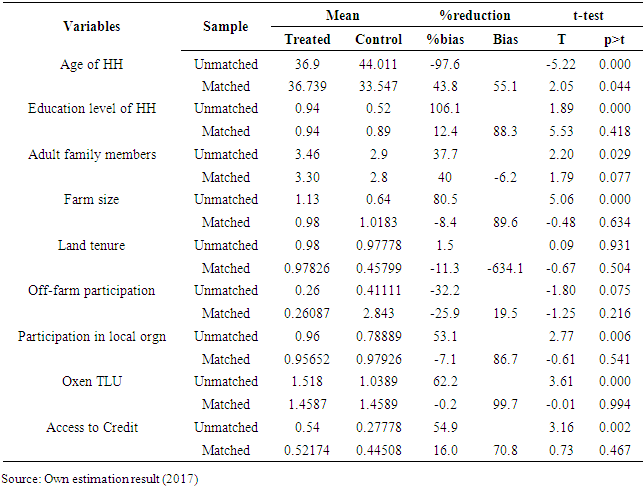
3.2.5. Testing the Balance of Propensity Score and Covariates
- After choosing the best performing matching algorithm the next step is to check the balancing of propensity score and covariate using different procedures by applying the selected matching algorithm(in our case caliper 0.25 matching). The mean standardized bias before and after matching are shown in the fifth columns of Table 10, while column six reports the total bias reduction obtained by the matching procedure.
|
|
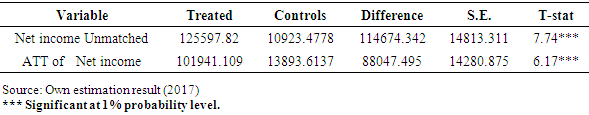
3.2.6. Estimating Treatment Effect on Treated (ATT): Impact Estimate of Adoption of Motor Pump on Household Income
- In this section, the thesis provides evidence as to whether or not adoption of motor pump has brought significant changes on household income. The analysis revealed that adoption of motor pump has a significant positive impact on household income. As it has been discussed in the descriptive section motor pump adopters can expand their irrigated land and fertilizer and chemical utilization due to their access to enough ground water that can easily lift to their field at any essential time that leads to higher production.The Average Treatment Effect (ATT) calculated using radius caliper 0.25 was presented in Table 12 below. The ATT indicated in the table shows that, motor pump adopting households had increased annual agricultural income on average 88047.49 (Birr) per year compared to non-adopting households. This is in line with the objective of water lifting technology (motor pump) adoption which focuses on improving production of high value crops in dry season that have high market value leads them to generate higher income, at least two times production per year and utilization of productivity increasing inputs like pure seeds, fertilizer and chemicals that leads to increase productivity per hectare. This leads to high production and higher income per year. After controlling for pre-intervention differences in demographic, location, institutional and asset endowment characteristics of motor pump adopters and non-adopter households, it has been found that, on average, income of motor pump adopting households is significantly greater than the non-adopters. This finding is in line with previous studies conducted by [13,14,28] found that motor pump adopting households increased annual production and then annual agricultural income.
|
4. Conclusions
- This research was carried out to examine determinants of smallholders’ adoption of motor pump and its impact on income, in Gurage zone Meskan district. In order to gather available information for this study, both primary and secondary data collection methods were used. The primary data source was gathered from 140 sample households using mainly structured questionnaires. The sample respondents were taken from both motor pump adopters (50) and non-adopters (90) households. It was also tried to examine different documents to support the primary sources.On a positive note, this study has found evidence that the irrigation in the study area has shown that motor pump adopting households has more opportunity to harvest more than two times of high value crops that increased their annual production and income compared to non-adopting households. This has an encouraging message for program designers, implementers, and local and regional administrators. The age of the household head has a negative and significant effect on the adoption of irrigation water lifting technologies. Age happens to be one of the human capital characteristics that have been frequently associated with non-adoption in most adoption studies. Among the several reasons that could explain the negative effect of age on adoption is the fact that older farmers tend to stick to their old production techniques and are usually less willing to accept change. In addition young people are associated with a higher risk-taking behavior than the elderly. So a lot has to be done to make younger members responsible to technology related decision making.The availability of higher number of adult family members working on the farm reduces the farms external labour requirements. Moreover, in a situation where the opportunity cost of family labour is low, farm households with higher number of adult labour are likely to adopt labour intensive technologies. This is in line with the policy direction that gives due consideration for the use of agricultural technologies that can intensively use farm household labour and land. Female headed households adopt motor pump less often compared to male headed households. Since female headed households are among the poor, policy interventions in financing investment in motor pump might help to scale up the adoption rate and minimize gender imbalance. Level of education increases the likelihood of adopting household irrigation technology. This indicated the fact that water lifting technologies like motor pump need special technical and managerial skills for their proper utilization. Hence, special training programs (on both operation and maintenance of the technologies) need to be instituted to manage irrigation technologies.The type of water source often influences the type of water lifting technology. Based on the data, groundwater as a source of irrigation were found to positively affect motor pump adoption, implying that motor pumps are suitable in ground and/or surface water potential areas leading to dry season irrigation and production of more than one crop per year. However, extraction of ground water is very expensive. Therefore, establishing private manual well drilling enterprises to provide low cost access to groundwater would expand the irrigated farm production area and offers potential to improve the livelihoods of millions of smallholder farmers.Watershed management and other natural resource conservation activities might have improved groundwater recharge giving the smallholder better access to shallow ground water leading to high adoption of motor pumps.Farmer’s participation in local organizations has a positive influence on the adoption of water lifting technology. This tends to reveal that farmers local organizations play important role in disseminating new innovations, facilitates credit and market network, links products to institutions like cooperative unions. It is necessary to link every farmer with local organizations and strengthen such local organizations. Beyond the regression results, the survey data also show that the cost of motor pumps is high and prices continue to increase. Government taxes account for about 37% of the prices. The cost of accessories and irrigation infrastructures are also quite high for resource poor farmers. The supply of agricultural inputs like vegetable pure seeds and chemicals, fuel and maintenance service is a critical problem. The occurrence of vegetable disease and natural disaster like frost is also become critical problems. Therefore the research institute and universities should work on this area or encouraging research-extension-farmers linkage should solve such problems. The connection of motor pump irrigation with rural electrification program and solar power will encourage smallholder’s irrigation and reduces cost of fuel. Finally the policy makers should give emphasis in establishing private manual well drilling enterprises at local and regional level to provide low cost access to ground water for pro-poor farmers that would expand the irrigated farm production area, and encouraging enterprises that combine the supply of standard pumps, technical support and spare parts to farmers and market for the produce would greatly improve the use of water lifting technologies(motor pump) and brings economic benefits to farmers. Further research using much larger sample size and in different locations should be conducted to gain more insight into the impacts and challenges of household irrigation activities.
Notes
- 1. Dega refers to a highland agro climatic-zone2. Weina dega denotes a mid-altitude agro-climatic region3. Kola refers to a low altitude agro-climatic zone