-
Paper Information
- Paper Submission
-
Journal Information
- About This Journal
- Editorial Board
- Current Issue
- Archive
- Author Guidelines
- Contact Us
American Journal of Economics
p-ISSN: 2166-4951 e-ISSN: 2166-496X
2020; 10(3): 172-186
doi:10.5923/j.economics.20201003.07

Fiscal Federalism and Nigeria Economic Development: Prospect and Challenges
 Abstract
 Reference
 Full-Text PDF
 Full-text HTML
Amire Comfort M. , M. O. Okufuwa
Department of Economics, Crawford University, Igbesa, Ogun State, Nigeria
Correspondence to: Amire Comfort M. , Department of Economics, Crawford University, Igbesa, Ogun State, Nigeria.
| Email: |  |
Copyright © 2020 The Author(s). Published by Scientific & Academic Publishing.
This work is licensed under the Creative Commons Attribution International License (CC BY).
http://creativecommons.org/licenses/by/4.0/

It is believed that state and local governments, been closer to the people will be more responsive to the particular preferences of their constituencies through better ways of providing services that will increase economic welfare is the justification of federalism. It can be fiscal (in which funds are not only transferred from national to the sub-national but also power of raising funds is also given). Nigeria's experience with fiscal federalism which started in 1954 has not produced the desired impact on development indexes despite continuous increase in revenue generation and allocations in accordance with section 162 of the 1999 Nigerian constitution. This prompted the research to examines the impact of fiscal federalism on Nigeria economic development over the period 1981 to 2017. The study measures fiscal federalism in terms of internally generated revenue of states and allocations to the federal, states and local governments and Nigeria economic development to key development indexes such as per capita income, literacy rate and infant mortality rate. Data for the study were collected from Nigerian Bureau of Statistics (NBS), data achieves of Revenue Mobilization Allocation and Fiscal Commission, Statistical bulletin of the Central Bank of Nigeria and UNDP report. Multiple regression model was used and various tests were conducted. Such tests are unit root test for stationarity of the variable through Augmented Dickey-Fuller and CUSUM test for parameters stability. Empirical result indicates that there is, indeed a long-run relationship between fiscal federalism and Nigeria development indexes (measured in terms of per capita income, literacy rate and infant mortality rate). All variables measure of fiscal federalism had a positive relationship with per capita income excluding revenue allocated to the LGA’s, that of mortality rate had a negative relationship with the variables measure of fiscal federalism while that of literacy rate has a mixed relationship with fiscal federalism. There is, indeed, a connection between fiscal federalism and macroeconomic performance in Nigeria over the study period. However, the study recommends that for fiscal federalism to achieve the desired development outcome in terms of higher literacy rate, increases in per capita income and declining mortality rate of infant local government sovereignty is to be full granted by reviewing subsection (4)-(8) of section 162 of the constitution and the tax jurisdiction power between the state and federal government should be reviewed.
Keywords: Federalism, Fiscal Federalism, Economic Development
Cite this paper: Amire Comfort M. , M. O. Okufuwa , Fiscal Federalism and Nigeria Economic Development: Prospect and Challenges, American Journal of Economics, Vol. 10 No. 3, 2020, pp. 172-186. doi: 10.5923/j.economics.20201003.07.
Article Outline
1. Introduction
- In Nigeria, as in other developing countries in Africa, the relationship between the differing governmental levels tends to be tenuous and prone to political economy conflicts, which affects economic growth and development. The intergovernmental conflicts arise mainly from assignment of duties and revenue sharing to accomplish tasks. It is generally believed that the state and local governments are closer to the citizenry and therefore better placed to respond to their development aspirations and challenges Wallace [1], and, [2]. Central to the federalism we practice in Nigeria is the financial relationship between the federation and the states known as fiscal federalism under the 1999 constitution. Specifically, section 162 of the constitution creates the framework for the collection, collation and sharing of finances generated by the entire federation among the federal and state governments. Fiscal federalism is a term sometimes used synonymously with fiscal decentralization. It is a political-economic arrangement whereby the public revenue of a federation is shared among the various levels of government [3]. Fiscal federalism necessitates revenue sharing arrangement (revenue allocation) as section 162 (3) of the constitution requires the federal government to make unconditional grants available to the states and local government on an annual basis to enable them to discharge their constitutional responsibilities. The theory of fiscal federalism holds that for certain public goods, the decision to provide these goods in a decentralized fashion can increase efficiency and accountability in resource allocation [4], and, [5]. This is expected to lead to an improvement in regional and overall economic performance, particularly if sub-national authorities shift resources from current to capital expenditures in search of a better response to local needs [6]. The sustainability of this view requires scientific investigation given the fact that Nigeria, which is a federation, is not in the esteemed club of the world’s wealthiest economies. The important question that remains to be answered is whether lower-level governments’ spending increases or imposes constraints on growth and development.The constitutional conference in 1953 and 1954 led to the introduction of the nation’s federal structure in 1954 and inducted regional autonomy and the balance of power. This enshrined some fundamental principles of fiscal federalism and elements of resource control in view of the level of derivation percentage that the regions enjoyed after independence in the 1960. In the course of the nation’s political evolution, these constitutions were either suspended, modified or repealed by military juntas and the country tilted to a unitary system with a very strong centre [7] and [8]. The introduction of democracy in 1999 re-echoed the problems of intergovernmental fiscal arrangement among the different levels of government. The issues of revenue allocation and the sharing formula have generated such intense debate that led to the demand of a national conference. It was during this period that the ‘resource control’ phenomena rose to an unprecedented dimension such that the struggle for political power became the fight for resource control, regional and local government autonomy and the taxation powers that goes with it. Nigeria's experience with fiscal federalism started in 1954, still faced with many human development challenges such as low literacy rates and high infant mortality rate, low per capita income and living standards, poor primary healthcare delivery and widespread poverty and corruption. A Nigerians life expectancy is 55.2 years according to WHO 2018 which is one of the lowest life expectancies in Sub-Saharan Africa. Infant mortality has been on rise since the 1990s and the maternal mortality rate is one of the highest in the world. Nominal GDP Per capita was $2,049 in 2018, its human capital development remains weak due to under-investment and the country ranked 152 of 157 countries in the world bank 2018 human capital index. Nigeria has the largest number of out of school children in the world which is 10.2 million with about 60% of them in northern Nigeria. and has been notoriously designated as the poverty capital of the world [9].Emmanuel [10] argued that the problems of the Nigerian federal system have more to do with the politics of revenue - values that governments and politicians seek to maximize, within given state–society relations, and how these have determined the character and use of fiscal arrangements rather than focusing on the traditional public interest approach to over-centralization and vertical imbalances in expenditure responsibility and revenue distribution. The struggle for power, with its promise of control of public (largely oil-based) revenue, has distracted the leadership from focusing on broad development and welfare.The empirical studies carried out to examined the effects of the level of decentralization of government activities including revenue allocation on Nigeria’s economic development using econometric analysis can be seen in [11], [12] and [13]. Missing from the empirical literature on Nigeria is on empirical analysis of the impact of fiscal federalism on development indices (per capital income, education and health service). In an attempt to fill this void, this study is therefore an extension of a previous study of Samuel and Dickson[13] work on the econometric analysis of fiscal federalism and economic welfare where the economic welfare is measured only by per capita income as indicators not considering other indicators such as level of health service and education.
1.1. Objectives of the Study
- The broad objective of this study is to examine the relationship between fiscal federalism and economic development in Nigeria. The specific objectives are as follows. To:i. Determine the effect of revenue stock to the central, state and local governments on Nigerian’s development index.ii. Examine the effect of derivation funds allocated to the states on economic welfare (Literacy rate, Mortality rate and Per Capita Income).iii. Analyse the impact of fiscal federalism on education (Literacy rate), health (Mortality rate of infant) and Per Capital income of Nigerians.
2. Literature Review and Theoretical Framework
2.1. Fiscal Federalism: Nigeria Political and Economic Development
- The major argument in favour of Fiscal decentralization is that uniform levels of public goods and services across jurisdictions will generally be inefficient [1]. Resources can be saved without making anybody worse off by diversifying government outputs in accordance with local demands. Decentralization holds great promises for improving the delivery of public services, but the outcomes depend on its design and on the institutional arrangements governing its implementation [6]. Specifically, the argument that decentralization promotes allocative and productive efficiency assumes that the devolution of functions occurs within an institutional environment that provides political, administrative, and financial authority to local governments, along with effective channels of local accountability and central oversight.There is a worldwide consensus that improved service delivery such as investment in education, especially basic (primary and lower secondary) education contributes to poverty reduction through enhancement of productivity of the poor’s labour, by reducing fertility and improving health. Hence, improving access to primary health and basic educational services which could impact positively on the poor, will promote growth. Currently, Nigeria seems a long way off the track towards the achievement of this lofty objective. In its 2005 report, the African Economic Outlook (AEO) noted that the net enrolment ratio in primary education indicated that there is only one country in the whole of Africa, which has achieved the Millennium Development Goals (MDGs) objective of achieving universal primary education. The AEO further reports those African countries’ health indicators such as infant mortality rate, life expectancy at birth, maternal morbidity and mortality rates are among the worst in the world. One in six children born in low-income Africa will die before the age of five. More than a third of young children are malnourished. Maternal mortality rates are as high as 1600 per 100,000 births for Africa. The report concluded that achieving the MDGs will be extremely difficult for African countries.In Nigeria, the poor performance of basic social service indicators in the education and health sectors, policy analysts are often constrained to ask if Nigerian administrators are able to access sufficient resources to meet relevant expenditure assignments at sub-national levels of government. Statistical bulletins reveal that between 2001 and 2017, the Federal government, states (including the 13% derivation to the oil producing state) and local governments spent over N83,825 trillion. With such huge allocations to the three-tiers of government, it is expected that basic necessities such as pipe-borne water, electricity, health services, educational facilities, roads etc., would be adequately provided. On the contrary, these services where they are provided are either grossly inadequate or highly inefficient.Revenue sharing in federal systems is usually guided by some basic principles, including the ‘fiscal independence’ of each unit of government to raise and spend funds in a manner that preserves its autonomy [14]. Another principle is that of ‘fiscal efficiency’, which implies that efficiency must be applied in the allocation of revenue. Thus, the military intervention in 1966, the fiscal relationship changed as a result of the suspension of the constitution. This, in effect, empowered the federal government to impose any tax, thereby curtailing the fiscal powers of the states. Also, been the genesis to the problem with the existing sharing formula. Odoko & Nanna [15], noted that, in terms of revenue assignment, the fiscal system in Nigeria gave little or no room for fiscal autonomy to the regional governments. There is still conflict over the principle of derivation as the acceptable sharing formula. The principle of derivation which is the most imperative basis for allocation among other principle such as need, equality, and national interest.Figure 1 below illustrates, the derivation principle which witnessed a progressive reduction, beginning in 1970 when it was set at 25%, down to 3% towards the terminal end of military rule. But by 1999 when the country returned to democratic rule, the share of Nigeria’s Federation Account going to the oil-producing states under the principle had increased to 13%.
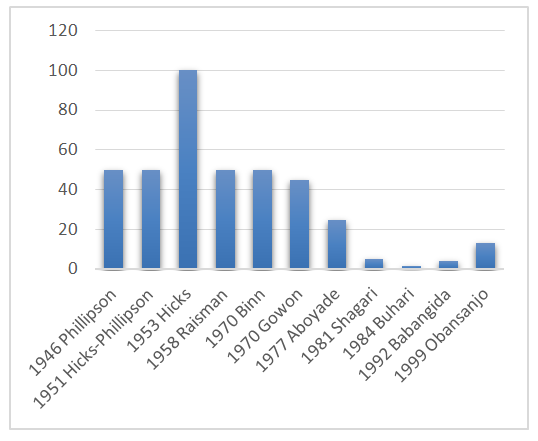 | Figure 1. Principle of Derivation, 1946–99 (Source: Dele, 2014: [16]) |
 | Sources: NBS [17] National Bureau of Statistics First Quarter Report. |
2.2. Empirical Review
- A large number of studies have been conducted on fiscal federalism and development both in the developed and developing countries. In an empirical analysis for average economic growth of the past 25 years in a cross-section of 91 countries, Ruben and Ekaterina [19] show that the effects of fiscal decentralization depend to a large extent on the structure of the party system as well as on the degree of “subordination” of subnational levels. According to them, especially in developing and transition countries, the age of the most important political parties is favourable to the positive effects of decentralization on economic growth. In countries with a – in this respect weaker – party system, a 10 percent increase of decentralization of revenue decreases real per capita GDP growth by 0.14 percentage-points. These results are in contrast to those of Jorge and Robert [20]. The latter finds that the decentralization of revenue significantly reduces the growth of real GDP per capita of developed countries, but not of the developing and transition countries. Equally, Jorge and Robert [21] in a study finds out that allocation of revenue significantly reduces the growth of real GDP per capita in developed countries.In Nigeria, Eze and Kalu [8] focus on the role of the financing sources of Nigerian State governments in the financing of their real asset investments. Using the OLS technique, the paper finds that Federal allocation and stabilization fund are significant in the financing of real asset investments at both 5% and 1% levels of significance. Internally-generated revenue (IGR), loans (LNS), Grants (GT) and value added tax (VAT) are found insignificant in the financing of the real asset investments of Nigerian state governments for the period 1984-2008. Usman (2011), assessed the impact of revenue allocation on economic growth in Nigeria, which was his main objective utilizing OLS technique. Where there exists a link between revenue allocation formula and economic growth when one considers the position of government capital formation. This result shows that there exists a direct relationship between the revenue allocation formula as proxies for the share of federal, state and local government from the federation account and economic growth process in Nigeria. This implies that the revenue allocation formula is a catalyst for economic growth and development. The sign of the variables conforms to the a priori expectation which is positive, except for the share of the state that is not statistically significant. Usman deduced from his findings that the share of local and federal government from the federation account contributes to the economic growth process of Nigeria. Hence, the share of local government must be increased for improved performance. In consonance with Usman [11] findings, Dagwon [12] study’s findings show that revenue allocations have significant causal relationship with economic development in Nigeria, with only revenue allocation to states having significant negative relationship. Unidirectional causality runs from revenue allocations to real GDP in Nigeria. Using Error correction model (ECM), Pairwise Granger Causality test in analyzing the data and test of long-run relationship among the variables using Johansen Co-integration test over the period from 1993 to 2012. His study recommends among others that more financial control and value for money audit should be carried out to minimize wastages and corruption in the states of the federation, so as to change the direction of influence of states’ revenue allocation on economic development.Eme [6] using a panel data of the 36 states and the federal capital territory covering the period of 2002 to 2009 in his on the linkage between fiscal decentralization and social outcome measured in terms of infant mortality rate and literacy rate in Nigeria revealed that higher fiscal decentralization is consistently associated with lower mortality rate and higher literacy rate. He further accreted that the benefits from fiscal decentralization are not particularly important for states with high population and low internally generated revenue; the internally generated revenue enhances literacy rates and reduces infant mortality. While Samuel and Dickson [13] investigate the effect of fiscal federalism on economic welfare measured in terms of Per capita income using OLS and Johansen Co-integration technique. The findings revealed the fiscal federalism have mixed relationship with per capital income but there exists a long-run relationship. Olarewaju [4] examines the effect of fiscal decentralization on macroeconomic performance in Nigeria. The study employs three measure of fiscal decentralization namely revenue measure, expenditure measure and simultaneity measure on some selected indicators of macroeconomic performance such as economic growth, inflation rate, interest rate and exchange rate. The analysis of the result was present in four (4) regression using Vector Autoregressive (VAR) econometric techniques where he found to be a positive and highly significant relationship of fiscal decentralization and economic growth and a positive but statistically insignificant relationship of fiscal decentralization and inflation, exchange rate and interest rate over the period from 1980 to 2010.Nandes [22] using qualitative and historical materials that were critical and analytical in providing detail to achieve the objective of this study which is to examine fiscal federalism and how it affects development in Nigeria. It was established that the nature of fiscal relation in Nigeria strongly contributed to the challenges of development in the country. Also unveil that the non-diversification and the over reliance on the oil sector further exacerbated the situation.
2.3. Theoretical Framework
- The main economic justification for decentralization rests largely on allocative or efficiency grounds. It is generally believed that the process of decentralization can substantially improve efficiency, transparency, accountability, and responsiveness of service provision compared with centralized systems. To analysis the broad objective of this research which is to examine the relationship between fiscal federalism and economic development in Nigeria. The researcher is adopting decentralisation theorem by Oates which state that the basic role of the government is to maximize social welfare and the equalisation theory. In a setting of perfect information, it would obviously be possible for a benevolent central planner to prescribe the set of differentiated local outputs that maximizes overall social welfare and there would be no need for fiscal decentralization. Absent of that, uniform levels of public goods and services across jurisdictions will generally be inefficient. Resources can be saved without making anybody worse off by diversifying government outputs in accordance with local demands, i.e. decentralized expenditures may cause greater “consumer efficiency”. Hence, ‘Pareto’ efficiency can be raised through fiscal decentralization. However, given the fiscal imbalances “disparity between different levels of government in their expenditure commitments and their access to revenues” in a federation there is a need for lump sum transfers from the central government to decentralized governments known as inter-governmental fiscal arrangements to correct for distorted migration patterns for the social welfare maximization be attainable through the provision of public goods [23].This social welfare maximization measured in the quality of human life in a country has been the focus of 1990s development economists by introducing the human development index as a prerequisite of development but still laying it foundation on endogenous growth theory (new growth theory) which the study adopts. Developed in the 80s by Paul Romer stresses government investment in human capital innovations, knowledge, and control of externalities which is a consequences of higher per capital income and efficient service delivery rather than the higher savings and capital-output ratio in an economy- savings ratio indicates the ratio of savings to national income while capital-output ratio indicates how much capital is needed to generate a given amount of national output which the neo-classical stresses [24].Therefore, the theoretical model proposed to understand the relationship between economic development and fiscal federalism having reviewed relevant theories related to this study is presented in Figure 2 below.
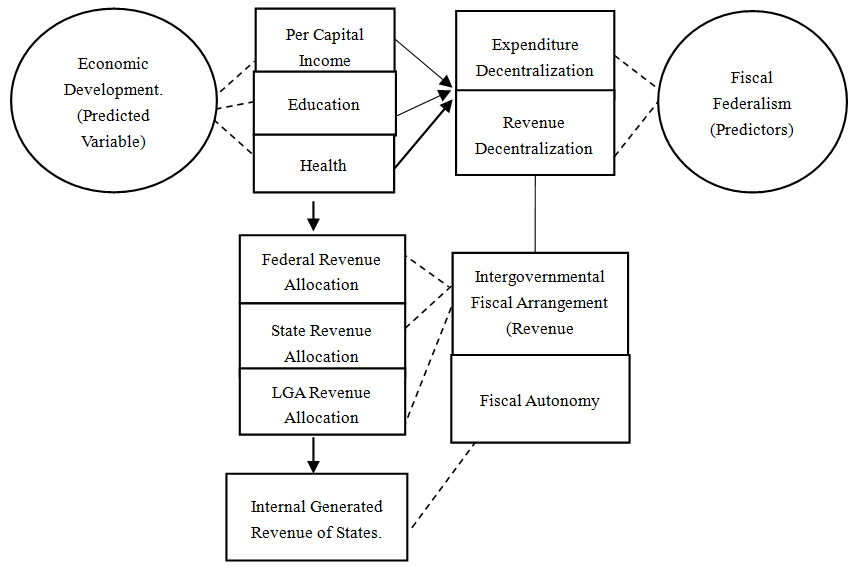 | Figure 2. Framework on Fiscal Federalism and Economic Development. (Sources: Okufuwa Model 2019.) |
2.4. Summary of Literature Review/ Research Gap
- From various literatures that were reviewed, it became clear that there was little uniformity in the approaches as well as methodologies adopted in the studies so far. For instance, Dagwon [12] reviewed impact of revenue allocation with economic development, Ogunlana [4] Flow of Fiscal Responsibility Among Layers of Government. Equally, as Eshanake and Oyovwi [13] analysis fiscal federalism on economic welfare measured in terms of per capita income, Cinjel [22] using a qualitative approach examines fiscal federalism and how it affects development in Nigeria, among others. While some adopted qualitative research design, others utilized quantitative research design and applied OLS, Johansen co-integration and error correction model (ECM) for data analysis.The above shows divergence in approach and methodology. Sequel to this, we examine the impact of fiscal federalism and economic development of Nigeria using qualitative research design, measuring economic development in terms of per capita income, literacy rate and infant mortality rate of Nigeria. The index of development used in this research (Per capita income, literacy rate and infant mortality rate) took the discussion on this topic beyond the usual realm which none of the works reviewed used these variables. This will help to fill a long-standing gap in knowledge that development indexes are the justification of fiscal federalism.
3. Methodology
3.1. Data Analysis Technique and Source of Data
- The type of data employed in carrying out this research was secondary data acquired was from different sources e.g Nigerian Bureau of Statistics, the Revenue Mobilization Allocation and Fiscal Commission, the Central Bank of Nigeria - Statistical bulletin and both Federal and State Ministries of Finance and Audited accounts of each tier of the governments, UNDP report, journals and text books for the period of 36 years (1981-2017) and its time series in nature. The research employed a multiple linear estimation in order to uncover the explanatory powers of the variables used in the estimation and also to understand which among the explanatory (independent variables) are related to the dependent variable. The econometrics model used in analysing the research data was based on the result of the pre-test (Unit Root Test) which is a yardstick for suitable econometric(s) model. Affirmation from the pre-test indicate that Johansen co-integration, The Engle-Granger test for cointegration techniques was suitable to test the validity of long-run equilibrium relationship between studied variables.
3.2. Model Specification
- In order to analyze more closely the links between fiscal federalism and economic development, the empirical models of this study are derived from the theoretical framework discussed above. The empirical models are grouped into three sets of equations comprising of Per Capita equation, Literacy rate equation and Mortality rate of infant equation each to achieve the objective of development. The interaction of the variables in the model will have important implications for both estimation and interpretation of the model’s parameters. The models are presented below.
3.2.1. Per Capita Income Model
- The model was developed as an extension of other studies [13], but with some modifications.
 | (1) |
 | (2) |
 | (3) |
3.2.2. Literacy Rate Model
- The model employed in this section was drawn from David (2002) [25] and Eme [6] but with some modifications.
 | (4) |
 | (5) |
 | (6) |
 | (7) |
3.2.3. Infant Mortality Rate Model
- The specification of Mortality rate (MR) model was an extension of the David (2002) and Eme [6] but with some modifications.
 | (8) |
 | (9) |
 | (10) |
 | (11) |
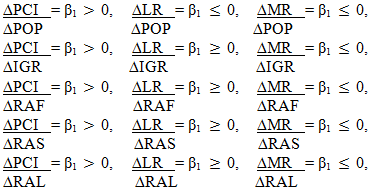
3.3. Economic A Priori Criteria
3.4. Estimation Method
3.4.1. Unit Root Test
- This test is a pre-test that was used to shows the stationarity of the variables specified and a yardstick for chosen further investigation approaches. The Augmented Dickey Fuller and Philip Peron critical value of statistic was the decision rule to either accept or reject a hypothesis and it appears in 1%, 5% and 10% level of significance as the case may be.
3.4.2. Co-integration Test
- This test was conducted after the unit root test when stationarity have been established in the same order of integration [1]. It is also used to extract the long run equation which determines the long run relationship among variables. Co integration test indicates its significance through the trace or rank statistical and the probability values of variables under consideration.
3.4.3. Vector Error Correction Mechanism
- The error correction mechanism was used as an estimation of variables which are co integrated of the same order and also used to check the existence of short and long run relationship among variables. This test also indicates the speed of adjustment of an economy from disequilibrium to equilibrium point and the higher the coefficient of the R2, the better the model adjustment from short run to long run equilibrium.
4. Data Analysis and Interpretation
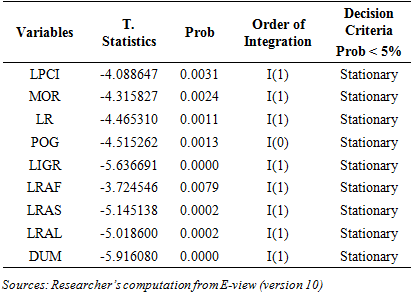
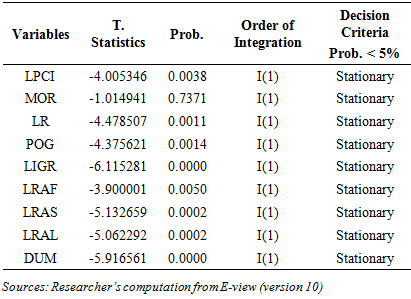
4.1. Unit Root Test (Stationary Test)
- The result for the test of stationarity using the conventional Augmented Dickey-Fuller (ADF) and Phillips-Perron tests are presented in Table 1 and Table 2.All the variables were stationary at 1st differentials for ADF Test expect POG (Population Growth Rate) which is stationary at level of the test statistics at the 1%, 5% and 10% level of significance shown in Table 1. Table 2 of the Phillips-Perron test founds that all variables in the model were stationary at 1st differentials. Base on the result, the Phillips-Perron test was adopted as it suffices the criteria for co- integration.
|
|
4.2. Co-Integration Test
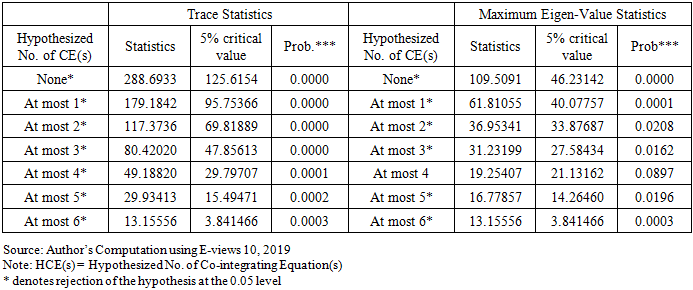
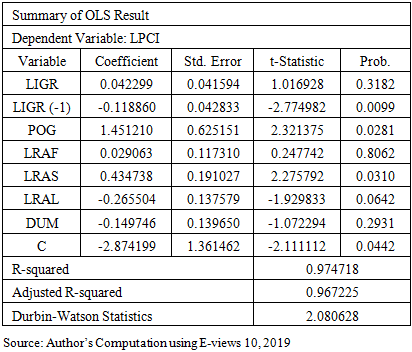
4.2.1. Per Capita Income Model
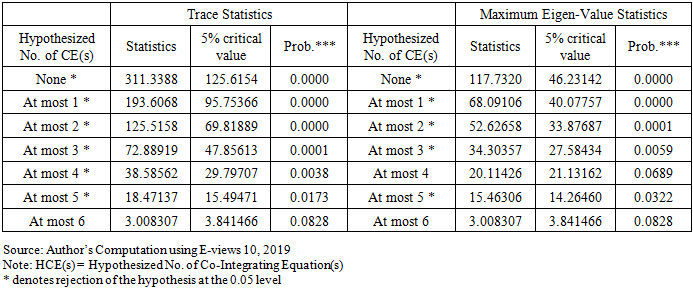
- The existence of unit root in the model as explained by the Phillip-Perron test above prompted the investigation of long run influence of the independent variables (population growth rate, internal generated revenue, revenue to the Federal, State and Local Government and the dummy variable that capture the 13% derivation funds) on the dependent variable (Per capital income).The Johansen co integration Table 3 reveals seven (7) co integrating vectors for Trace statistics while that of Maximum Eigen-value indicate six (6) co integrating vectors at 5% critical level, which depict a long term equilibrium relationship between per capital income and other explanatory variables. This also means that the pre-test (unit root test) is not spurious.
|
|
|
4.2.2. Literacy Rate Model
- The existence of unit root in the model as explained by the Phillip-Perron test above prompted the investigation of long run influence of the independent variables (Population growth rate, Internal generated revenue, Revenue to the Federal, State and Local Government and the dummy variable that capture the 13% derivation funds) on the dependent variable (Literacy rate).The Johansen co integration Table 7 reveals Six (6) co integrating vectors for Trace statistics while that of Maximum Eigen-value indicate Five (5) co integrating vectors at 5% critical level, which depict a long term equilibrium relationship between literacy rate and other explanatory variables. This also means that the pre-test (unit root test) is not spurious.
|
|
|
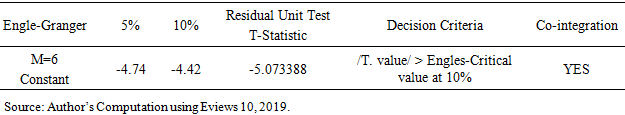
4.2.3. Mortality Rate Model
- The Engle-Granger test result for co-integration relationship is stated in Table 9. The T – statistic clearly indicates the presence of co-integration as the residual unit root test statistic in an absolute form is greater than the critical value of the Engle-Granger at 10% level of significant.
|
|
4.3. Vector Error Correction Mechanism
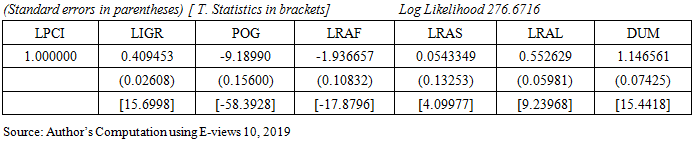
4.3.1. Per Capita Income Model
- The rule of VECM holds that there should be a negatively signed and statistically significant error correction. The result for VECM, for Fiscal Federalism impact on Per Capita income shows a coefficient of – 0.782294 and p value of 0.0015. The borne sign and the significance of the coefficient are the necessary conditions for any disequilibrium to be corrected. This means that the identified economic variables add 78.23% per year to Per Capital Income for equilibrium to be restored in the long run.The computed coefficient of multiple determination (R2) value of 0.757772 indicated that the model satisfied the requirements for goodness of fit. The computed statistics showed that 75.8% of the total variation in Per Capital Income (PCI) is accounted for by the explanatory variables: Population Growth Rate (POG), Internal Generated Revenue (IGR), Revenue Allocation to the Federal Government (RAF), Revenue Allocation to the State Government (RAS), Revenue Allocation to the Local Government (RAL) and Dummy Variable which captures the 13% derivation funds while 24.2% of the changes in Per Capital Income are attributable to the influence of other factors not included in the regression equation. The DW (Durbin-Watson) has the value of 1.937732 which indicates the absence of auto correlation among the residuals.
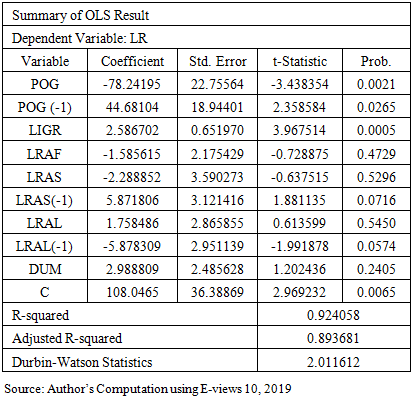
4.3.2. Literacy Rate Model
- The rule of VECM holds that there should be a negatively signed and statistically significant error correction. The result for VECM, for Fiscal Federalism impact on Education (Literacy Rate) shows a coefficient of – 0.327608 and p value of 0.0122. The borne sign and the significance of the coefficient are the necessary conditions for any disequilibrium to be corrected. This means that the identified economic variables add 32.76% per year to Literacy Rate for equilibrium to be restored in the long run.The computed coefficient of multiple determination (R2) value of 0.618455 indicated that the model satisfied the requirements for goodness of fit. The computed statistics showed that 61.8% of the total variation in Literacy Rate (LR) is accounted for by the explanatory variables: Population Growth Rate (POG), Internal Generated Revenue (IGR), Revenue Allocation to the Federal Government (RAF), Revenue Allocation to the State Government (RAS), Revenue Allocation to the Local Government (RAL) and Dummy Variable which captures the 13% derivation funds while 38.2% of the changes in Literacy rate are attributable to the influence of other factors not included in the regression equation. The DW (Durbin-Watson) has the value of 1.743337 which indicates the absence of auto correlation among the residuals.
4.3.3. Mortality Rate Model
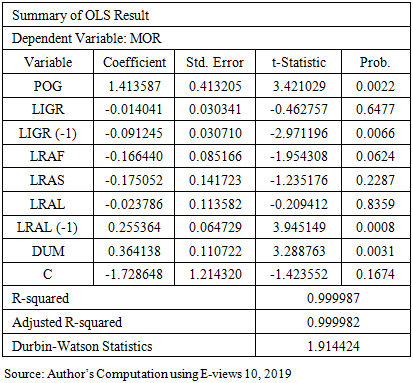
- The result for VECM, Fiscal Federalism impact on health (Mortality rate of infant) shows a coefficient of – 0.016204 and p value of 0.0002. The borne sign and the significance of the coefficient are the necessary conditions for any disequilibrium to be corrected. This means that the correction of disequilibrium or the speed of adjustment is at the rate of 1.6% annually. The computed coefficient of multiple determination (R2) value of 0.984821 indicated that the model satisfied the requirements for goodness of fit. The computed statistics showed that 98.4% of the total variation in Mortality rate is accounted for by the explanatory variables: Population Growth Rate (POG), Internal Generated Revenue (IGR), Revenue Allocation to the Federal Government (RAF), Revenue Allocation to the State Government (RAS), Revenue Allocation to the Local Government (RAL) and Dummy Variable which captures the 13% derivation funds.
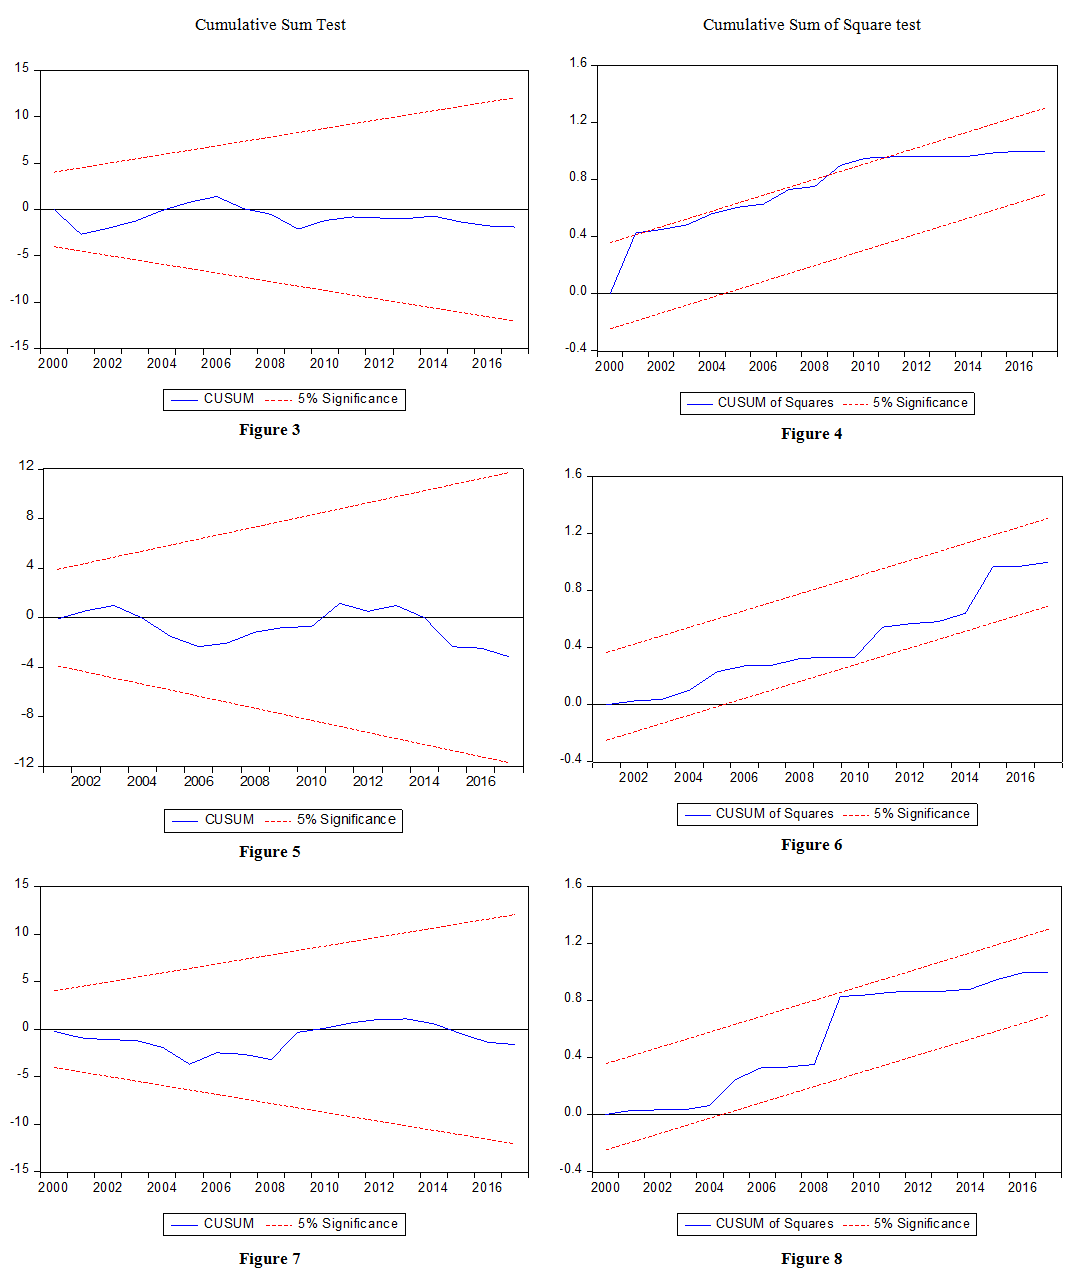
4.4. Cumulative Sum of Recursive Residual (CUSUM) Test
- This was a test of parameters stability. Its determine the coefficient changing behaviour. This was necessary in view of the fact that stability of model will explain the extent to which we can make forecast concerning behavior of the variables in the model. The stability diagnostic test reveals the stability of the variables through the test above plotted against break points in the data. This test is significantly determined in such a way that the stability of short run dynamics and the long run parameters of the variables must be within the 5 percent critical bound lines, represented by two red straight lines.To determine either the coefficients are changing systematically or suddenly, both cumulative sum test (which helps to show if coefficient of regression are changing systematically) and cumulative sum of square test (which is helpful in showing if the coefficient of regression changing suddenly) will be used. Guideline 1: if we find blue line (CUSUM) between/ within the two critical line (redline) we accept null hypothesis (parameters are stable/ desirable), otherwise we accept alternative hypothesis (Unstable/Undesirable).To this end, Fig. 3, Fig. 5, Fig 6, Fig. 7, Fig. 8 in table 11 indicates stable variables of estimation in this research expect Fig. 4.
 | Table 11. (CUSUM) Test |
4.5. Discussion of Result
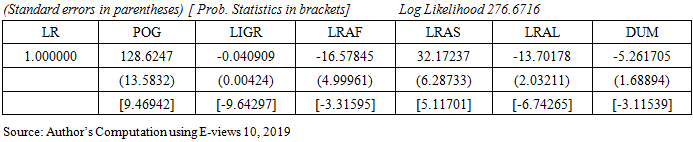
- The broad objective of this research is to examine the impact of fiscal federalism on economic development. The three measures of development were per capital income (PCI), literacy rate (LR) and mortality rate (MR). The measures of fiscal federalism which is internally generated revenue (IGR), revenue allocated to the federal government (RAF), revenue allocated to states governments (RAS) and revenue allocated to the local governments authorities (RAL) were found to exist a long-run relationship with Per capital income (PCI) in Table 3. This is consistent with the study of Dagwon [14] and Samuel & Dickson [13]. The short-run dynamic result reveals that the share of the federal and state government from the federation account contribute positively to the Nigerian’s per capita income while revenue allocated to the LGA’s that has a negative relationship as reported in Table 5. The literacy rate (LR) and Mortality rate (MR) measure of development in relation to fiscal federalism were found to be a long-run relationship in Table 6 and Table 9. The coefficient measures of fiscal federalism, internally generated revenue (IGR), and revenue allocated to the local governments authorities (RAL) have a positive weak significant relationship with literacy rate while the revenue allocated to the federal government (RAF), revenue allocated to states governments (RAS) have a negative insignificant relationship with literacy rate contrary with the findings of Eme [6] as reported in Table 8. The justification for this, is the displace priority of the federal and state expenditure on education as revenues meant for developmental programmes are diverted for private use, misappropriated and misapplied resulting to 10.2 million children out of school with about 60% of them in the northern Nigeria, infrastructural deficit and decay and inadequate instructional materials while the evidence in Table 10 shows that the higher the share of decentralized revenue to the federal, state and local government is consistently associated with lower mortality rates amongst infant in Nigeria which is consistent with the inverse relationship of Eme [6]. Also, the coefficient of state own source of revenue is significant in both models (literacy rate and mortality rate). A plausible explanation for this finding is that when state own source of revenue is high, state governments can better fund health and education services with internally generated revenue thus, depending less on transfers from the federal government. A typical example is the case of Lagos state where internally generated revenue has increased significantly over the last 5 years and has reduced the state’s dependence on revenue from the center. The subsequent objective is to examines the effect of derivation funds allocated to the states on economic welfare (Literacy rate, Mortality rate and Per Capita Income). Evidence from Table 5 and Table 8 indicate that per capital and the literacy rate of Nigerian’s were indifferent during the military regime of no derivation funds and during civilian regime of derivation funds. As per capital income was negative during the regime of no derivation funds to the states. This justifies the massive inflow of oil rents into the coffers of those states in the Niger Delta area, especially in the post-military era, due to the implementation of the derivation principle which did not translate into improved socio-economic well-being for the citizens, but instead only resulted in the intensification of corruption. Due to a lack of adequate checks on office holders, particularly the governors, state funds became siphoned mostly through kickbacks from contractors, whilst social services such as education were grossly underfunded. But that of mortality rate of infants a measure of health disclosed a positive significant deference between the two regimes (military and civilian) of the derivation funds as evidenced in Table 10. This means morality rate was better improved in the civilian (derivation funds) regime than that of the military (no derivation funds) regime. The final objective is to determine the effect of revenue stock to the central, state and local government on Nigerian’s development index. Evidence from Table 5, 8 and 10 the stock of revenue to the central has a weak significant effect on the Nigerian’s development index, as it positively improves per capital income and effective in mitigating mortality rate in Nigeria for the period under review while the stock of revenue to the states and local governments has been insignificant in relation to the Nigerian’s development index. The insignificant of the stock of revenue to state and local government is as a result of corruption, limited fiscal arrangement, low quality of bureaucracies and absence of skilled manpower.
5. Conclusions and Recommendations
- The clamour for restructuring or what Nigerian politicians call “true federalism” which is the ability of the sub-nationals to have complete autonomy in the control and management of their own resources and contribute some quota of their income to the federal government is based on the thinking that it will improve the economic welfare of Nigerians. However, the literature is not conclusive on this assertion. As the findings of this study is mixed. The stock of revenue to the federal and state government improves Nigerian’s income per head while that of the local government have a negative significant influence. Whereas, the internally generated revenue of the states positively influences the per capital income. Also, in terms of education measured in literacy rate of 15 age and above. It’s only the stock of revenue to the local government that positively improves the literacy rate of Nigeria’s which is consonance with Stigler [26] statement that “a representative government works best when it is closer to the people”. Carrying Stigler’s statement further Wallance [27] also state that “local outputs targeted at local demands by respective local jurisdiction clearly provide higher social welfare than the central provision”. That of health measured in mortality rate of infant, the stock of revenue allocated to the three tiers of government are effective in mitigating mortality rate of Nigerian’s. To this end for fiscal federalism in Nigeria to achieve its economic development potential “ceteris paribus” there is need for fiscal reform efforts to focus on: i. Redesigning revenue systems so as to provide decentralized levels of government a much-expanded access to own-revenues to finance their budgets and thereby reduce their dependence on transfers from above. ii. The quality of local bureaucracies relative to national bureaucracies should be given consideration as qualified individual are attracted to better careers offer, more possibilities of promotion and remuneration. This will reverse the negativity of local government impact on Nigerians income per head has qualified individuals will be abundant in handling developmental project. iii. Corruption undoubtedly plays a part in making the practice of federalism in Nigeria a herculean task, as its constitutes a leakage from the economy and distorts economic growth, increases the cost of administration, making governance unnecessarily expensive. Therefore, control measure should be put in place to checkmate possible corruption (frauds, nepotism and embezzlement), mismanagement and misappropriations of public funds meant for public interest among those in political authority to achieve the basic benefit of fiscal federalism.iv. Anti-graft agency’s such as Independent Corrupt Practice Commission and Economic and Financial Crimes Commission in the county should be political independent in their prosecution and investigation of corrupt individuals as this will mitigate the misappropriation and embezzlement of funds channelled to the key sectors such as education and health.