Alaoui Elmrani Driss, El Mezouari Saïd
National School of Business and Management, Hassan 1 University, Settat, Morocco
Correspondence to: Alaoui Elmrani Driss, National School of Business and Management, Hassan 1 University, Settat, Morocco.
| Email: |  |
Copyright © 2020 The Author(s). Published by Scientific & Academic Publishing.
This work is licensed under the Creative Commons Attribution International License (CC BY).
http://creativecommons.org/licenses/by/4.0/

Abstract
One of the most significant innovations in the Islamic financial capital market in the last decade is the development of Sukuk instrument. In this paper, we aim to compare the volatility between Sukuk and the conventional bond indices volatility in a post-crisis context. Various statistical tests and GARCH family models were applied and analyzed using E-views 7.The results showed that bad news had a better impact on volatility than good news in the Sukuk Market. We conclude that the government Sukuk index was slightly less volatile than the government bond index in the long run.
Keywords:
Sukuk, Daily returns, Conditional volatility, GARCH models and leverage effect, Post crisis period
Cite this paper: Alaoui Elmrani Driss, El Mezouari Saïd, Modelling the Sukuk Market Volatility, American Journal of Economics, Vol. 10 No. 3, 2020, pp. 132-137. doi: 10.5923/j.economics.20201003.03.
1. Introduction
One of the most significant innovations in the Islamic financial capital market in the last decade is the development of Sukuk instrument. Thus, it experienced a growth rate of 32% from an overall amount of issuances of 87.9 billion in 2016 to 116.7 billion in 2017 (IIFM Report 2018).Sukuk are debt certificates that meet the needs of investors in a sharia-compliant framework.The returns to Sukuk holders represent rights to receive payments from a trade transaction, ownership of a particular asset, or a business venture. In contrast, the returns to conventional bondholders represent the right to receive indebtedness for borrowed money, Tahmoures, Afshar. (2013).This why Sukuk are based on underlying transactions that create a close link between financial and productive flows.In this light, we investigated the volatility behavior of this Islamic instrument en comparison to their conventional counterparts in the post-crisis period. The studies of volatility have been conducted almost exclusively in the context of conventional stock and bond markets. However, empirical studies on the Sukuk market are limited.To the best of our knowledge, there is one paper of Sulistya Rusgianto and Nursilah Ahmad (2013), that examined the volatility behavior of the Sukuk market under consideration of structural break. The Dow Jones Citigroup is used as a proxy of the global Sukuk market for this study. The results indicate that structural breaks significantly alter the volatility behavior of Sukuk. Authors showed also that the volatility during the pre-crisis and contemporaneous periods is more sensitive to market events compared to the post-crisis period.At this early stage of academic research, this paper aims to contribute in three ways. To the best of our knowledge, this is the first paper extending the literature on Islamic Finance by studying the government Sukuk index volatility and comparing its behavior to conventional government bonds in the long run. Secondly, this academic research is also the first to study the volatility of Malaysian Sukuk market using the symmetric and asymmetric GARCH models. Thirdly, we add our findings on the volatility behavior of government Sukuk, focusing on a post-crisis time frame.The study tried to address three issues. First, does government Sukuk return volatility have long term impact? Second, is there asymmetric volatility in the government Sukuk index? Finally, Does the government Sukuk index present lower volatility than the government bond index?Before considering such a comparative study of modeling the volatility of both government Sukuk and bond indices and to verify if there is any asymmetric volatility in their returns structure, we are going to exhibit some statistical properties of the government Sukuk index return to see if they capture most of the stylized facts observed in financial time series.Empirical studies have analyzed the stochastic behavior of financial series and summarized it in the form of stylized facts, including papers of Cont (2001) and Swell (2011) describing some common properties to most conventional financial series; including asymmetry and leptokurtic and the heteroscedasticity effect of the return distribution. We will first see if those properties are satisfied with the government Sukuk index and how it differs statistically from its conventional counterpart. Then, we conduct our comparative approach in terms of volatility.
2. Overview of Sukuk Features
Sukuk plural word Sak represent the Islamic equivalent of a bond. According to the Accounting and Auditing Organisation for Islamic Financial Institutions Sukuk are defined as certificates of ownership in a pool of underlying assets, in which the certificates are of equal value AAOIFI. (2008). Sukuk represent rights to receive payments from a trade transaction, ownership of a particular asset, or a business venture instead of interest payment and does not guarantee the return of principal when redeemed at maturity if the enterprise suffers losses. In contrast, the returns to conventional bondholders represent the right to receive indebtedness for borrowed money.Hence, it can be argued that Sukuk are secure compared to conventional Bond due to the underlying assets involved in a Sukuk transaction Vishwanath et Sabahuddin. (2009).Sukuk provide also for investors the opportunity to invest in a new asset class, create an avenue for a more efficient and effective allocation of capital, and facilitate the channeling of surplus savings into ethical investments. Concurrently, the issuer can widen and diversify its investor base which could lead to a competitive and sometimes lower pricing KHFR. (2014).
3. Materials and Methods
3.1. Data
Our study is based on secondary data collected from Thomsons Reuters. TR ALL government Sukuk and Bond indices are used as a proxy to the Malaysian capital market. Our data spans the period of January 6, 2010, to March 20, 2017, implying a total of 1774 observations.
3.2. Research methods
Various statistical tests and GARCH family models were applied and analyzed using E-views 7. Volatility has been estimated on return (rt) and hence before going for all these tests, first the daily returns were calculated. Thomsons Reuters ALL government Sukuk and Bond return indices is calculated as a log of the first difference of daily closing price, which is as follows: Where
Where  is the logarithmic daily return on index for time t.
  is the closing price at time t, and
  is the corresponding price in the period at time t−1.
3.2.1. Test for Stationary
First of all, there is a need for testing whether the data are stationary or non-stationary and it is found out by the unit root test, which is conducted by Augmented Dickey-Fuller Test (ADF) Dickey and Fuller. (1979).
3.2.2. Test for Heteroscedasticity
One of the most important issues before applying the GARCH methodology is to first examine the residuals for the evidence of heteroscedasticity. To test the presence of heteroscedasticity in residual of the return series, Lagrange Multiplier (lm) test for Autoregressive conditional heteroscedasticity (ARCH) is used. It is sensible to compute the Engle (1982) test for arch effect to ensure that there is no arch effect.
3.2.3. Volatility Measurement Technique
Garch models represent the main methodologies that are applied in modelling the stock market volatility. The present study employed GARCH (1,1) for modelling conditional volatility and for modelling asymmetric volatility EGARCH (1,1) was applied. The following GARCH techniques are applied to capture the volatility in the return series.
3.2.3.1. The GARCH Model
The GARCH model (Bollerslev 1986), which allows the conditional variance to be dependent upon previous own lags, conform to the conditional variance equation in the simplest form as | (1) |
 | (2) |
Where  and
and  is the return of the asset at time t,Equation 1 represents the conditional which is modeled as an autoregressive process. The is selected such that the return of the residual are not serially correlated. Equation 2 refers to the conditional variance. The conditional variance depends on lagged squared errors and lagged conditional variances. To be well-defined GARCH model necessitates that the coefficient of the lagged squared errors and lagged conditional variances to be non-negative and their sum must be less than unity.
3.2.3.2. The Exponential GARCH Model
This model is based on the logarithmic expression of the conditional variability. The presence of leverage effect can be tested and this model enables to find out the best model, which capture the symmetries of the Malaysian government Sukuk market (Nelson 1991) and hence the following equation: 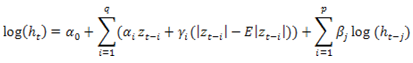 The conditional variance
  shows a sign effect, corresponding to
  and an amplitude effect measured by
  where
where  The process is stationary if the constraint β <1 is satisfied. In addition β represents the autoregressive term, α effect of a shock on the return and γ the asymmetry effect corresponds to the complementary impact.
4. Results and Discussion
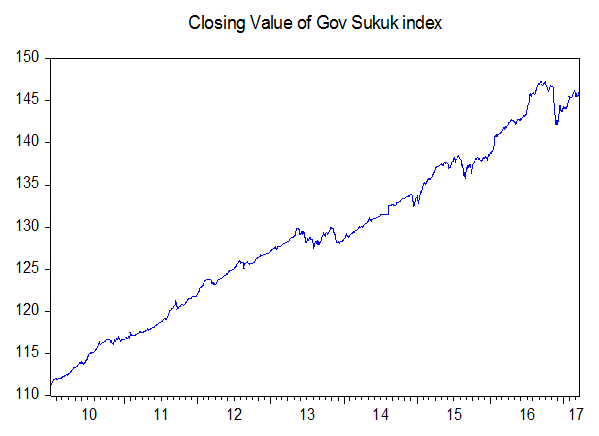 | Figure 1. Closing value of Gov Sukuk index |
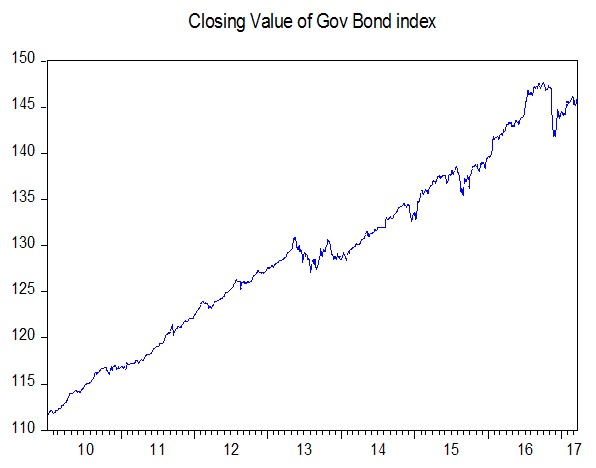 | Figure 2. Closing value of Gov Bond index |
By reference to the figure. 1, the prices of the government Sukuk and Bond index change in the same direction. Thus, for the period, for example, from 2010 to 2013, there is an upward trend of both indices, while for the period 2013 to 2014 there is a downward trend.The government Sukuk and Bond daily return indices appear stationary around a constant. We can see that fluctuations take both negative and positive values around the mean. However, the return of the government Sukuk and Bond indices exhibits negatives peaks in 2013 and 2015.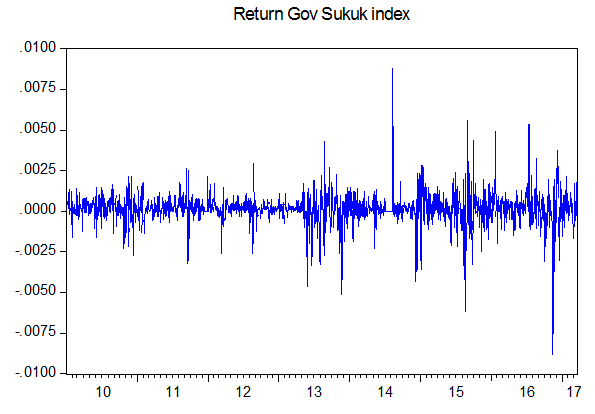 | Figure 3. Volatility Clustering of Gov Sukuk |
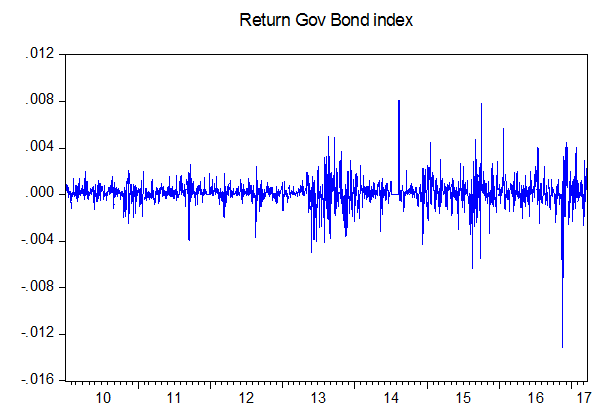 | Figure 4. Volatility Clustering of Gov Bond |
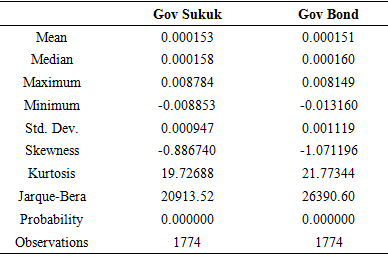
Figures 3 and 4 show also volatility clustering of return series of the government Sukuk and Bond market for the study period from 06 January 2010 to 20 march 2017.From the figures, we observe that the period of low volatility tends to be followed by a period of low volatility for a prolonged period and the period of high volatility is followed by a period of high volatility for a prolonged period, which means the volatility is clustering and the return of both government Sukuk and Bond indices vary around the constant mean but the variance is changing with time.The following table presents descriptive statistics of both the government Sukuk and Bond daily return indexes.Table 1. Descriptive Statistics of Daily Return
 |
| |
|
Descriptive statistics on the return of the government Sukuk and Bond indices are summarized in the table. The mean of the returns of government Sukuk index is positive, indicating the fact that price has increased over the period. We can see from the table that there is not a remarkable difference between the return of government Sukuk and Bond indices. They obtained respectively 0.0153% and 0.0151%.On the other hand, the government Sukuk index is less volatile (Std.dev= 0.0947%) than the government Bond indices (Std Dev = 0.119%). This means that the government bond index fluctuated more than the government Sukuk index.The descriptive statistics of the indices show also that the returns are negatively skewed, indicating that there is a high probability of earning returns which is higher than the mean. The kurtosis of both government Sukuk and Bond indices is higher to 3, which implies that the return series is fat-tailed and does not follow a normal distribution and is further confirmed by Jarque-Bera test statistics, which is significant at 1% level and hence the null hypothesis of normality is rejected.Table 2. Result of Unit Root Test
 |
| |
|
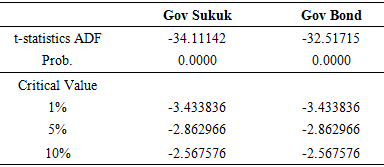
Table 2: shows the presence of unit root in the series tested using ADF tests. The p-values of ADF are <0.05, which leads to conclude that the data of the time series for the entire study period is stationary. The ADF test statistic reported in the table rejects the hypothesis at 1% level with the critical value of –3.433836 for the test of a unit root in the return series. Hence, the results of the test confirm that the series of government Sukuk and Bond indices are stationary.Table 3. ARCH LM Test
 |
| |
|
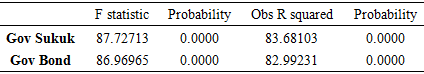
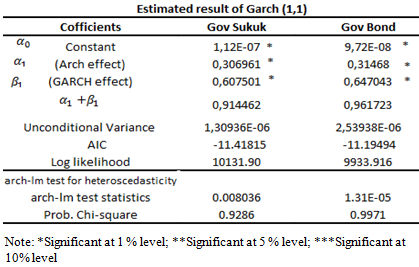
The arch-lm test is applied to find out the presence of the arch effect in the residuals of the return series. From table 3, it is inferred that the arch-lm test statistics is highly significant.Since the probability of Obs R squared = 0.00 < 0.05. So we reject the null hypothesis of ‘no arch effect’ at 1% level, which confirms the presence of arch effects in the residuals of time series models in the returns and hence the results warrant for the estimation of GARCH family models. After volatility clustering is confirmed with return series and stationarity using ADF test, heteroscedasticity effect using arch-lm test, now, we are going to estimate conditional volatility parameters of GARCH (1.1) and EGARCH (1.1) of return series of the Malaysian government Sukuk and bond market.We will ensure the non-homoscedastic or heteroscedasticity in the residual presented in the model by testing it with the ARCH LM Test.The result of the GARCH (1,1) model is shown in the table, which reveals the parameter of GARCH is statistically significant. In other words, the coefficients of constant (ω), ARCH term (α), GARCH term (β) are highly significant at 1% level. Table 4. Conditional volatility parameters estimated with a GARCH (1.1) Model
 |
| |
|
The first term corresponds to the minimum variance threshold below which the conditional variance does not go down. The results corresponding to GARCH (1.1), indicate that the constant parameter is significant at the 5% level. For the government Sukuk index, it’s slightly higher compared to the government Bond index.Is a sum of squared residuals, which reflects the impact of shocks on volatility. When a shock occurs at time t, the return’s value is very different from its mean and so the residue is very large. Also, we observe a statistically significant effect of past volatility on current volatility and of past squared innovations on current volatility at the 5% significance level for both indices. Moreover, its value is slightly lower for the government Sukuk index.The last term (matches the sum of recent variances which reflect the volatility persistence. We observe a statistically significant effect of past volatility on current volatility for both government Sukuk and Bond indices. Also; the result of government Sukuk index is higher than the government Bond index. It reveals that the volatility is less persistent for the government Sukuk to its conventional counterpart.In the conditional variance equation, the estimated β coefficient is considerably greater than α coefficient which resembles that the market for both government Sukuk and government Bond indices has a memory longer than one period and that volatility is more sensitive to its lagged values than it is to new surprises in the market values.The GARCH model result reveals also that the volatility is persistent for the government Sukuk and Bond market. However, the shock persistence to many future periods of Government Sukuk index is slightly lower than the government Bond index. Because the sum of the parameters α and β are respectively 0,914462 and 0,961723.Finally, the unconditional volatility of government Sukuk index is slightly lower than the government Bond index. Here, we note that the volatility of government Sukuk index remains significant in the long run.The arch-lm test is applied on residuals and shows that the test statistics do not exhibit an additional arch effect indicating that the variance equation is well specified.Table 5. Estimated result of EGARCH H (1.1) Model
 |
| |
|
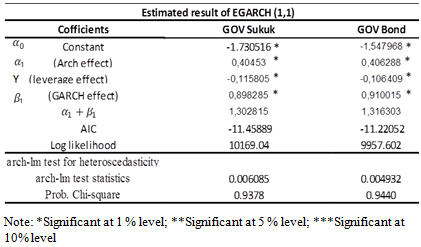
To capture the asymmetries in the return series, the asymmetrical EGARCH (1, 1) model is used to estimate the returns of the government Sukuk and Bond indices and the result is presented in table 5. The table reveals that ARCH (α) and GARCH coefficient (β) are greater than one, indicating that conditional variance is explosive; the estimated coefficients are statistically significant at 1%level. γ, the leverage coefficient, is negative and is statistically significant at 1% level, exhibiting the leverage effect in return during the study period.The analysis shows that there is a negative correlation between past return and future return (leverage effect); hence, EGARCH (1, 1) model supports for the presence of leverage effect on the government Sukuk and Bond return indices. The asymmetric effect captured by the parameter (γ) in EGARCH model is negative and statistically significant at 1% level providing the presence of leverage effect for both government Sukuk and Bond indices, which shows that positive shocks have less effect on the conditional variance when compared to the negative shocks.Finally, the ARCH-LM test statistics reveals that the null hypothesis of no heteroscedasticity in the residuals is accepted.
5. Conclusions
In the wake of the recent global financial crisis, Islamic finance attempts to provide financial products and instruments that are consistent with certain principles such as social responsibility, ethical and moral values.Given the prevalent interest in such products, we have investigated the statistical properties of the government Sukuk index and its conventional counterpart of the malaysian capital market.The results show that government Sukuk daily returns index captures most of the stylized facts observed in financial markets.We showed that the daily returns of government Sukuk are asymmetric and leptokurtic, unlike a Gaussian distribution. Leptokurticity reflect that the distribution tails are relatively thicker than those of a Gaussian distribution.We also proved presence of heteroscedasticity effect for both government sukuk and bond indexes. We modeled the conditional variance for both Sukuk and conventional Bond indexes using GARCH model. The results of modeling and estimating parameters showed that there is significant persistence volatility for both indexes, and we noticed that government Sukuk index is slightly less volatile on the long run than its counterpart.The study also provides evidence for the existence of the asymmetric effect (leverage) captured by the parameter of EGARCH (1, 1) models that shows that negative shocks have significant effect on conditional variance (volatility) for both the government Sukuk and Bond indices. Which means that bad news in the government sukuk and bond market of Malaysia had better impact on volatility than good news.This result indicate that in a post crisis period investors behave rationally in response to information in the market. It indicate also that Sukuk market moves to more efficient condition.In conclusion, it can be assumed to a large extent that the government Sukuk volatility behavior is similar to that of government Bond in a post crisis period. Our findings are relevant for several institutional investors, regulatory authorities, academic community, and particularly for those who wish to make alignment between their investments and religious ðical beliefs.
References
| [1] | International Islamic Financial Market Report. (2018). |
| [2] | Tahmoures, A., Afshar. (2013). «Compare and Contrast Sukuk (Islamic Bonds) with Conventional Bonds, Are they Compatible? ». The Journal of Global Business Management 9(1): 44-52. |
| [3] | S. Rusgianto and N. Ahmad, N, “Volatility Behavior of Sukuk Market: An Empirical Analysis of the Dow Jones Citigroup Sukuk Index”, Middle East Journal of Scientific Research, vol. 13, pp. 93-97, 2013. |
| [4] | Cont, R. (2001), “Empirical properties of asset returns: stylized facts and statistical issues”, Quantitative Finance Volume 1 (2001) 223–236. |
| [5] | Swell, M. (2011), “Characterization of Financial Time Series”, UCL Department of Computer Science, Research, Note, RN/11/01. |
| [6] | AAOIFI. (2008). «AAOIFI Shari’ah Resolutions: Issues On Sukuk». Accounting and Auditing Organization for Islamic Financial Institutions. |
| [7] | Vishwanath and Sabahuddin Azmi. (2009). “An Overview of Islamic Sukuk Bonds” The Journal of Structured Finance 14 (4) 58-67. |
| [8] | KHFR (2014). Global Sukuk Report 1Q14. Kuwait Finance House Research: Kuwait. |
| [9] | Dickey, D.A., and W.A. Fuller. 1979. ‘Distribution of the Estimators for Autoregressive Time Series with a Unit Root.’ Journal of American Sta-tistical Association 74 (366): 427–31. |
| [10] | Engle, R. F. 1982. ‘Autoregressive Conditional Heteroskedasticity with Esti-mates of the Variance of uk Inflation.’ Econometrica 50 (4): 987–1007. |
| [11] | Bollerslev, T. (1986) “Generalised Autoregressive Conditional Heteroscedasticity”, Journal of Economic Surveys, 7, pp. 305-62. |
| [12] | Su, C., 2010. Application of EGARCH model to estimate financial volatility of daily returns: the empirical case of China. Unpublished Master’s Thesis, University of Gothenburg, Sweden. |
| [13] | Bollerslev, T, Engle, R.F., and Nelson, D.B. (1994). “ARCH Models”, Handbook of Econometrics, Vol 2959-3038. |
| [14] | Taylor, S. (1986), “Modeling Financial Time Series”, Wiley and Sons, New York, NY, 1986. |
| [15] | Daniel B Nelson, (1991), Conditional Heteroskedasticity in Asset Returns: A New Approach, Econometrica, 59, (2), 347-70. |

 Abstract
 Reference
 Full-Text PDF
 Full-text HTML