Pailin Rojcheevaphan
School of Economics, Shanghai University, Shanghai, China (Pailin Rojcheevaphan, Thailand)
Correspondence to: Pailin Rojcheevaphan, School of Economics, Shanghai University, Shanghai, China (Pailin Rojcheevaphan, Thailand).
| Email: |  |
Copyright © 2020 The Author(s). Published by Scientific & Academic Publishing.
This work is licensed under the Creative Commons Attribution International License (CC BY).
http://creativecommons.org/licenses/by/4.0/

Abstract
Off late in the tea trade industry, tea markets are becoming largely competitive globally. Besides China, other tea export countries as well started to export tea in larger amount to Thailand. This competition over exporting tea leads our interest in understanding the factors of competitiveness and consumer preferences to help support marketing strategies in the tea industry. This research will answer research question. what are the factors influencing the competitiveness of tea imported from China in the Thailand market? The purpose is to identify the opportunities of tea business from China to Thailand. The study also aims to explore the international tea market in China's perspective as the exporter. The gathering data would be analysed by the revealed comparative advantage (RCA) index. The competitor of tea exportation is China, Japan, Sri Lanka, and Indonesia. Considering the RCA index of tea exportation from China to Thailand is an average of 7.43, indicated that China still has a high potential in tea export competitiveness in the Thai market.
Keywords:
RCA, Competitiveness, Regression Analysis, the Tea market
Cite this paper: Pailin Rojcheevaphan, Competitiveness of Chinese Tea in Thai Market, American Journal of Economics, Vol. 10 No. 2, 2020, pp. 109-114. doi: 10.5923/j.economics.20201002.06.
1. Introduction
Since tea trading has significantly affected countries' economies, there are many competitors in the international tea market. These countries are China, India, Sri Lanka, Japan. These countries have their unique tea characteristic of tea production, and one of the countries that consume the tea in Thailand. Tea trading is expanding in Thailand because of many reasons. One primary reason is a healthy trend. Tea is acknowledged in Thailand as a healthy beverage for people of all ages. Furthermore, the coffee shop in Thailand is increasing. Most coffee shops always provide tea as an alternative option for clients. In recent years, Thailand imports more tea from other competitive countries than China. Other competitive tea export countries such as India, Indonesia, Japan, and Sri Lanka have started to export tea in a larger amount to Thailand. The number from COMTRADE shows that from 2007 until 2017, tea imported from China is no longer the number one but those countries. However, China is recognized as an essential tea exported country. Before 2007, China was the only number one tea import in the Thai market. In 2007, India became the first. In 2010, Japan had the most considerable trade value of imported tea in Thailand. In 2012, Sri Lanka became the highest value, followed by Japan, while China dropped to the third. Tea international market is essential for nations’ economic. Understanding the exportation mechanism could support marketing strategies in the tea industry, and this study developed to serve this purpose. This thesis scope to study tea market from Thailand perspective and would explore the tea importation to Thailand from major countries, as well including China.
2. Competitiveness Analysis
This paper aims to explore the information about the international tea market in China's perspective as the exporter. The data about the tea exportation value were gathered from China to Thailand. The data of tea exportation value would be gathered from other competitors, which are Japan, Sri Lanka, and Indonesia. The gathering data would be analysed by the revealed comparative advantage (RCA) index. This RCA index is considered as the competitive variable, which suggests the potential of tea exportation from interested countries toward Thailand. The RCA index then would be brought to do a regression analysis to find the relationship with macroeconomic factors. The relationship analysis would suggest whether concerned factors affect to tea exportation of China. This chapter would collect data from secondary online sources, online databases, and previous research papers.
2.1. Revealed Comparative Advantage Index (RCA) Calculation
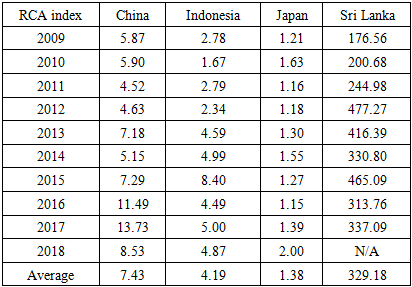
Data collected from the online database would be collected and calculate to the RCA index to compare the competitiveness analysis between China, Sri Lanka, Japan, and Indonesia. The RCA index would be demonstrated in the table below.Table 1. RCA index result compare between the competitors
 |
| |
|
From the table above, the RCA index shows that Sri Lanka has a competitive advantage in tea exportation in Thailand compared to other competitor countries. The data show that Sri Lanka exports tea to Thailand less than other countries. The RCA index is showed relatively high because the total product exportation from Sri Lanka to Thailand is small compare to tea exported value. Thus, the RCA index from Sri Lanka to Thailand is high. China is the other competitive range of tea exportation to Thailand. Consider the tea importation valued in Thailand, which mention above. RCA index shows that Indonesia is the third range competitive of tea exportation to Thailand. Because the RCA index is calculated from two factors, these factors are tea exported value and total product exported value. These factors would collect from two stakeholders, which are the affected countries and the whole world. The affected countries in this study are China, Indonesia, Japan, and Sri Lanka. The RCA index of tea exportation from Sri Lanka to Thailand is shown that Sri Lanka has a high potential for tea exportation compares to other competitors. Another country that the author would like to explain as an example is China. Thailand imports tea from China as the second-highest source. Thailand also imports other products from China more than Sri Lanka. The ratio of tea exported, and the total product exported would be smaller compared to Sri Lanka. Consider the RCA index of tea exportation from China to Thailand between 2009-2018. The RCA index is average about 7.43. The trends of the RCA index increase 2011-2017. The tea exported advantage of China is decease between 2017 and 2018.
2.2. Constant Market Share Model (CMS) Calculation
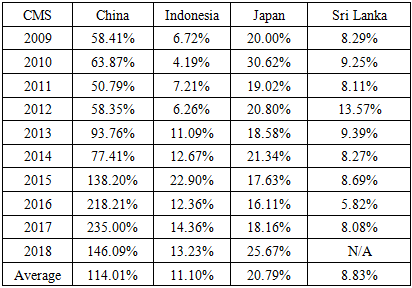
The data would collect from the secondary online database to calculate the share market. The high share market could be interpreted as high competitiveness. The calculated data are shown in the table below. The result suggests that the tea exported from China has shared the tea market in Thailand more than 50 percent. The market shares of tea from China in the Thai market are increased every year between 2009-2018. The second of the market share of tea in the Thai market is tea from Japan. Table 2. The CMS result and tea competitors
 |
| |
|
2.3. Influent Factors which Affect Tea Exportation
There are three objectives in this study. The first objective is to identify the factors that influence the Thai customer about consuming tea. The second objective is to identify the factors that Thailand import tea. The third objective is to identify opportunities in the tea market for both Thailand and China. This part of the chapter would like to clarify the third objective of the study. This thesis interest in five variables that could affect the tea exportation of China to the Thai market. (Millath & Thowseaf, 2016) researched the factors which affect export performance. The study found that the significant factors that affect the exportation. These factors are economic growth, transportation, and product demand. The economic growth could be measured as the various variable. GDP is one of the indicators that reflect economic growth. The population is also one of the indicators that indicate economic expansion. Logistic costs indicated as transportation. The econometric would help us to understand the relationship between the factors. The researcher would collect and analyse secondary data. The methodology would be the Ordinary Least Square (OLS.). GDP is usually considered as one of the crucial indicators that indicate the health of one country’s economy and the advance market move. Increases in GDP reflect the economic growth of a nation. Many previous studies researches about the relationship between economic growth and export performance. The economic growth usually is measured as GDP. The exported performance usually be measured as RCA index. These previous studies suggested that GDP has a significant relationship with exported performance.There are many theories and evidence that suggest that the size of the population could reflect exportation. The previous study examined the characteristic of countries affect the importation and exportation in 2000. The study suggested that the larger population can also be interpreted as a bigger market for importation and exportation. Many studies suggest that the currency exchange rate is one of the significant influent variables to exported performance. There is a study that studies the impact of the exchange rate toward the United Kingdom exported performance. As a result, the exchange rate has a significant impact on exported performance; suggests that the study has consorted with a study in Brazil. The currency exchange rate, which has a significant relationship with exported performance. One of the main independent variables related to exported performance is logistic cost. There are previous studies suggest this fact. The studies suggest that the logistic cost or transportation cost would affect the exportation. The (Fliehr, & Zimmer, & Smith, 2019) studied the impact of the transported cost toward Brazilian exportation. The study found that the transported cost affects exported performance through production cost and market price. The study result consort with study in African in 2019, the study found that logistic cost significantly affects exportation. Logistic infrastructure improvement would improve exported performance.
2.3.1. Gross Domestic Product (GDP)
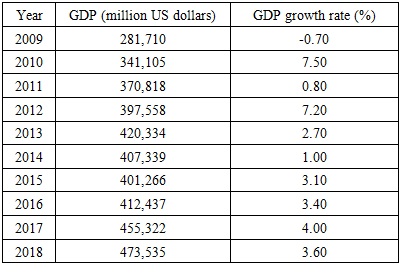
The power of purchasing in a country can be described by the market value of goods and services which are produced in one country yearly. (Kenton, 2018). The hypothesis of this study suggests GDP would have a positive relationship with RCA, so as GDP increases, the exportation should also be increased. The GDP data of Thailand are collected from secondary data, which shows data between 2009-2018.Table 3. Thai GDP between 2009-2018 (Data Source: World Domestic website)
 |
| |
|
From the table which demonstrates the GDP of Thailand between 2009-2018, the information shows that the average of GDP in the last ten years long is 396,142 million US dollars. The data also demonstrate that the GDP of Thailand is moving above curve since 2009. The growth rate of GDP always shows in a positive number since 2009. This incident means that the GDP of Thailand is continuously growing. The highest growth rate of GDP is in 2012.
2.3.2. Population
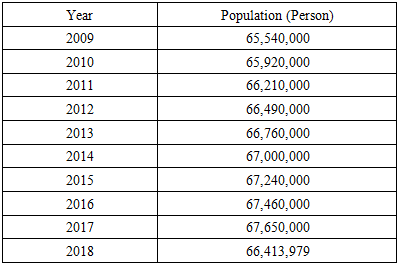
There are many theories and evidence that suggest that the size of the population could reflect exportation. Some theory suggests that population density could affect the economic scale and affect the comparative advantage of the exportation. Microeconomics theory suggests that the population density could affect the market demand, which means that the larger population would consume more of everyday goods. Population density is the crucial determinant of demand. Many studies suggest that the population size would relate to product demand. The product demand would relate to the power of consumption. On the contrary, most of the studies also describe that the population would be the moderate variable, which could be combined with the final consumption value, which indicates that the population could affect the consumption value by combining with other independent variables. The population variable itself sometime could not show the relation with the final buying value in the market.Table 4. Thai population size between 2009-2018 (Data Source: World Domestic website)
 |
| |
|
From the online domestic database, the data show that there are approximately 66,668,398 Thai citizens in Thailand. The average data I calculated from gathered data between 2009-2018. The trend of the Thai population shows that Thailand always has a similar number of Thai citizens. The trend shows that over ten years, Thailand has a low increased rate of the Thai population. The increased rate of Thai citizen is less than one percent.
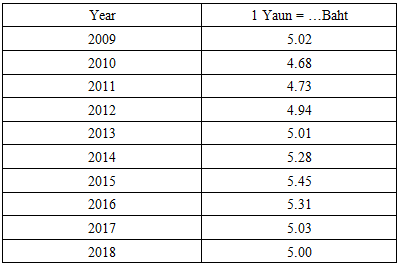
2.3.3. Currency Exchange Rate
Table 5. Currency exchange rate data between 2009-2018 (Data Source: Bank of Thailand website)
 |
| |
|
From the table, the author gathers data on the exchange rate for ten years between 2009-2018. The data is collected from the secondary online database. The database is the official National Bank of Thailand (BOT). The data shows that over ten years, the currency exchange rate is approximately similar. The exchange rate between Yuan and Baht is a small fluctuation.
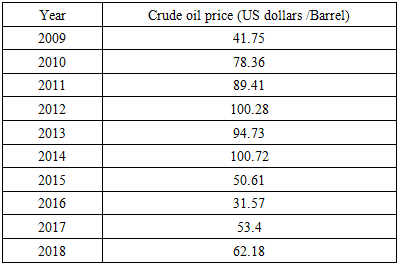
2.3.4. Logistic Cost (Fuel’s Price)
Oil price is one of the most significant factors in exportation because oil is the cost of transportation. The increasing or decreasing oil cost would directly affect the cost of the transport of the product and affect the product price. China is one of the countries that import oil from the international market. Because the oil price would be the cost dimension, the hypothesis suggests that the RCA index would have a negative relationship with the oil’ price variable.Table 6. Fuel's price data between 2009-2018 (Data Source: International Energy Agency website)
 |
| |
|
In this study, the author collects the crude oil price from the international secondary database. The researcher would like to use the crude oil price to represent the cost of logistics. The crude oil price of over ten years is very fluctuation. The average crude oil price between 2009-2018 is 70.30 US dollars per Barrel.
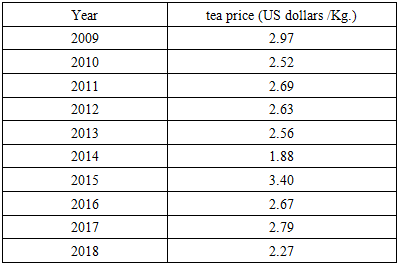
2.3.5. Tea’s Price
Some studies suggested the ideas of product price relationship with the trade performance. This research proposes a similar result, which suggests that the product price could relate to export performance.Table 7. Tea's price data between 2009-2018 (Data Source: International Tea Committee website)
 |
| |
|
The table contains the gathered data about tea prices in the international market between 2009-2018. The average tea’s price over this ten year is 2.64 US dollars per kilogram. This data is collected from the international tea committee. The tea’s price has fluctuated. The highest price appeared in 2015, the tea’s price is 3.40 US dollars per kilogram. The lowest tea price was 1.88 US dollars per kilogram in 2014. This study would use the regression analysis to find the relationship between the independent variables, which are GDP of Thailand, the population of Thailand, currency exchange rate, crude oil price, and tea’s price.
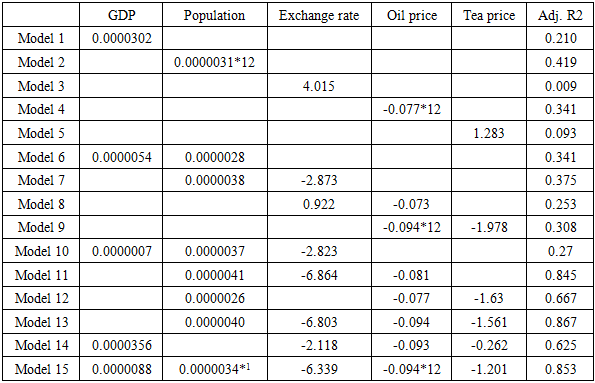
2.4. Regression Analysis
Linear regression analysis is one of the statistical methods. The method is usually used to analyse two purposes. The first purpose is answering whether the independent variables are a good predictor for the dependent variable. The second purpose is finding if the predictor could explain the outcome significantly. Theoretically, Linear regression analysis could explain the relationship between the dependent and independent variables Linear regression analysis would provide equation, which could help researchers understand the relationship between the variables.The form of the regression equation is " y = C+b*x”Where y = dependent variable C= Constant value b = Regression coefficient, x= Score on the independent variable The prediction of the resulted equation- when X is increasing for 1 score, they will change is y factor would also increase the ratio. Ordinary least squares are one of the approaches of the linear regression analysis.Table 8. Regression Analysis result (Data source: Use regression analysis method, calculated by the author)
 |
| |
|
3. Conclusions
This study using OLS to prove the relationship between the independent variable and the dependent variable. Model 1-5 is the model that analyses the relationship between one independent variable and the RCA index as the dependent variable. The result shows that the Thai population and oil price are the variables that could explain the relationship with the tea exportation potential the most. The researcher considers adjusting R2 to explain this statement. R2 is the value that results from linear regression analysis, which could suggest the coverage effect of the independent variables. The higher R2 could suggest that the model could explain the dependent variable. From the table, the researcher found that the currency exchange rate is the most effective independent factor that influences the RCA index of tea exportation from China to Thailand. From model 15, which uses all five independent variables in the analysis, the researcher finds that the R2 equals 0.853. This amount of R2 means that model 15 could explain the RCA index of China tea exportation around 85 percent. The model 15 is the perfect equation which could be used to identify the relationship in this study. The equation that could identify factors that affect the RCA index of tea exportation of China is the RCA index. The result of the regression analysis would be shown below:RCA = -180.97 + (0.000008846*GDP) + (0.0000034*Population) + (-6.339*Exchange rate) + (-0.094*Oil price) + (-1.201*tea price).The equation suggests that GDP and population variables have a positive relationship with the RCA index. The statement means that if the GDP of Thailand increase, the RCA index of China’s tea exportation would also increase. The incident which results from this study is similar to the previous research that suggests the same mechanism. Besides, if the population of Thailand is increasing, the RCA index of China tea exportation would also increase. On the other hand, the currency exchange rate, oil price, and tea price result to have a negative relationship with RCA. When the currency exchange rate increased, it means the goods would be more expensive and would reduce demand. The result suggests the same mechanism considers the minus sign in the equation. Furthermore, oil prices and tea prices have a negative relationship with the RCA index through the same mechanisms. When considering the significance of the relationship between the independent and dependent variables, which the result suggests that the population and oil price have a significant effect on RCA on tea exportation from China to Thailand. The result of regression analysis also reveals that when considering a different model with different independent variable combinations, the significant effect to the RCA index also is differently affected. For example, when considering only the relationship between oil price and the RCA index (Model 4), the result shows a significant relationship between variables. When considering the effect of the currency exchange rate and oil price on the RCA index (Model 8), the result shows an insignificant relationship between the variables.
Note
1. * mean that the relationship between the variables is significant (p-value < 0.05).
References
| [1] | Barro, R. J. (1996). Determinants of Economic Growth: A Cross-Country Empirical Study. NBER Working Paper. |
| [2] | Bendjilali Boualem (2000) “An Intra-Trade Econometric Model for OIC member countries: A cross-country analysis”. Islamic Development Bank Islamic Research and Training Institute Research Paper, No: 55. |
| [3] | Fliehr, & Zimmer, & Smith,. (2019). Impacts of Transportation and Logistics on Brazilian Soybean Prices and Exports. Transportation Journal. 58. 65. 10.5325/transportationj.58.1.0065. |
| [4] | Greenaway, David & Kneller, Richard & Zhang, Xufei. (2008). Exchange Rates, Exports and FDI: A Microeconometric Analysis. SSRN Electronic Journal. 10.2139/ssrn.1104612. |
| [5] | Millath, A., & Thowseaf, S. (2016). Factors influencing export - a conceptual analysis. International Journal of Management, 7(2), 150–158. |
| [6] | Moschos, D., Export Expansion, Growth and the Level of Economic Development: An Empirical Analysis, Journal of Development Economics, Vol.30, issue 1, 1989, pp. 93–102; Tyler, W., Growth and Export Expansion in Developing Countries: Some Empirical Evidence, Journal of Development Economics, vol. 9, issue 1, 1981, pp. 121–30; Feder, G., On Exports and Economic Growth, Journal of Development Economics, Vol. 12, issue 1-2, 1983, pp. 59–73. |
| [7] | Nuroğlu, Elif. (2010). The Impact of Population on Bilateral Trade Flows in the case of OIC. |
| [8] | Ronit, M., & Divya, P. (2014). The relationship between the growth of exports and growth of gross domestic product of India. International Journal of Business and Economics Research, 3(3), 135–139. |
| [9] | Takele, Tesfaye & Buvik, Arnt. (2019). The role of national trade logistics in the export trade of African countries. Journal of Transport and Supply Chain Management. 13. 10.4102/jtscm.v13i0.464. |
| [10] | Veríssimo, Michele & Xavier, Clésio. (2013). Exchange rate, exports and growth: an investigation on the hypothesis of Dutch disease in Brazil. Revista de Economia Política. 33. 82-101. 10.1590/S0101-31572013000100005. |

 Abstract
 Reference
 Full-Text PDF
 Full-text HTML