-
Paper Information
- Next Paper
- Paper Submission
-
Journal Information
- About This Journal
- Editorial Board
- Current Issue
- Archive
- Author Guidelines
- Contact Us
American Journal of Economics
p-ISSN: 2166-4951 e-ISSN: 2166-496X
2020; 10(2): 53-61
doi:10.5923/j.economics.20201002.01

Budgetary Policy and Economic Growth in the Republic of Congo
 Abstract
 Reference
 Full-Text PDF
 Full-text HTML
Ossou Ndzila Fred Nelson1, Moussana Philauguy Vianney2
1Ph.D. Student of Finance at Shanghai University
2Master Student of Economics at Marien Ngouabi University
Correspondence to: Ossou Ndzila Fred Nelson, Ph.D. Student of Finance at Shanghai University.
| Email: |  |
Copyright © 2020 The Author(s). Published by Scientific & Academic Publishing.
This work is licensed under the Creative Commons Attribution International License (CC BY).
http://creativecommons.org/licenses/by/4.0/

The purpose of this work is in the field of public finance through an exploration of statistical data spreading from 2004 to 2018 the methodological approach is based on an economic model. We note the existence of a positive relationship between the instruments of fiscal policy and economic growth as measured by gross domestic product (GDP). It is oil revenues, non-oil revenues, Operating expenses, Public expenditure, and private investment that are significant and positively impact economic growth through nominal GDP. This requires attention to be focused on the fiscal policy of the oil sector and the strengthening of the non-oil sector so that fiscal policy is efficient and allows the accumulation of factors of production.
Keywords: Budgetary policy, Economic growth
Cite this paper: Ossou Ndzila Fred Nelson, Moussana Philauguy Vianney, Budgetary Policy and Economic Growth in the Republic of Congo, American Journal of Economics, Vol. 10 No. 2, 2020, pp. 53-61. doi: 10.5923/j.economics.20201002.01.
Article Outline
1. Introduction
1.1. Background
- In the current context of globalization, where each state aspires to economic growth and development, it is imperative that everyone optimally manipulate the instruments of economic policy. Fiscal policy is, along with monetary policy, one of the main economic levers of economic policy. However, within the Central African Economic and Monetary Community (CEMAC) zone, monetary policy is led by the monetary authorities of the Bank of Central African States (BEAC), it escapes the discretionary power of the national state and generally aims at price stability. The other objectives of economic policy, such as growth, are fiscal policy.The only tool available to the state is the fiscal policy which must be well managed with control so that the effects of public spending are effective on economic activity. The Fiscal policy consists of using certain budgetary instruments (public expenditure, government revenue) to influence the economic situation. It constitutes the main mode of the intervention of the public authorities for the fulfillment of the functions of resource allocation, macroeconomic stabilization and, income redistribution.The State's fiscal policy continues to be in line with the objectives of the Poverty Reduction Strategy Paper (PRSP) through improving the delivery of public goods and maintaining macroeconomic stability and the sustainability of the debt. The government has continued to implement its ambitious investment program aimed at reducing the infrastructure deficit in support of the national strategy for economic diversification. For example, investment spending financed by 70% of domestic resources increased by 65% in 2011 to 12.9% of GDP. However, the provision of public services is still limited by the low budget execution rate, notably that of investment expenditure which did not exceed 75% over the period 2008-2010, and the lack of monitoring of expenditure related to poverty reduction. Between 2011 and 2014, Congo's economic performance was well below the growth rate needed to reach the 2025 development goals. Economic growth was 4% n average between 2011 and 2014, well below the 8.5% forecast in the development plan, this weak growth is explained by the poor results of the oil sector which fell by 5.4% over the same period. The good performance of the non-extractive sectors is due to the combined effect of public investment in infrastructure (9.7%) and activity in the manufacturing industries and in the electricity, gas and telecommunications sectors ( World Bank, 2016). According to the IMF report (2015), the situation of the Congolese economy shows that the economy has continued to show solid growth driven by a rebound in oil production and the good performance of the non-oil economy in 2014. The Congolese authorities recognize the consequences of the negative shock of oil prices. Faced with declining oil revenues, they have taken steps to preserve macroeconomic stability.The repatriation of deposits held abroad helped to finance the budget deficit in 2014 and strengthen international reserves.In the Franc zone, of which Congo is a member, the question of the effectiveness of fiscal policy as a tool that regulates economic activity is often raised or the relevance of defending economic growth is questioned. To this end, the only fundamental question is how the Republic of Congo can achieve sustained economic growth through fiscal policy.
1.2. Justification
- The heavy dependence of the Congolese economy on the oil sector pushes the government to think carefully to guide fiscal policy in order to maintain sustainable economic growth. Sustainable economic growth is synonymous with a strong economy and demonstrates an effective fiscal policy that can feed into macroeconomic aggregates. The evolution of economic cycles does not allow the stability of economic growth, so public finances tend to moderate the fluctuations of activity by the games of automatic stabilizers through public revenue and public expenditures.The interest of this study lies in the fact that not only is it a response to economic policy issues, but it is also a response to economic policy issues but also adds value to fiscal policy. This includes highlighting the influence of fiscal policy variables on economic growth. It is timely because it works to empirically determine the real impact of fiscal policy on economic growth in the context of current economies. The analysis of the ability of fiscal policy to support economic growth in the Congo is the particularity of this study.
1.3. Problematic
- One of the great ideas of economic development is to think that disposing of natural resources is a chance for a country or region. These constitute a factor of the creation of wealth and therefore of growth. Economic currents abound with guiding principles on how to capture and use natural resource revenues. Countries have historically used a variety of tax regimes, including royalties and fees, to obtain their share of these revenues in order to finance the public expenditure programs included in their budget declarations. However, given the alternation of expansion and recession associated with commodity price fluctuations, most countries exceeded their budgets during the boom years and were forced to close their budget deficits during the phases of the low economy. In practice, governments are limited by resources while public spending is unlimited. They must adjust public spending to protect the economy from unanticipated changes in the price and volume of exports and oil production. In response, some governments have put in place fiscal management measures to improve resource allocation and smooth public spending over time by using stabilization funds and investment rules as part of a comprehensive national income management process. Governments of oil-exporting countries are increasingly using sovereign wealth funds, including funds for future generations, to fulfill this goal and promote general commodity-based sustainable development.The question of fiscal policy and economic growth is important in the Republic of Congo. In general terms, what is the impact of fiscal policy in Congo? And specifically what is the comparative evolution of the different instruments of fiscal policy? What are the fiscal policy instruments that relate to economic growth? In this study, the fiscal policy instruments that will be used are expenditures and government revenues, external debt has been taken into account to show its influence over the study period.§ General objectivesThis study will present the relationship between fiscal policy and economic growth in Congo§ Specific objectivesThe specific objectives of our study are:- To show the evolution of the different instruments of budgetary policy- Interpret the link between the instruments of fiscal policy and the economic growth measured by the GDP.§ HypothesisIn view of the questions asked, we can answer with the following hypotheses:- H1: the instruments of fiscal policy do not have the same evolution and affect economic growth differently.- H2: fiscal policy and economic growth are positively related through government revenue and GDP.
2. Empirical Review
- The economic literature does not always agree on empirical results, on the relationship between fiscal policy and economic growth through its instruments, public spending and, government revenues. The empirical results vary from one country to another. We will try in this study to present some empirical results.
2.1. The Positive Effects of the Fiscal Policy Relationship and Economic Growth
- The positive effects of fiscal policy were found by the following studies:Yaya [1] applies the cointegration and causality tests on the annual data covering the period from 1960 to 2006 in the Ivory Coast, his results reveal the existence of the long-term relationship between the tax variables and the GDP, the consumption and investment. Taxation does not hinder long-term growth and tax revenues are positively related to GDP and its components. However, some types of taxes reduce economic growth.Through the causality tests, Chimobi [2] makes a study with annual data from 1970 to 2005, it appears that in the long term there is no relationship between public spending on health and education and income. Nigeria, but the author stresses that public spending plays a leading role in economic growth.Economist Ouattara's study [3] on the relationship between public spending and growth applied to the West African Monetary and Economic Union (WAEMU) countries finds a two-way causal relationship. Granger tests have shown that economic growth and public spending influence each other.The effect of fiscal policy on economic growth was shown by Kone [4] in an article published at the Central Bank of West African States (BCDEAO). This study analyzes the relative effectiveness of monetary and fiscal policies through their actions on the economic activity of WAEMU member countries. In real terms and in nominal terms in the short and long term using an error correction model (ERM). It leads to the result that monetary and fiscal policies would positively influence nominal and real GDP.Using an error-correction model, Morley and Perdikis [5], working on the case of the Egyptian economy, conclude that there is a long-term positive effect of total government expenditure on growth particularly after the tax reforms of 1974 and 1991. In the short term, however, no significant effect could be identified.
2.2. The Negative Effects of Fiscal Policy
- Other works, on the other hand, show the negative effects of fiscal policy on economic growth.Focusing on WAEMU countries, Nubukpo [6] assesses the impact of public spending on the growth of the WAEMU economies from 1965 to 2000. He considers a model where the real GDP is explained by the rate Gross enrollment in secondary education, the growth rate of the labor force, the share of public expenditure in the GDP, the terms of trade index, real private investment and inflation. Using an error-correction model, it shows that public spending has no significant impact on economic growth in the majority of the economies of the Union. In the long term, the impact of public spending is differentiated by country.From this literature review, we notice a contradictory debate between the different currents. Some support fiscal policy as an effective tool of economic policy, while others advocate neutrality and even the futility of fiscal policy to drive economic growth. With regard to these aspects, we can say that fiscal policy should be used in the sense of improving the income of economic agents. In the Congo, fiscal policy is pro-cyclical because it is expansive in a period of favorable and recessionary economic conditions.As the work cited above shows, the effects of fiscal policy on economic growth are inconclusive and vary from country to country. Some work on the inefficiency of fiscal policy instruments, while others have shown the effectiveness of the fiscal policy. The methodology adopted in this study will be based on the empirical approach.
3. Methodology
3.1. Presentation of the Model
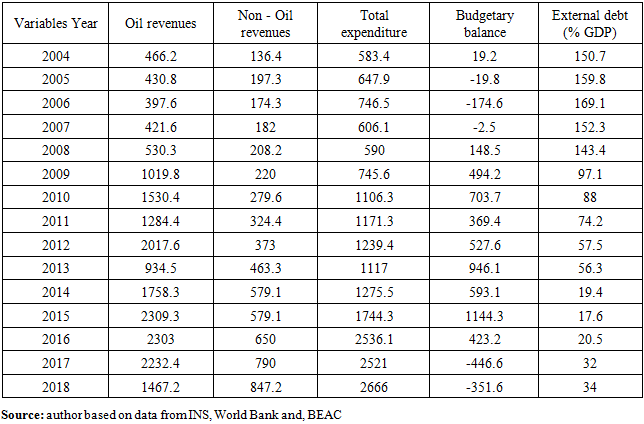
- It is based on the empirical approach because of the use of statistical data and econometric analysis. The statistical data cover a number of indicators of fiscal policy and economic growth as well as an external indicator. The data used were taken at the World Bank and cover the period from 2004 to 2018. The regression of this study will be done by using Stata 13 software and MS Excel 2016.In this work, we will use total public expenditure, private investment rate, oil revenue, non-oil revenue, operating expenses and, GDP. Fiscal policy variables are oil revenues, non-oil revenues, total expenditures, operating expenses, economic growth represented by nominal GDP, and an external variable which is the private investment rate.
3.2. Justification of the Choice of Variables
- Operating expenses (OE) are important because of the financing of revenues that will allow activities in the economy.Oil revenues (OR) were taken into account because of their importance in the composition and financing of the Congo budget.Non-oil revenue (NOR) has been incorporated into this model to show the contribution of the non-oil sector to Congo's economic growth.Gross Domestic Product (GDP) is an economic indicator that measures the domestic economic output of a country. The purpose of GDP is to quantify the wealth produced by a state over a given period, usually a year or quarter, by economic agents resident in the country concerned.Public expenditure (PE) is the total expenditure made by public administrations. Their financing is provided by public revenues (taxes, taxes, and social security contributions) and by the public surplus.The investment rate (IR) measured by the Gross Fixed Capital Formation of the private sector compared to the GDP. Capital accumulation is expected to have a positive effect on growth.
3.3. Linear Regression Equation
- Our economic model is based on the estimation of a common linear least squares (OLS) multiple linear regression model whose shape is as follows.
 | (1) |
 Constant
 The parameters of the explanatory variables
 The error term; t indexing the years
3.4. Descriptive Analysis, the Econometric and Economic Interpretation
3.4.1. Presentation of the Descriptive Analysis of the Evolution of the Variables of Fiscal Policy and Economic Growth
- GDP, which means the gross domestic product, is the final result of the productive activity of the producing units of a country. It is the sum of the added values, that is, the value of the production of goods and services by economic agents within the country, whatever their nationality.
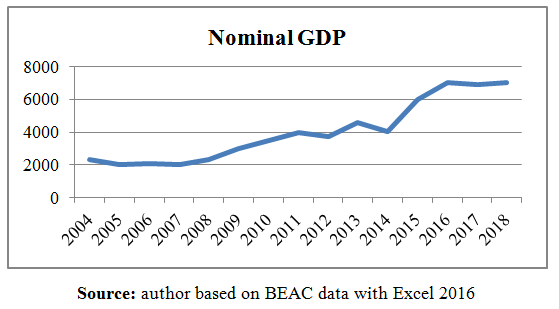 | Graph 1. Evolution of the Congo's Nominal GDP |
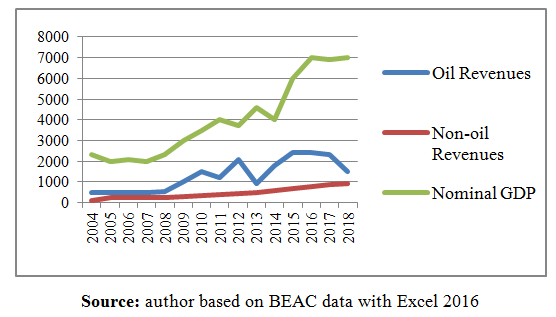 | Graph 2. Comparative Evolution of Nominal GDP, Oil Revenues, and Non-Oil Revenues |
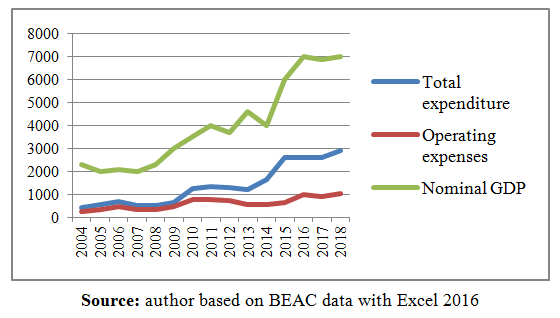 | Graph 3. Comparative evolution of nominal GDP and operating expenditures, total expenditures |
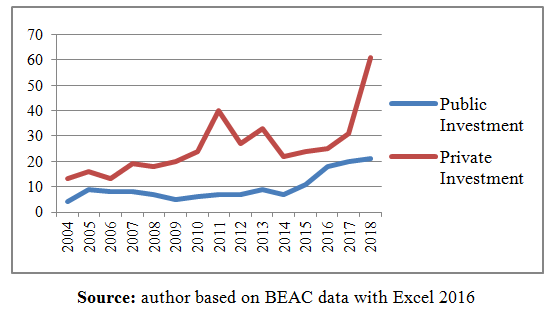 | Graph 4. Comparative evolution of public and private investment rates as a percentage of GDP |
|
4. Model Validation
- In this section, we will present the results and interpretations of the econometric model estimating the impact of fiscal policy on growth.
4.1. Normality Test
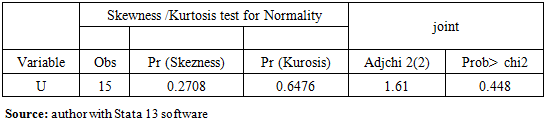
- The analysis begins with the normality test of the residuals from the chi-square law. This test makes it possible to know if the errors follow or not a normal law. This test makes it possible to know if the errors follow or not a normal law.The assumption of the Test is written as follows:• H0 (null hypothesis): the residues follow a normal distribution• H1 (alternative hypothesis): the residues do not follow a normal distributionThe decision rule is to accept the null hypothesis (H0) if the probability associated with the F test greater than 5% (0.05).
|
4.2. Auto-correlation Test
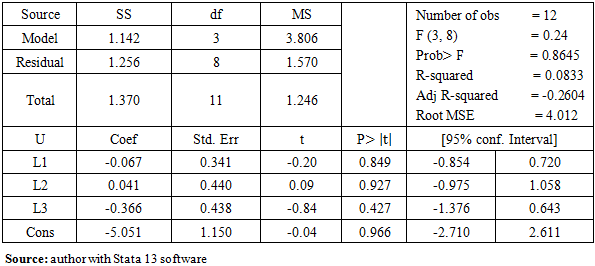
- For a delay n = 3 yearsThe Fisher test is a test of the joint significance of the coefficients of the model. This test allows us to test the significance of all the coefficients of the model, in other words, to know if the variables taken in our model with the exception of the constant make it possible to explain the endogenous variable GDP.He introduces himself as follows:• H0: the coefficients of the variables are not significant• H1: the coefficients of the variables are significantThe decision criterion is to accept the hypothesis (H1) if the probability associated with the Fisher test is greater than 10%.The results of the autocorrelation test in Table 3 show that the probability associated with the Fisher statistic is 0.8645 greater than 10%, the error of one year does not influence the following year, they are independent, then model residues are not self correlated.
|
4.3. Fisher's Test
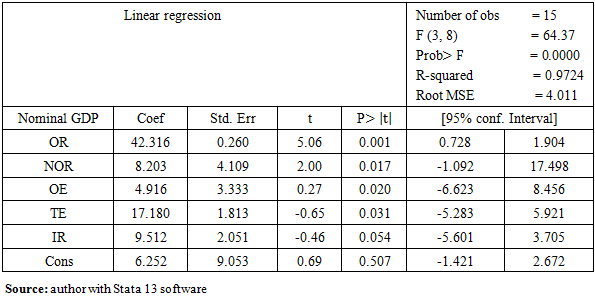
- The test results show that the probability associated with the Fisher F statistic (3, 8) = 64.37 is equal to 0.000, less than 1%, which means that the variables of the model are jointly significant at the 1% threshold.
4.4. Adjustment Quality
- Given the nature of the data, the quality of the adjustment is made from the R-squared statistic and the joint significance test of the model variables (Fisher test) in Table 3.
5. The Economic Interpretation of the Results
- Our model presents a significant variables.
5.1. Statistically Significant Variables
- All the variable are statistically significant. Overall, the results presented in Table 4 shows that the statistical characteristics are reasonable and the robustness of this model seems satisfactory. However, the coefficients appear to be acceptable in comparison with other results obtained in other studies of developing countries, especially oil. This seems to reflect the obvious dependence of Congolese economic growth on the oil sector.
|
5.1.1. Oil Revenues
- The positive impact of the oil revenue variable on the nominal GDP is explained by the fact that the Congolese economy is highly dependent on oil. Oil accounts for 75% of budget revenues and 80% of exports (PND 2012-2016). This proves the efficiency of oil revenues.For the economists Brunnschweiler and Bulte [7], the abundance of the resource expressed as the value of the assets of the subsoil has a positive impact on growth. Mideksa [8], working on the impact of the petroleum product on the Norwegian economy, concludes that since the mid-1970s, about 20% of the increase in annual GDP per capita is attributable to oil resources such as oil, natural gas and, natural gas liquids and condensates.
5.1.2. Non-oil Revenue
- Our results confirm those found by Awe and Ajayi [9] who showed empirical evidence of the contribution of the non-oil sector in the diversification of the non-oil revenue base in Nigeria. The main focus of the study was to assess the impact of income from agriculture, solid minerals and manufactured goods on GDP, in order to determine the development effect of non-oil income economical thanks to the use of the co-integration analytical test. The study showed that there is a dynamic relationship between non-oil sector revenues and economic development.Ude and Agodi [10] used the cointegration methodology with the error correction mechanism to study the impact of non-oil revenues on economic growth in Nigeria. They used annual data ranging from 1980 to 2013. The non-oil variables analyzed were agricultural incomes and manufacturing incomes. The results of non-oil variables showed a significant impact on economic growth in Nigeria.
5.1.3. Total Expenditure and Operating Expenditure
- Morley and Perdikis [5] conclude that there is a long-term positive effect of total public spending on Egyptian growth. Likewise Reinikka and Svensson [11] also noted that economic growth was significantly justified by public spending in a time series study carried out in Uganda.Some researchers note a one-way causal relationship from public spending to economic growth. Kacou [12] using a Granger test shows that it is public spending that causes growth in Ivory Coast. Safa [13], by applying cointegration and causation in the sense of Granger to the Turkish data, finds that it is the Keynesian vision that is verified. Keho [14] reaches this same conclusion for the case of Ivory Coast. Our results confirm those found by the aforementioned authors.
5.1.4. Private Investment Rate
- Warner [15] points out that, on average, the evidence shows a weak positive association between public investment in the short and long term. In addition, although international organizations recommend that developing countries depend mainly on private investment because they stimulate economic growth more than other types of capital inflows, Nunnenkamp & Spatz [16], Saqib et al. [17] finds that private investment negatively affects economic growth while public domestic investment has a positive effect on economic growth in Pakistan. Our results confirm those found by the aforementioned authors.
6. Conclusions
- This study aims to assess the impact of fiscal policy on economic growth in Congo. To achieve this objective, we used the econometric approach using the simple linear regression model as a technique that allowed us to obtain the following results: public revenues have a positive and significant impact on economic growth. On the other hand, operating and investment expenditures influence positive and high proportions of economic growth.Indeed, this work has presented the importance of fiscal policy in the process of economic growth during the study period in Congo. In this study, the revenues that were used to finance public expenditures are oil revenues and non-oil revenues. However, it must be said that the Congo has not always managed to effectively use the wealth from its hydrocarbons. On the contrary, instability in public spending has often had detrimental effects that have hurt the private non-hydrocarbon sector and created uncertainty and adjustment costs. At the same time, the public sector has not always been able to use hydrocarbon wealth productively by investing in projects that can boost economic growth. Like other resource-based economies, Congo has not, to date, been able to use hydrocarbon wealth to create the conditions for sustainable economic growth and sustained economic development faster. The instability of oil prices is reflected in a deep instability of fiscal revenues and can have a very detrimental effect on the continuation of the fiscal policy of a country like the Congo, where hydrocarbon revenues represent a substantial part of budgetary revenues. Public expenditure is the main mechanism by which instability in the hydrocarbon sector is transmitted to the non-hydrocarbon sector.To prevent revenue instability from being transmitted to the economy outside the oil sector, there must be a decoupling between the use of oil revenues and the management of current revenues. Budgetary expenditures should be established independently of oil revenues. As for the unexpected receipts, they must be sterilized by assigning them to the repayment of the public debt or the acquisition of financial assets. The implementation of such a fiscal policy could be facilitated by the preparation of the budget in a medium-term framework and the adoption of budgetary principles to guide decisions. Medium-term fiscal frameworks increase budget transparency by highlighting the future consequences of increases in current expenditures (for example, future maintenance costs for capital projects), thus limiting short-term pressures on expenditures that arise following a temporary increase in oil revenues. A fiscal framework based on an appropriate indicator of the fiscal stance helps to mitigate the pressure on expenditures resulting from revenue instability.